
The VIX ticker (^VIX) on Yahoo Finance tracks the Cboe Volatility Index, a real-time benchmark measuring the market's expectation of 30-day forward volatility in the S&P 500 index. Yahoo Finance displays this metric through implied volatility derived from S&P 500 option prices, providing market observers with an accessible gauge of broader equity market risk, uncertainty, and investor sentiment.
Disclaimer: This article is provided for educational and informational purposes only and does not constitute financial, investment, or trading advice. Financial markets, options, and volatility-linked derivatives carry inherent risk.
What Is the VIX? Demystifying the Market's "Fear Gauge"
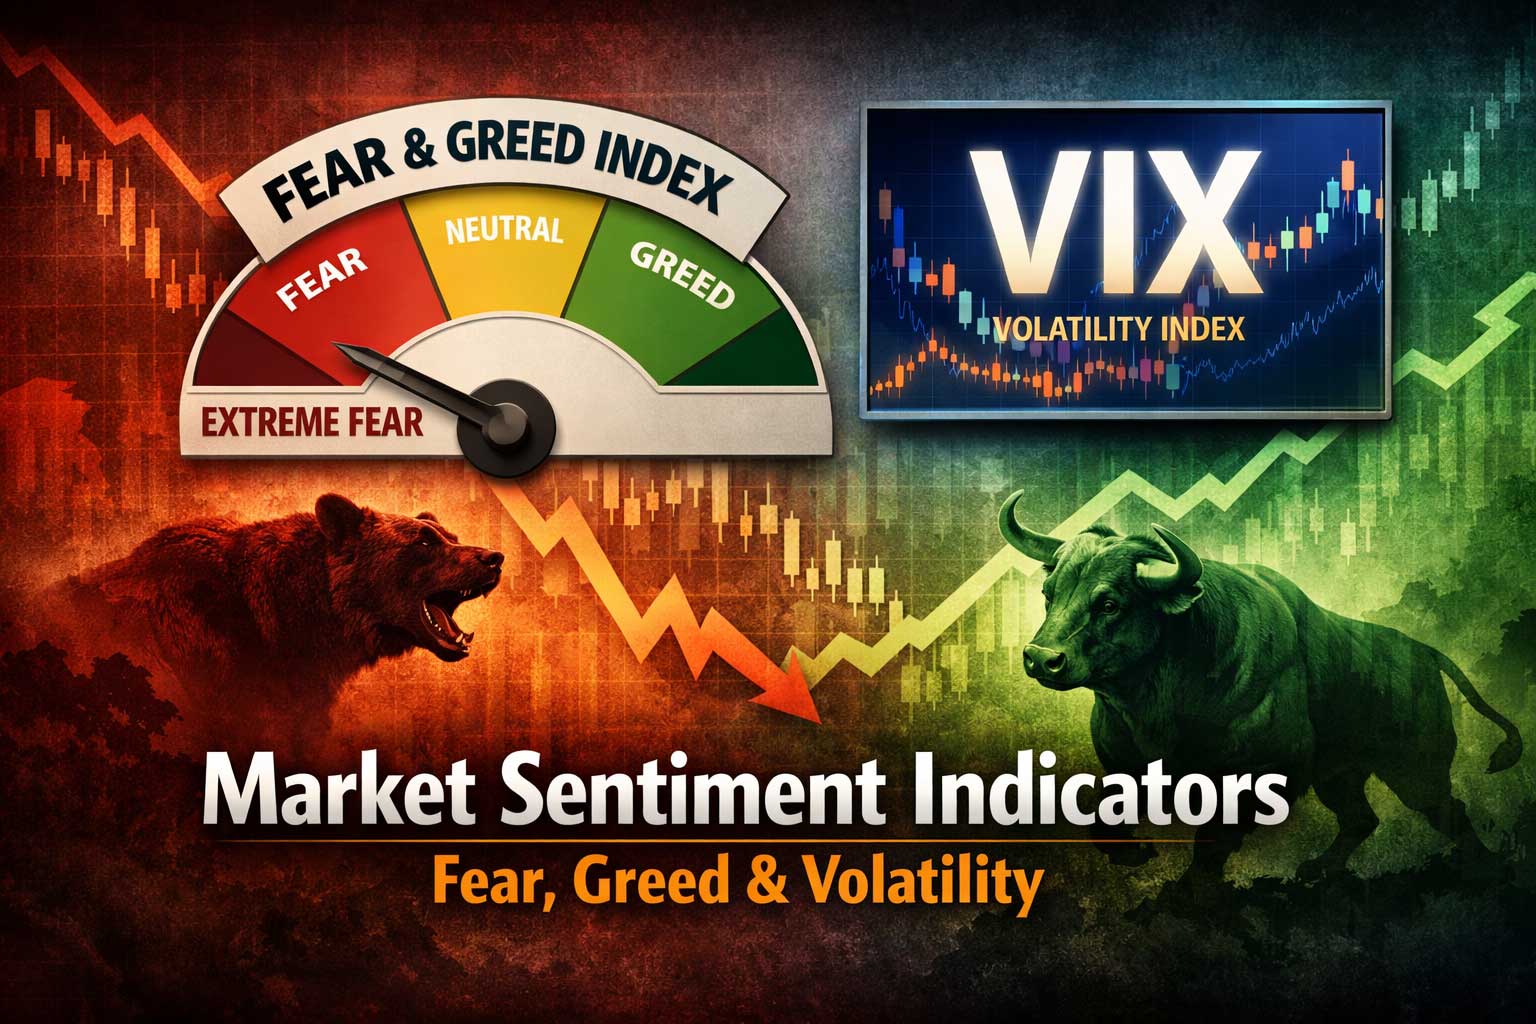
Created by Cboe Global Markets (formerly the Chicago Board Options Exchange) in 1993 and modernized in 2003, the Cboe Volatility Index (VIX) measures expected market volatility over the next 30 calendar days. While headlines frequently label the VIX as Wall Street's "fear index," technical observers understand it more precisely as a measurement of consensus market uncertainty.
The VIX does not measure directional trend; it measures expected magnitude of movement. Whether market participants anticipate a sharp rally or a severe drop, elevated price fluctuations drive options premiums higher, which in turn increases the VIX value. However, because equity markets historically drop faster than they rise—a dynamic driven by panic selling and portfolio hedging—the VIX displays a strong inverse correlation with the S&P 500 (^GSPC).
When stock prices decline rapidly, demand for protective put options surges. Institutional portfolio managers rush to hedge downstream risk, bidding up the implied volatility of options contracts. This demand causes the VIX to spike. Conversely, during sustained bull markets, steady buying pressure and muted demand for downside portfolio protection cause option premiums to compress, dragging the VIX down to multi-month or multi-year lows.
- S&P 500 Index (
^GSPC) (Aggressive Sell-Off / Downward Trend)- Surge in Demand for Protective Put Options
- Option Implied Volatility (Options Premiums Increase)
- Cboe VIX Index (
^VIX) (Spikes Upward)
Locating and Reading ^VIX on Yahoo Finance
For retail investors, journalists, and financial analysts, Yahoo Finance provides one of the most accessible free platforms for observing volatility dynamics. Accessing the metric simply requires entering the standard symbol ^VIX into the search bar on the platform.
Core Data Fields Displayed on the ^VIX Quote Page
When evaluating the ^VIX quote page on Yahoo Finance, market observers will notice key fields that differ slightly in interpretation from standard equity quotes:
- Last Price / Index Level: Represents the current annualized percentage volatility expected over the next 30 days. For instance, a quote of
18.50implies an expected annualized movement of 18.50% in the S&P 500 index over the coming month. - Day's Range (Low - High): Shows the minimum and maximum index values recorded during the current trading session. Rapid intra-day expansion of this range signals sudden changes in options pricing dynamic, often coinciding with macroeconomic news or geopolitical developments.
- 52-Week Range: Establishes the macro volatility regime. Comparing the current VIX level against its 52-week high and low reveals whether market risk pricing is currently suppressed, elevated, or near historical extremes.
- Previous Close & Open: Helps track overnight structural shifts in market sentiment, particularly when opening values gap significantly higher due to international market movements or morning economic releases (such as CPI inflation reports or employment data).
Interactive Charting and Technical Indicators
Yahoo Finance allows users to customize the ^VIX interactive chart to gain deeper analytical context:
- Overlays with the S&P 500 (
^GSPC): Using the "Comparison" tool to plot^VIXdirectly against^GSPCvisually demonstrates the inverse relationship between index returns and volatility expectations. - Moving Averages (SMA / EMA): Applying a 50-day or 200-day simple moving average (SMA) to the VIX helps filter out daily market noise, highlighting baseline trends in volatility regime shifts.
- Relative Strength Index (RSI): While RSI is traditionally applied to trending equities, on the VIX it helps identify extreme volatility spikes that are statistically prone to mean reversion.
Technical Mechanics: How the VIX Is Calculated
To interpret the figures shown on Yahoo Finance correctly, market observers must understand the structural mathematics behind the index. The VIX is not based on historical price movement (realized volatility); instead, it is a forward-looking calculation based on market prices for SPX options.
The Role of Implied Volatility
Options pricing models, such as the classic Black-Scholes model, factor in underlying asset price, strike price, time to expiration, risk-free interest rates, and expected volatility. By reversing the formula—taking the observable market prices of traded options and solving for volatility—analysts derive implied volatility (IV). High IV indicates that traders are paying high premiums for options contracts relative to the underlying stock price.
Model-Free Variance Calculation
The Cboe calculates the VIX using a non-parametric formula that aggregates weighted prices of out-of-the-money (OTM) calls and puts across two expiration dates surrounding the 30-day target window. The technical methodology, fully documented in the Cboe VIX White Paper, integrates options expiring between 23 and 37 days out, interpolating them to arrive at a constant 30-day measure of expected variance:
$$\sigma^2 = \frac{2}{T} \sum_{i} \frac{\Delta K_i}{K_i^2} e^{RT} Q(K_i) - \frac{1}{T} \left( \frac{F}{K_0} - 1 \right)^2$$
Where:
- $T$ is time to expiration (in fraction of a year).
- $P(K_i)$ and $C(K_i)$ are market prices of options at strike $K_i$.
- $F$ is the forward index level derived from option prices.
- $K_0$ is the first strike price below the forward index level $F$.
The annualized volatility figure displayed on Yahoo Finance is simply the square root of this calculated variance ($\sigma \times 100$).
Translating the Annualized Number to Daily Expected Movement
Because the VIX quote represents an annualized standard deviation, observers can use the "Rule of 16" (derived from the square root of approximately 252 trading days per year, $\sqrt{252} \approx 15.87$) to estimate expected daily moves in the S&P 500:
$$\text{Expected Daily S&P 500 Move (%)} \approx \frac{\text{VIX Level}}{16}$$
- Example 1: If Yahoo Finance displays a VIX quote of 16.00, the market projects a daily S&P 500 move of approximately 1.00% ($16 / 16$).
- Example 2: If the VIX spikes to 32.00, the market projects an average daily move of roughly 2.00% ($32 / 16$) over the next month.
Market Observer Cheat Sheet: Interpreting VIX Levels
The baseline level of the VIX provides instant operational context regarding broad market conditions. The following reference table outlines standard historical bands, institutional market contexts, and observer guidelines.
| VIX Range | Market Sentiment Regime | Typical S&P 500 Environment | Analytical & Operational Interpretation |
|---|---|---|---|
| 0 – 12 | Extreme Complacency | Protracted bull trends, low daily trading ranges, tight credit spreads. | Options premiums are historically cheap. High risk of sudden volatility expansion if unexpected shocks occur. |
| 13 – 19 | Normal / Balanced | Steady baseline growth, typical market pullbacks, predictable earnings cycles. | Represents historical baseline equity conditions. Hedging costs are balanced; risk appetite remains healthy. |
| 20 – 29 | Elevated Stress | Increased market choppiness, correction territory (-5% to -10%), macro uncertainty. | Investors actively purchasing downside protection. Intraday swings widen; liquidity across underlying stocks begins to thin. |
| 30 – 39 | Severe Turbulence | High market anxiety, formal equity market corrections (-10% to -20%), policy instability. | Widespread panic buying of options. Rapid daily directional swings; margin calls and deleveraging accelerate across hedge funds. |
| 40+ | Extreme Panic / Crisis | Major bear market capitulation, systemic crisis (e.g., 2008 Financial Crisis, 2020 COVID crash). | Historical market bottoms often form within or shortly after extreme spikes above 40-50 as emotional selling peaks. |
Limitations of Relying on Yahoo Finance for VIX Data
While Yahoo Finance is an invaluable free source for general observation, market professionals must account for structural platform limitations when monitoring ^VIX.
1. Data Delays vs. Real-Time Feeds
For non-subscribed users, index data on Yahoo Finance may be subject to a 15-minute delay depending on regional exchanges and user session settings. During fast-moving market crashes or major federal reserve interest rate announcements, a 15-minute delay in volatility readings can present a distorted view of spot market pricing. Observers requiring sub-second updates must utilize direct exchange data feeds or institutional broker platforms.
2. Spot Index vs. Tradable Futures
The primary Yahoo Finance quote page for ^VIX displays the spot index level. The spot VIX is a purely theoretical mathematical calculation—it cannot be purchased or sold directly.
To gain exposure to volatility, market participants trade VIX futures contracts (/VX), options on the VIX, or volatility-linked exchange-traded products (ETPs). VIX futures frequently trade at a premium or discount to the spot index visible on Yahoo Finance, creating divergence between what the Yahoo Finance chart shows and where tradable products are actually pricing.
3. Settlement Dynamics
VIX options and futures settle against a special morning calculation called the Special Opening Quotation (SOQ), designated under the ticker VRO. The spot VIX value displayed on Yahoo Finance at market close on Tuesday evening may not equal the final cash settlement price determined during Wednesday morning's SOQ calculation.
VIX Futures, Contango, and ETF Traps: What Observers Must Know
One of the most frequent errors made by retail observers tracking ^VIX on Yahoo Finance is assuming that buying a VIX-linked Exchange-Traded Fund (ETF) or Exchange-Traded Note (ETN)—such as the iPath Series B S&P 500 VIX Short-Term Futures ETN (VXX) or the ProShares Ultra VIX Short-Term Futures ETF (UVIX)—will match the percentage moves seen on the ^VIX index page.
- Contango (Normal Market Condition)
- Vertical Axis: VIX Price ($)
- Horizontal Axis: Time to Expiration
- Spot VIX:
X (Spot VIX) - VIX Futures Curve: Rising curve over time to expiration
- Front-Month Futures: Cost More Than Spot
Understanding the Volatility Term Structure
Because spot VIX is untradable, financial institutions issue VIX products backed by VIX futures contracts. The curve of these futures prices relative to expiration dates determines the performance of exchange-traded products:
- Contango (Normal Market State): Under typical conditions, long-dated futures contracts trade at a higher price than short-dated contracts or spot VIX (i.e., Month 2 Futures > Month 1 Futures > Spot VIX). Because long-volatility ETFs must constantly sell expiring front-month futures and buy higher-priced second-month futures to maintain exposure, they incur a continuous cost known as negative roll yield. Over time, this structural decay causes products like VXX to lose value long-term, even if the spot
^VIXon Yahoo Finance remains unchanged. - Backwardation (Crisis Market State): During market panics, short-dated futures surge dramatically above long-dated futures (i.e., Spot VIX > Month 1 Futures > Month 2 Futures). In backwardation, roll yield becomes positive, causing long volatility products to surge rapidly alongside spot
^VIX.
Due to these mechanics, regulatory authorities such as the FINRA Investor Alerts and the U.S. Securities and Exchange Commission (SEC) regularly caution retail investors that volatility-linked ETPs are intended strictly as short-term tactical hedging vehicles, not long-term buy-and-hold investments.
Advanced Metrics: Complementing ^VIX Analysis
To extract actionable insight from Yahoo Finance data, experienced observers pair the main ^VIX quote with related volatility metrics:
1. VVIX (The Volatility of the VIX)
Available on Yahoo Finance under ticker ^VVIX, this index measures the implied volatility of options written on VIX futures. While ^VIX forecasts expected variance in the S&P 500, ^VVIX forecasts expected variance in the VIX itself.
- Analytical Signal: When
^VVIXrises while^VIXremains flat, option traders are actively bidding up tail-risk protection on volatility spikes, signaling an impending breakout in market turbulence.
2. S&P 500 Implied Volatility vs. Realized Volatility
Comparing the expected volatility (^VIX) against actual historical performance over the preceding 30 days (Realized Volatility) reveals the Volatility Risk Premium (VRP). Option sellers profit when implied volatility persistently trades above realized volatility, reflecting an over-payment by option buyers for protection that ultimately goes unused.
3. Alternative Index Volatility Trackers
Yahoo Finance hosts secondary volatility indexes published by Cboe covering other major asset classes:
^RVX(Cboe Russell 2000 Volatility Index): Tracks implied volatility in small-cap domestic equities.^VXN(Cboe Nasdaq 100 Volatility Index): Measures implied volatility across mega-cap technology and growth stocks.^VXD(Cboe DJIA Volatility Index): Reflects volatility expectations for blue-chip industrial equities.
Strategic Applications for Market Observers
Whether analyzing markets for academic research, financial reporting, or personal portfolio management, understanding how to apply ^VIX data from Yahoo Finance improves overall decision-making:
Identifying Tactical Market Bottoms
Because the VIX is mean-reverting, extremely high spikes (typically above 35 or 40) indicate widespread liquidations and panic selling. Historical market data shows that sharp downward reversals in ^VIX from extreme high levels often coincide with attractive medium-to-long-term entry points for equity investors, as sell-side exhaustion takes hold.
Portfolio Hedging Timing
When the VIX trades at historical lows (under 13), option premiums across single stocks and index ETFs compress significantly. For portfolio managers seeking to acquire broad downside protection via index put options, period lows on Yahoo Finance's ^VIX chart highlight environments where portfolio insurance is cost-effective to implement.
Position Sizing Adjustments
Quantitative risk managers adjust position sizing inversely to volatility dynamics. When ^VIX rises into high regimes (25+), expected daily price fluctuations expand proportionally. Reducing position sizing during high VIX environments maintains total portfolio risk exposure at consistent, manageable levels.
Frequently Asked Questions
Why does ^VIX on Yahoo Finance sometimes drop when the stock market also drops?
While the VIX generally has an inverse relationship with the S&P 500, both can fall simultaneously under specific conditions. If an expected risk event passes (such as an election result or major corporate earnings report), option uncertainty drops quickly. This rapid decay in options pricing ("volatility crush") can pull the VIX down even if stock prices post minor losses.
What is the difference between ^VIX and ^GSPC on Yahoo Finance?
^GSPC is the ticker symbol for the S&P 500 Index, which tracks the price performance of 500 large-cap U.S. companies. ^VIX is the ticker for the Cboe Volatility Index, which tracks the market's expected 30-day volatility derived from SPX options prices. ^GSPC measures actual equity value, whereas ^VIX measures market uncertainty.
Can I buy shares of ^VIX directly on Yahoo Finance or through my brokerage account?
No. The VIX index is a calculated mathematical benchmark, not a tradable asset. You cannot purchase shares of ^VIX directly. To gain financial exposure to volatility trends, investors use derivative instruments such as VIX futures, VIX options, or exchange-traded products like VXX, UVIX, or SVIX.
What does it mean when the VIX experiences a "volatility crush"?
A volatility crush occurs when implied volatility falls rapidly following the resolution of a major market event. Because high uncertainty inflates options premiums prior to an event, once the outcome is known, option demand evaporates. The underlying VIX drops sharply, causing option prices to lose premium regardless of underlying directional price movement.
How accurate is the 15-minute delayed data on free financial portals for tracking VIX?
For general trend observation, daily analysis, and macroeconomic tracking, delayed VIX data on free portals like Yahoo Finance is completely adequate. However, for intraday options trading, automated algorithmic execution, or real-time risk hedging, market participants require real-time streaming data directly from exchange feeds to avoid execution slipping due to price latency.
Next Steps for Market Observers
To incorporate ^VIX analysis effectively into your market observation workflow:
- Set Up a Custom Watchlist: Add
^VIX,^GSPC,^VXN, and^VVIXinto a unified Yahoo Finance quote portfolio to monitor relative shifts across market volatility and broad equities simultaneously. - Monitor the Term Structure: Track the spread between spot VIX and front-month VIX futures contracts to determine whether market volatility pricing is operating in contango or backwardation before using volatility-linked funds.
- Cross-Reference Macro Economic Events: Compare daily VIX price moves alongside scheduled events on the economic calendar—such as Federal Open Market Committee (FOMC) interest rate announcements and inflation data releases—to observe how markets price and resolve event-driven risk.
Image Gallery
Select an image to open it in a new tab.

Omar Farooq
EdTech Innovation and Virtual Pedagogy Journalist
