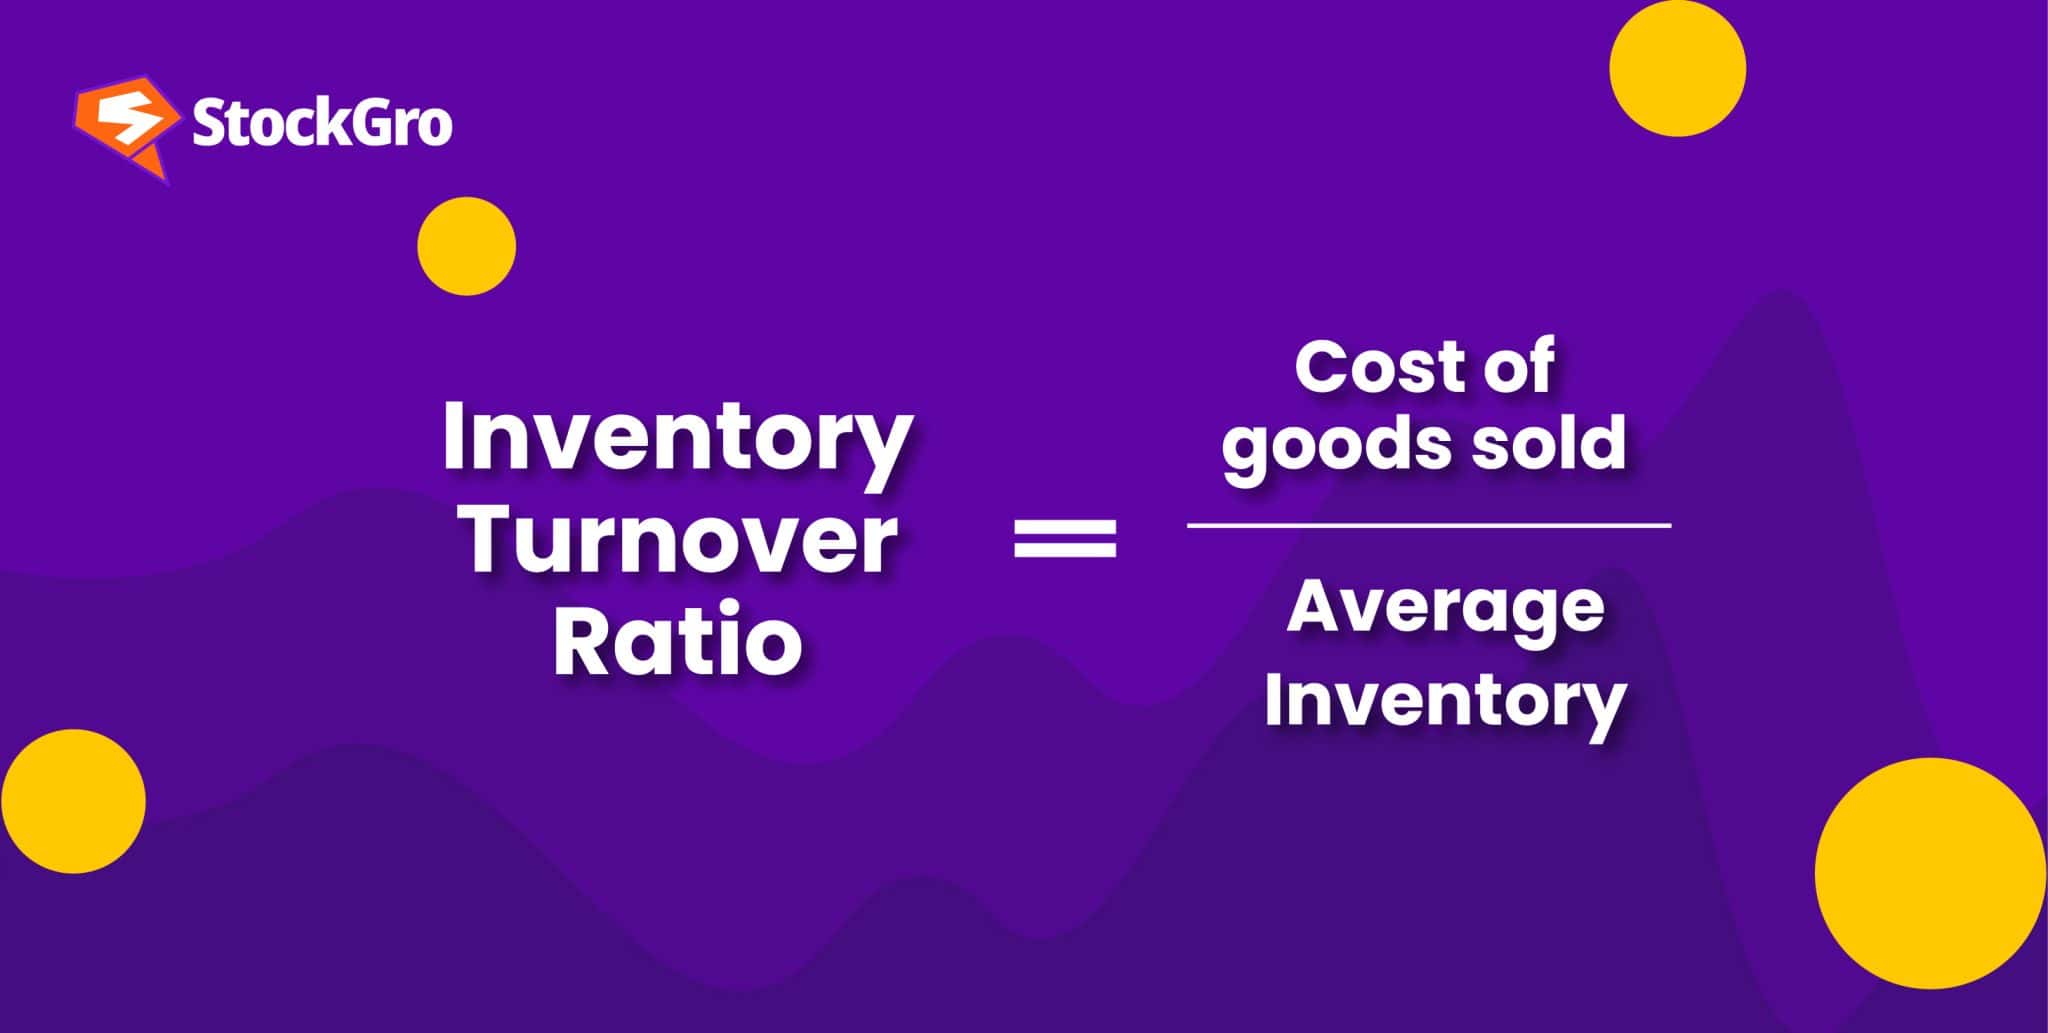
Inventory turnover is a critical financial metric that measures how many times a company sells and replaces its stock over a specific period, typically a year or quarter. By dividing the Cost of Goods Sold (COGS) by the average inventory, businesses determine operational efficiency, liquidity, and the overall health of their supply chain and sales strategies.
Understanding the efficiency of your warehouse and sales floor is paramount for maintaining healthy cash flow. In 2026, where supply chain volatility remains a factor in global commerce, mastering the inventory turnover ratio allows managers to identify stagnant stock, optimize purchasing cycles, and ensure that capital is not unnecessarily tied up in depreciating assets. This overview provides a deep dive into the methodology, interpretation, and optimization of this essential KPI.
The Core Formula for Inventory Turnover
To calculate the inventory turnover ratio, you require two primary figures from your financial statements: the Cost of Goods Sold (COGS) and the Average Inventory. The standard formula is as follows:
Inventory Turnover Ratio = Cost of Goods Sold (COGS) / Average Inventory
While some analysts use total sales revenue instead of COGS, this is generally considered less accurate. Sales revenue includes a "markup" (profit margin), whereas inventory is recorded at cost. Using sales revenue in the numerator can artificially inflate the turnover ratio, leading to a distorted view of physical stock movement.
Determining the Cost of Goods Sold (COGS)
COGS represents the direct costs associated with producing or purchasing the goods sold by a company. This includes the cost of materials, direct labor, and factory overhead. It excludes indirect expenses like distribution and sales force costs. For a retailer, COGS is essentially the purchase price of the items sold. For a manufacturer, it is a more complex calculation involving raw materials and work-in-progress. You can typically find this figure on the company’s Income Statement for the period in question.
Calculating Average Inventory
Inventory levels fluctuate daily due to shipments and sales. Using a single point-in-time figure (like the ending inventory on a balance sheet) can be misleading, especially for seasonal businesses. To normalize these fluctuations, we use the average inventory:
Average Inventory = (Beginning Inventory + Ending Inventory) / 2
Beginning inventory is the value of stock at the start of the period, while ending inventory is the value at the close. Both figures are found on the Balance Sheet. In 2026, many sophisticated firms use a "rolling average" across 12 months to provide an even more granular and accurate reflection of their typical stock levels.
Step-by-Step Calculation Guide
Calculating inventory turnover is a straightforward process when the financial data is organized. Follow these steps to ensure accuracy:
- Select the Timeframe: Decide if you are measuring turnover for a fiscal year, a quarter, or a month. Consistency is key when comparing performance over time.
- Locate COGS: Pull the Income Statement for the selected period. Find the line item labeled "Cost of Goods Sold" or "Cost of Sales."
- Identify Inventory Values: Pull the Balance Sheets for both the start and the end of your selected period. For a 2026 annual report, you would look at the balance as of January 1 and December 31.
- Compute the Average: Add the beginning and ending inventory values together and divide by two.
- Final Division: Divide the COGS by the Average Inventory.
Example Calculation
Imagine a specialized electronics retailer in 2026.
- COGS for the Year: $1,200,000
- Beginning Inventory (Jan 1): $150,000
- Ending Inventory (Dec 31): $250,000
- Average Inventory: ($150,000 + $250,000) / 2 = $200,000
- Inventory Turnover: $1,200,000 / $200,000 = 6.0
This result means the company "turned" its entire inventory six times during the year, or roughly once every two months.
Interpreting Your Turnover Ratio
A "good" inventory turnover ratio is not a fixed number; it varies significantly by industry. However, general principles apply when evaluating the results.
High Inventory Turnover
Generally, a high turnover ratio is viewed positively. It suggests that goods are sold quickly, minimizing storage costs and reducing the risk of stock becoming obsolete or spoiled. This is particularly vital in industries with perishable goods or fast-moving technology. However, an excessively high ratio might indicate that the company is not carrying enough stock, which can lead to frequent stockouts and lost sales opportunities.
Low Inventory Turnover
A low ratio often signals "dead stock" or overstocking. This indicates that products are sitting in the warehouse for too long, tying up capital that could be used elsewhere. Low turnover can be caused by poor marketing, declining demand, or over-purchasing. For industries with high-value items, such as luxury automobiles or heavy machinery, a lower turnover ratio is normal and expected compared to a grocery chain.
| Industry Sector | Typical Turnover Range | Why it Varies |
|---|---|---|
| Grocery / Supermarkets | 12.0 – 20.0 | High perishability requires rapid sales cycles. |
| Consumer Electronics | 4.0 – 8.0 | Rapid obsolescence requires steady movement. |
| High-End Fashion | 2.0 – 4.0 | Seasonality and exclusivity lead to lower turns. |
| Automotive (Dealerships) | 2.0 – 3.0 | High unit cost and long decision cycles for buyers. |
| Industrial Machinery | 1.0 – 2.0 | Long manufacturing lead times and niche markets. |
The Relationship with Days Sales of Inventory (DSI)
While the turnover ratio tells you how many times you turn stock, the Days Sales of Inventory (DSI) tells you how many days it takes to turn it. This is often an easier metric for warehouse managers to visualize.
DSI = (Number of Days in Period / Inventory Turnover Ratio)
Using our previous example of a turnover of 6.0 for a 365-day year:
- DSI: 365 / 6.0 = 60.83 days
This means it takes the retailer approximately 61 days to sell its average inventory. Monitoring DSI helps businesses align their purchasing with lead times from suppliers to avoid gaps in availability.
Why Inventory Turnover Matters in 2026
In the current economic landscape of 2026, inventory turnover is more than just an accounting figure; it is a measure of resilience. Several factors have made this metric increasingly relevant:
- Storage Costs: Real estate and warehousing costs remain high. Every day a product sits on a shelf, it incurs costs for rent, climate control, insurance, and labor.
- Capital Efficiency: For small to medium enterprises (SMEs), cash flow is the lifeblood of the business. Efficient turnover ensures that cash is returned to the business quickly to pay for operating expenses or reinvest in growth.
- Risk Mitigation: Products held in inventory are subject to theft, damage, and obsolescence. In 2026, where consumer trends shift rapidly due to social media influence, holding stock for too long poses a massive financial risk.
- Lender and Investor Confidence: Banks and investors look at inventory turnover to gauge how well a management team handles its most significant current asset. A declining ratio over several periods can be a red flag for potential insolvency or mismanagement.
Common Pitfalls and Mistakes in Calculation
Even seasoned analysts can make errors when calculating inventory turnover. Avoiding these mistakes ensures the data remains actionable.
- Mixing Timeframes: Ensure the COGS and the Average Inventory cover the exact same period. Using a full year's COGS with a single month's ending inventory will yield a wildly inaccurate result.
- Including Non-Inventory Costs: Do not include administrative salaries or marketing spend in your COGS. This will inflate the numerator and give a false sense of turnover efficiency.
- Ignoring Seasonal Spikes: For businesses that do 80% of their sales in December, using a simple two-point average (Jan 1 and Dec 31) can hide the massive inventory buildup required in November. In these cases, using an average of 12 month-end inventory levels is mandatory for accuracy.
- Inconsistent Inventory Valuation: Ensure the method of valuing inventory (FIFO, LIFO, or Average Cost) remains consistent. Changing methods mid-year can distort the ending inventory value on the balance sheet.
Strategies to Optimize Your Turnover Ratio
If your calculation reveals a ratio lower than your industry benchmark, several operational levers can be pulled to improve efficiency:
- Improved Forecasting: Utilize AI-driven demand forecasting tools, which have become industry standard by 2026, to better predict customer behavior and reduce over-purchasing.
- Supplier Lead Time Reduction: Work with suppliers to implement Just-In-Time (JIT) delivery. Reducing the time it takes to receive stock allows you to carry less "safety stock."
- Aggressive Liquidation: Identify slow-moving items and use promotions or bundling to clear them. It is often better to sell an item at a slight loss than to continue paying storage costs on "dead" capital.
- SKU Rationalization: Analyze individual product performance. If 20% of your products are responsible for 80% of your sales, consider discontinuing the bottom-performing SKUs to focus resources on winners.
Frequently Asked Questions
Is a high inventory turnover always better?
Not necessarily. While a high ratio indicates efficiency, an extremely high turnover could mean you are keeping inventory levels too low. This leads to stockouts, which frustrate customers and push them toward competitors. The goal is to find the "sweet spot" where you maximize sales without excessive carrying costs.
How does inventory turnover affect the Cash Conversion Cycle (CCC)?
Inventory turnover is a primary component of the Cash Conversion Cycle. The CCC measures how long it takes for a company to convert its investments in inventory and other resources into cash flows from sales. A faster inventory turnover shortens the CCC, significantly improving the company's liquidity position.
Should I use Sales or COGS for the calculation?
You should always use the Cost of Goods Sold (COGS). Using Sales revenue includes the profit margin, which isn't reflected in the value of the inventory sitting in your warehouse. Using COGS provides a "like-for-like" comparison that is the standard for professional financial analysis.
Can inventory turnover be applied to service businesses?
No, inventory turnover is specific to businesses that sell physical goods. Service-based companies, such as consulting firms or software-as-a-service (SaaS) providers, do not hold physical inventory. They use other metrics, such as "Utilization Rate" or "Customer Acquisition Cost," to measure efficiency.
What is the difference between Inventory Turnover and Asset Turnover?
Inventory turnover specifically focuses on how quickly stock is sold. Asset turnover is a broader metric that measures how efficiently a company uses all of its assets (including property, equipment, and cash) to generate revenue. Inventory turnover is a subset of a broader efficiency analysis.
Practical Recommendations
To make the most of your inventory turnover analysis in 2026, you should not treat it as a once-a-year task. Instead, integrate it into your monthly financial reviews. Begin by benchmarking your current ratio against the top three competitors in your specific niche. If you find your turnover is lagging, conduct a "deep dive" into your SKU-level data to identify exactly which products are dragging down the average. Finally, ensure your sales and purchasing departments are in constant communication; turnover efficiency is often lost when one department buys stock that the other department isn't prepared to sell.
Image Gallery
Select an image to open it in a new tab.


Celine Dubois
Contemporary Living and Global Arts Columnist
