Understanding the Nasdaq Stock Market Chart: A Guide for Investors

Understanding the Nasdaq stock market chart involves interpreting visual representations of price movements, volume, and volatility for indices like the Nasdaq Composite or specific securities listed on the Nasdaq Stock Market. By mastering candlestick patterns, timeframes, and technical indicators, investors can translate historical price data into informed decisions regarding market trends, momentum, and potential reversal points.
The Architecture of the Nasdaq Market
To interpret a chart effectively, you must first distinguish between the Nasdaq as a marketplace and the Nasdaq as an index. The Nasdaq Stock Market is a global electronic exchange where thousands of companies list their shares. When analysts refer to "the Nasdaq chart," they most frequently mean the Nasdaq Composite Index (IXIC), which measures the performance of nearly all stocks listed on the exchange. Because this index is heavily weighted toward the technology sector, its chart movements often serve as a barometer for the broader sentiment regarding innovation, growth stocks, and high-tech capital expenditure.
A chart is essentially a time-series record. The X-axis represents time, while the Y-axis represents price. Every data point plotted is a result of supply and demand interactions occurring in real-time. When demand for shares exceeds supply, the price rises; when supply overwhelms demand, the price falls. Recognizing this simple mechanic is the first step toward moving beyond superficial observations and into true technical analysis.
Core Components of Stock Charting
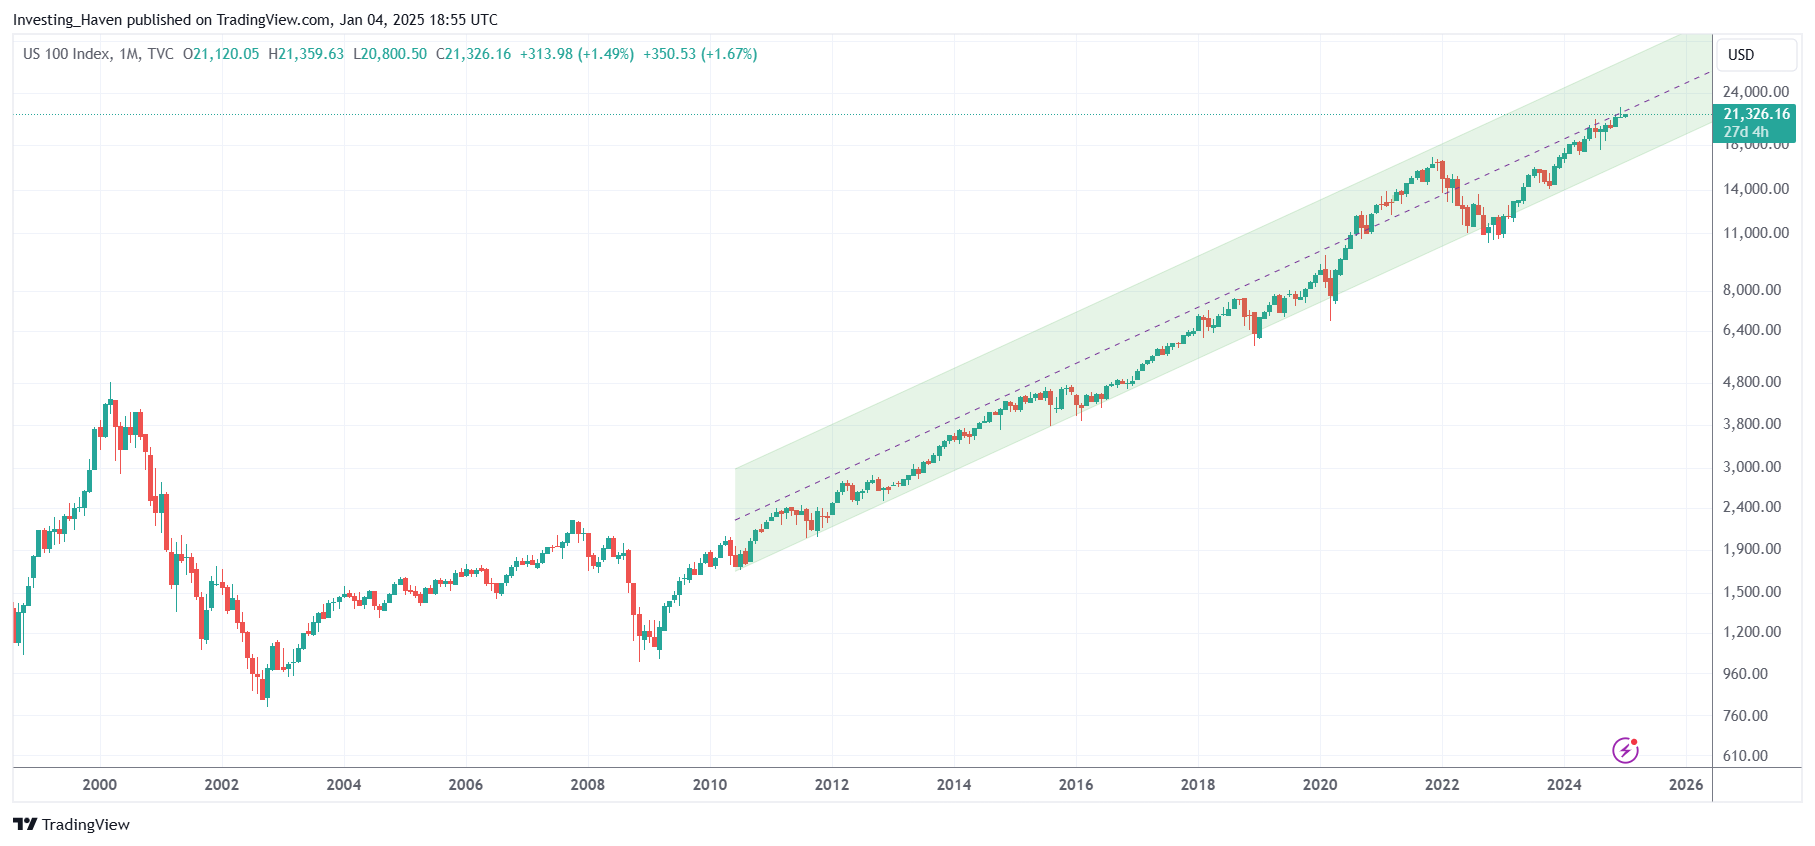
Modern charting platforms present data through various visual formats, the most prevalent being the candlestick chart. Unlike a simple line chart, which only tracks closing prices, a candlestick captures four distinct data points for a specific period: the Open, High, Low, and Close (OHLC).
Anatomy of a Candlestick
- The Body: This represents the range between the opening and closing prices. If the body is green (or white), the price closed higher than it opened, indicating bullish momentum. If red (or black), the price closed lower, suggesting bearish pressure.
- The Wicks (or Shadows): These thin lines extending from the body represent the extremes of the price action during that period. A long upper wick indicates that buyers pushed the price up, but sellers forced it back down before the session ended.
- Timeframes: A chart’s utility changes based on the chosen timeframe. A 1-minute chart captures high-frequency day trading activity, while a weekly or monthly chart filters out short-term "noise," allowing investors to identify long-term structural trends in the Nasdaq.
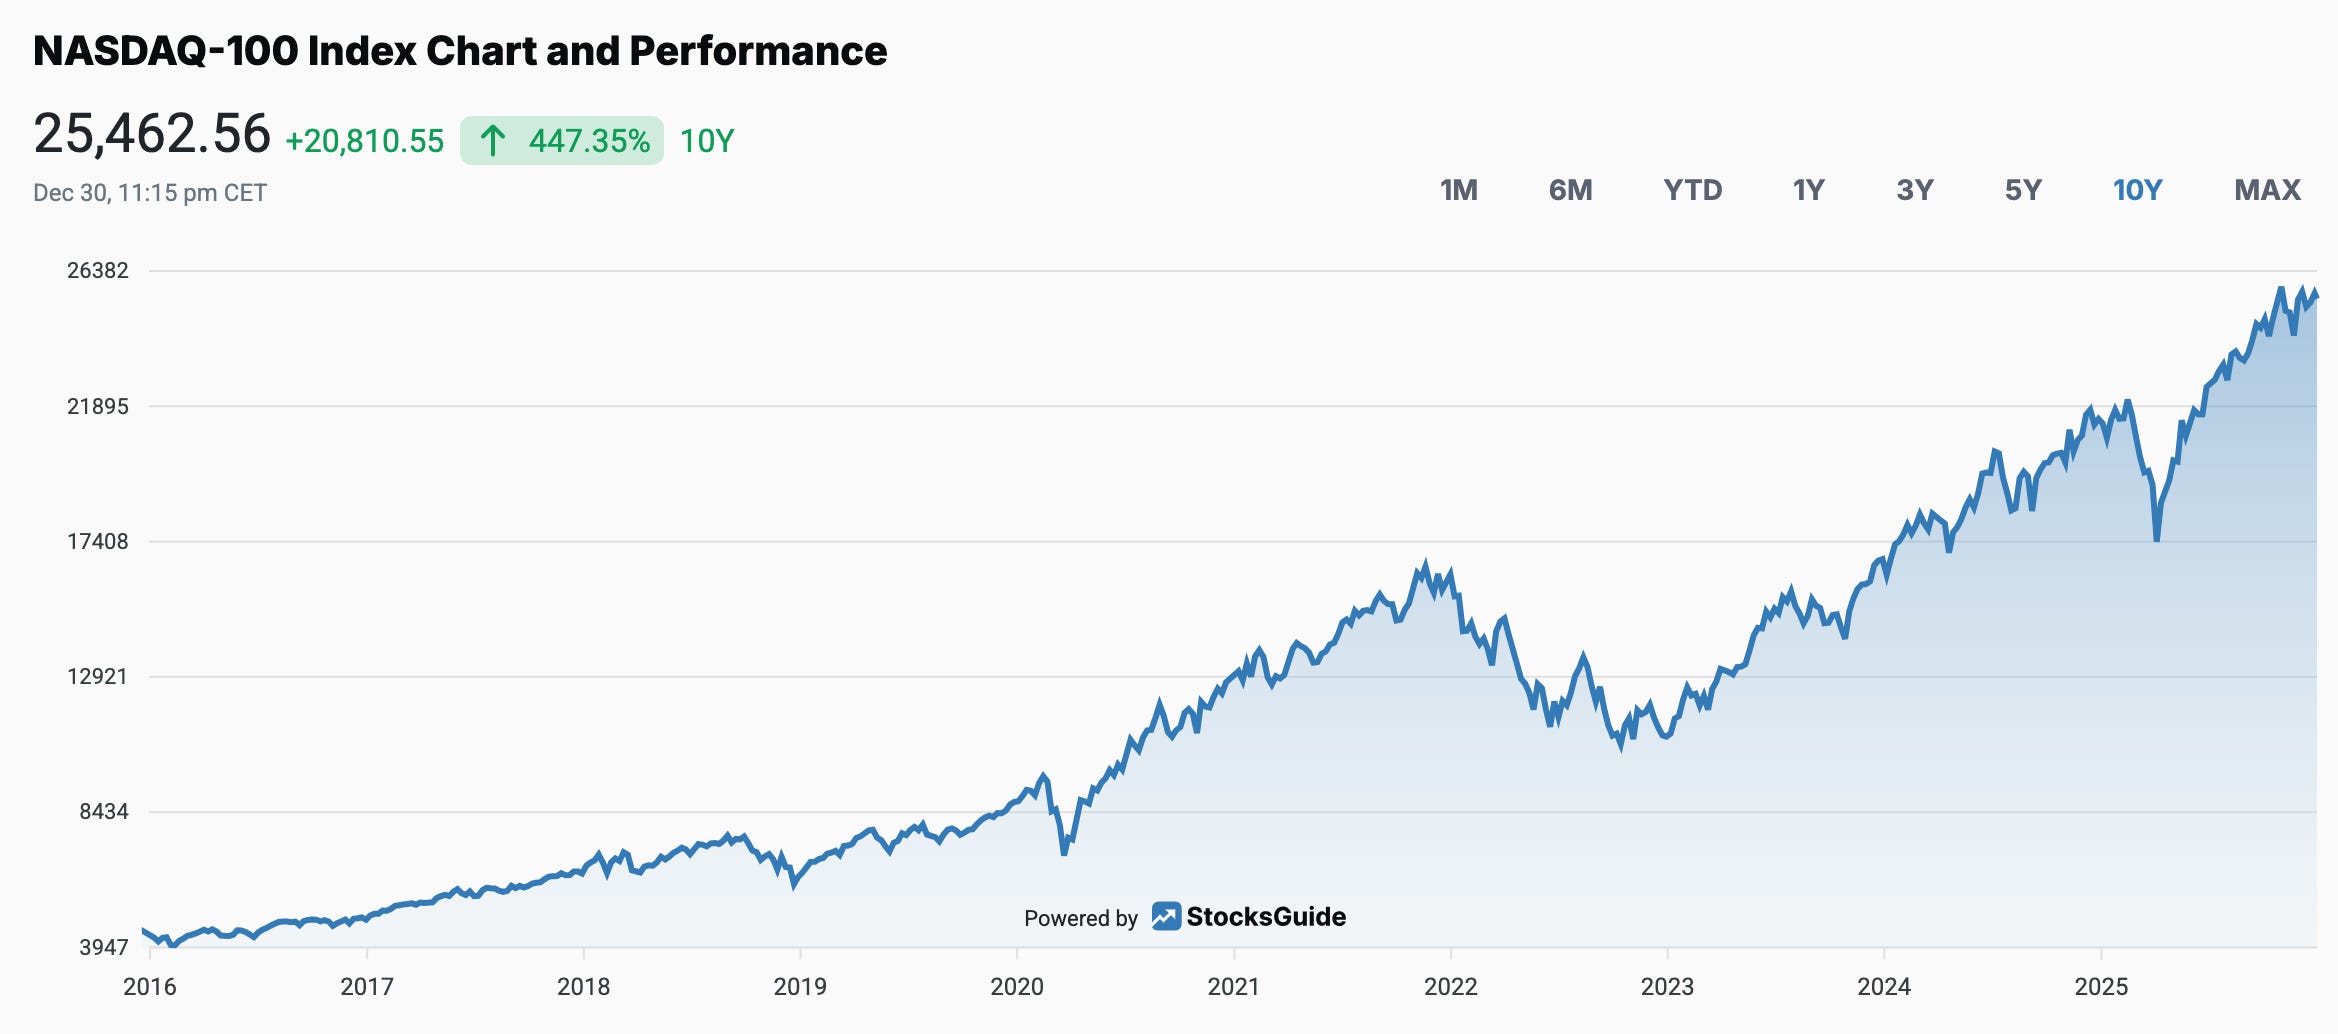
Analyzing Trends and Market Sentiment
Trend analysis is the cornerstone of understanding the Nasdaq chart. A market is considered to be in an uptrend when it consistently records "higher highs" and "higher lows." Conversely, a downtrend is characterized by "lower highs" and "lower lows."
Support and Resistance
Support and resistance are psychological price levels where the market’s direction has historically changed.
- Support: A price level where a stock or index has historically had difficulty falling below, often because buyers view the price as a bargain.
- Resistance: A price level where selling pressure has historically increased, preventing the price from climbing higher.
When you look at a Nasdaq chart, these levels often align with round numbers or previous historical peaks. If the Nasdaq Composite breaks through a major resistance level with high volume, it is often viewed as a "breakout," signaling a potential continuation of an upward trend.
Technical Indicators: Adding Depth to Data
While price action provides the foundation, technical indicators offer secondary confirmation. These mathematical calculations, applied to the historical price data of the Nasdaq, help strip away subjectivity.
Moving Averages (MA)
Moving averages smooth out price volatility to reveal the underlying trend. The 50-day and 200-day Simple Moving Averages (SMA) are widely monitored by institutional investors. When a short-term moving average crosses above a long-term moving average (a "Golden Cross"), it is often interpreted as a bullish signal. Conversely, a "Death Cross"—where the short-term average falls below the long-term—can signal an impending bear market.
Relative Strength Index (RSI)
The RSI measures the speed and change of price movements. It oscillates between 0 and 100. Traditionally, an RSI above 70 suggests the Nasdaq may be "overbought" and due for a pullback, while an RSI below 30 suggests it may be "oversold," potentially creating a buying opportunity for contrarian investors.
| Indicator | Primary Purpose | Best Used For |
|---|---|---|
| Moving Averages | Identify trend direction | Filtering noise over weeks/months |
| RSI | Measure momentum | Spotting overextended price moves |
| Volume | Confirm conviction | Validating breakouts and breakdowns |
| MACD | Detect trend reversals | Timing entry/exit points |
The Critical Role of Trading Volume
Volume is perhaps the most overlooked aspect of reading the Nasdaq chart. Volume represents the number of shares traded during a given period. It acts as the "fuel" for price movement.
If the Nasdaq index climbs to a new high on low volume, technical analysts often view this with skepticism, suggesting that the rally lacks conviction. If the price climbs on massive, surging volume, it indicates strong institutional support for the upward move. Always look for volume "spikes" when a price level is broken; these represent the "market's vote" on whether the new price level is legitimate.
Common Mistakes for Beginners
Understanding charts is a skill that requires discipline to avoid common pitfalls. One major error is "over-analysis." Beginners often clutter their charts with too many indicators, leading to conflicting signals that cause paralysis. It is more effective to master two or three indicators—such as the 50-day moving average and volume—than to use a dozen simultaneously.
Another mistake is ignoring macro-context. The Nasdaq chart is not an isolated vacuum; it reacts to federal interest rate decisions, inflation reports, and earnings announcements from major tech companies. A chart might look technically bullish, but if a major geopolitical event occurs or a key index component misses revenue expectations, the chart’s technical patterns can be invalidated instantly. Technical analysis should serve as a complement to, not a replacement for, fundamental awareness.
Practical Steps to Start Monitoring the Nasdaq
To begin effectively monitoring the Nasdaq chart, you need reliable access to real-time or near-real-time data. Many brokerage platforms provide professional-grade charting tools at no extra cost.
- Select a Platform: Ensure your brokerage or financial news service offers interactive charts.
- Define Your Horizon: If you are a long-term investor, focus on the daily and weekly charts to understand the macro trend. Do not let hourly fluctuations influence your long-term strategy.
- Identify Key Levels: Mark previous peaks and troughs on the chart. These are your current support and resistance levels.
- Observe Volume: Keep a volume bar chart below your price chart. Always verify if a price break coincides with a spike in trading activity.
- Practice Patience: Do not feel the need to "trade" the chart every day. Often, the best decision is to observe how the market interacts with a major resistance or support level over several days before taking action.
Frequently Asked Questions
Why does the Nasdaq chart move differently than the S&P 500? The Nasdaq Composite index is heavily concentrated in technology and growth stocks, whereas the S&P 500 includes companies from diverse sectors like energy, finance, and consumer staples. Consequently, the Nasdaq is generally more volatile and sensitive to changes in interest rates and tech-sector growth cycles compared to the more diversified S&P 500.
Are technical chart patterns guaranteed to predict future prices? No. Technical analysis is based on historical patterns and probabilities, not certainties. Charts help identify potential trends and risk levels, but they cannot predict market shocks, sudden news, or shifts in investor sentiment. Use charts to define risk, not to forecast guaranteed profits.
How do earnings reports affect the Nasdaq chart? Earnings season often causes "gaps" on a chart. If a major company like Apple or Microsoft reports results that are significantly better than expected, the stock may "gap up," meaning it opens at a price higher than it closed the previous day, creating a visible break in the price continuity.
What is the best way to avoid "fakeouts"? A "fakeout" occurs when a price breaks a support or resistance level but immediately reverses. To reduce the risk of falling for a fakeout, wait for the price to close beyond the level on higher-than-average volume. A break that occurs during the middle of the day is less reliable than one that holds through the market close.
Next Actions for Investors
To gain proficiency, open your preferred financial portal and select the Nasdaq Composite index (IXIC). Spend one week observing it daily: identify the current trend, note the support and resistance levels, and compare the day's volume to the preceding week's average. By observing how these data points correlate with actual market news, you will begin to develop an intuitive understanding of the market's internal rhythm. Financial markets involve significant risk; ensure your investment strategy aligns with your personal risk tolerance and financial goals.
Image Gallery
Select an image to open it in a new tab.



Ingrid Bjornson
Global Cyber Policy and Regulation Analyst
