
Market capitalization, or "market cap," represents the total dollar market value of a company’s outstanding shares of stock. It is calculated by multiplying the current market price of one share by the total number of outstanding shares. For investors, market cap is a primary metric used to determine a company's size, risk profile, and growth potential relative to its peers.
The Mechanics of Market Capitalization
To understand what market capitalization means for investors, one must first grasp the simplicity of its calculation and the complexity of its implications. The formula is straightforward: Market Capitalization = Current Share Price × Total Outstanding Shares.
However, "outstanding shares" is a specific term. It refers to all shares currently held by all shareholders, including share blocks held by institutional investors and restricted shares owned by the company’s officers and insiders. It does not include "treasury shares," which are shares the company has bought back and holds in its own treasury.
For example, as of 2026, if a technology firm has 500 million shares outstanding and the current market price is $200 per share, its market capitalization is $100 billion. This figure tells an investor more about the company’s "cost" to the public market than the share price alone ever could. A company with a $1,000 share price and only 1 million shares outstanding is significantly smaller ($1 billion market cap) than a company with a $10 share price and 1 billion shares outstanding ($10 billion market cap).
Market Cap vs. Float
Investors must also distinguish between total market cap and "free float" market cap. The free float represents the portion of shares that are actually available for trading by the public. Companies with a low float relative to their total market cap can experience higher volatility because fewer shares are available to absorb buying or selling pressure. Most major indices, such as the S&P 500, use a float-adjusted market capitalization to ensure the index reflects the actual liquidity available to investors.
Categorizing Companies by Market Cap Tiers
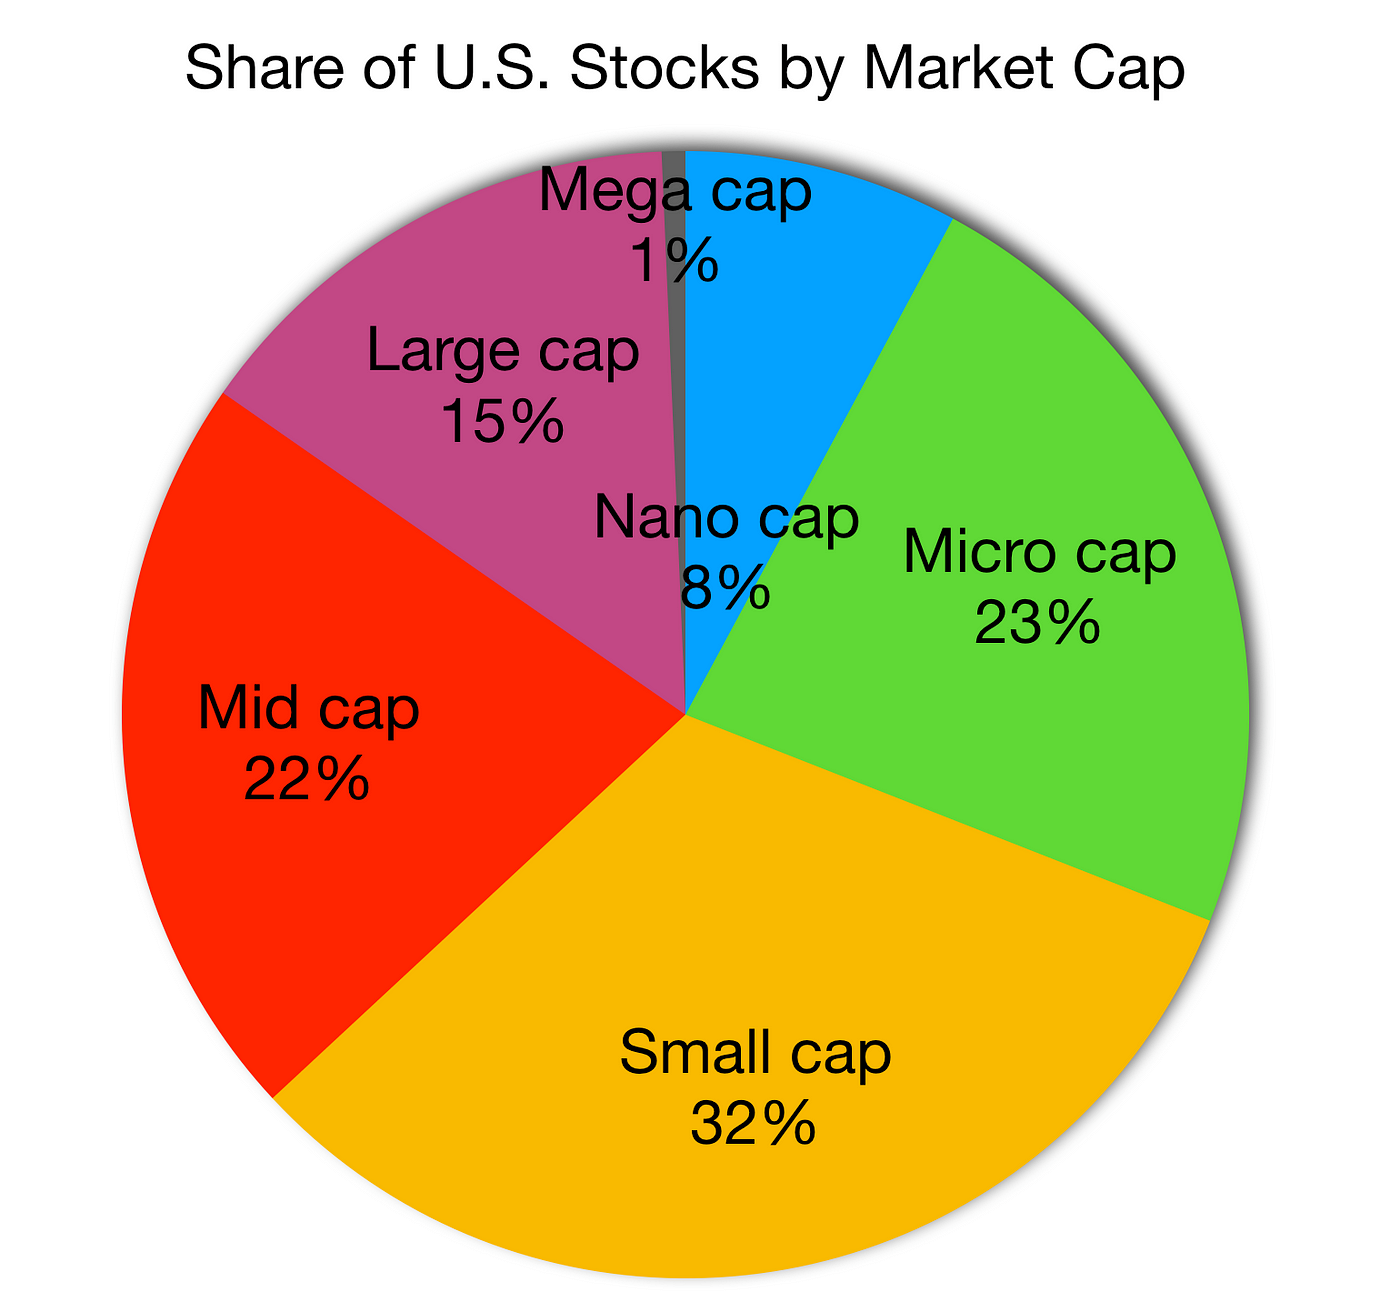
In the financial world of 2026, market capitalization is the standard by which companies are grouped into tiers. These tiers help investors set expectations for volatility, dividend potential, and capital appreciation.
| Category | Market Cap Range (Approximate) | Typical Characteristics |
|---|---|---|
| Mega-Cap | $200 Billion and Above | Global leaders, highly liquid, often pay dividends. |
| Large-Cap | $10 Billion – $200 Billion | Stable, established, cornerstone of most portfolios. |
| Mid-Cap | $2 Billion – $10 Billion | Growth-oriented but established; the "sweet spot" for many. |
| Small-Cap | $250 Million – $2 Billion | High growth potential, higher volatility, sensitive to economy. |
| Micro-Cap | Below $250 Million | High risk, low liquidity, speculative. |
Mega-Cap and Large-Cap: The Pillars of Stability
Large-cap and mega-cap companies are often household names. These companies typically have mature business models, diversified revenue streams, and a history of weathering economic downturns. For investors, these stocks represent lower risk but also lower relative growth compared to smaller firms. In 2026, many investors utilize mega-caps for "capital preservation" and consistent dividend income. Because these companies are so large, doubling their market value requires massive shifts in the global economy, making 100% gains in a single year rare.
Mid-Cap: The Growth "Sweet Spot"
Mid-cap stocks represent a middle ground. These companies are often in the process of expanding their market share or increasing their operational efficiency. They are typically more established than small-caps—and thus less likely to go bankrupt—but they still have significantly more "room to run" than mega-caps. Investors often look to mid-caps for a balance of growth and stability.
Small-Cap and Micro-Cap: High Octane, High Risk
Small-cap companies often serve niche markets or are in the early stages of a new industry. While they offer the potential for explosive growth, they are also highly sensitive to interest rate changes and economic cycles. In 2026, small-caps remain a favorite for aggressive investors, though they require a higher tolerance for price swings. Micro-cap stocks are even more speculative and are often traded on "over-the-counter" (OTC) markets rather than major exchanges like the NYSE or Nasdaq.
Why Market Cap Matters for Portfolio Diversification
For an investor, market capitalization is a vital tool for asset allocation. A well-diversified portfolio usually contains a mix of market caps to balance risk and return.
- Risk Mitigation: During periods of economic uncertainty or high interest rates, large-cap stocks often outperform small-caps because they have better access to credit and more cash on hand. Conversely, in a burgeoning bull market, small-caps often lead the charge as investors seek higher returns.
- Investment Horizon: An investor with a 30-year horizon might tilt their portfolio toward small- and mid-cap stocks to capture long-term growth. An investor nearing retirement in 2026 might favor large-cap and mega-cap stocks for their stability and dividends.
- Sector Correlation: Market cap can also correlate with sectors. For instance, the utility sector is dominated by large-caps, while the biotechnology sector is heavily populated by small- and mid-cap companies. Understanding market cap helps ensure you aren't accidentally over-exposed to a single risk factor.
Market Cap vs. Stock Price: The Common Misconception
One of the most frequent mistakes novice investors make is equating a high stock price with a "big" company or a "dear" valuation. This is a fundamental misunderstanding of what market capitalization means.
A stock's price is merely a numerator. Without knowing the denominator (the number of shares), the price is meaningless for valuation. For example, a company might perform a "stock split," which doubles the number of shares and halves the price. The market capitalization remains the same, and the investor’s total value in the company remains unchanged.
Investors should focus on market cap because it represents the takeover value or the enterprise value (when adjusted for debt). If you were to buy the entire company, you would have to pay at least the market capitalization. Thinking in terms of market cap prevents the psychological trap of buying "cheap" stocks (penny stocks) simply because the share price is low, ignoring the fact that those companies may have billions of shares outstanding and very poor fundamentals.
Comparing Market Cap to Other Valuation Metrics
While market cap is a critical starting point, it does not tell the whole story of a company’s value. To gain a deeper understanding, investors must compare market cap to other financial metrics.
Enterprise Value (EV)
Enterprise Value is often considered a more accurate reflection of a company's total value than market cap alone. EV is calculated as: Market Cap + Total Debt - Cash and Cash Equivalents. For investors, this is crucial. Two companies might both have a $10 billion market cap, but if one has $5 billion in debt and the other has $5 billion in cash, the second company is in a much stronger financial position. The Financial Industry Regulatory Authority (FINRA) provides resources on how these different valuation methods impact investor risk.
Price-to-Earnings (P/E) Ratio
The P/E ratio relates the market cap to the company’s actual profits. A company could have a massive market cap, but if it has no earnings, that market cap is based entirely on future expectations rather than current performance. In 2026, comparing the P/E ratios of companies within the same market-cap tier remains a standard practice for identifying undervalued stocks.
Market Cap-to-GDP
On a macro level, the "Buffett Indicator" or the Market Cap-to-GDP ratio is used to determine if the overall stock market is overvalued or undervalued relative to the size of the economy. This perspective helps investors decide whether to increase their cash holdings or stay fully invested.
How Market Cap Shapes Index Investing and ETFs
The rise of passive investing has made market capitalization more important than ever. Most major exchange-traded funds (ETFs) and mutual funds are "market-cap weighted." This means the fund invests more money in companies with larger market caps.
In a market-cap-weighted index like the S&P 500, a 1% move in a mega-cap company has a significantly larger impact on the index's value than a 1% move in a smaller constituent. For investors, this creates a "momentum" effect: as a company’s market cap grows, index funds are forced to buy more of its shares, which can further drive up the price.
However, this also introduces concentration risk. If a few mega-cap stocks dominate an index, the "diversified" fund may actually be highly dependent on the performance of just five or ten companies. Investors in 2026 are increasingly looking at "equal-weighted" indices as an alternative to mitigate this specific risk. More information on index construction can be found via the U.S. Securities and Exchange Commission (SEC).
Strategic Considerations for 2026
As we navigate 2026, several factors are shifting how investors interpret market capitalization:
- The Influence of Private Markets: Many companies are staying private longer, meaning that when they finally hit the public markets via an IPO, they arrive as large-caps or even mega-caps. The traditional "path" from micro-cap to large-cap is becoming rarer.
- Technological Scaling: Digital-first companies can reach mega-cap status faster than industrial companies of the past. This rapid scaling can sometimes lead to "inflated" market caps that are not yet supported by historical earnings, necessitating a focus on "Price-to-Sales" ratios alongside market cap.
- Inflation Adjustments: It is important to note that the definitions of "small" or "large" cap are not static. Due to inflation and overall market growth, a "mid-cap" company in 2026 is significantly larger in dollar terms than a mid-cap company was in 1996.
Frequently Asked Questions
Does a larger market cap mean a stock is a better investment?
Not necessarily. A larger market cap generally indicates more stability and lower volatility, but it also usually means lower growth potential. A "better" investment depends entirely on your individual financial goals, risk tolerance, and investment timeline. For income-seeking investors, a large-cap might be better; for those seeking aggressive growth, a small-cap might be preferable.
Why do some small-cap stocks have such high share prices?
Share price is a function of market cap divided by the number of shares outstanding. If a small-cap company has a very low number of shares (low float), the price per share can be very high even if the total value of the company is small. This is why you should always look at the market cap rather than the share price to determine a company's size.
How often does a company’s market cap change?
Market capitalization changes every second the stock market is open. Because it is tied to the current share price, any fluctuation in the stock's price results in a corresponding change in market cap. Additionally, if a company issues new shares or conducts a share buyback, the market cap will change even if the share price stays the same.
Can a company move between market cap tiers?
Yes, this is common. A "mid-cap" company that experiences rapid growth can eventually become a "large-cap." Conversely, a large-cap company that faces declining revenues and a falling stock price can be downgraded to mid-cap or small-cap status. Major indices typically rebalance quarterly or semi-annually to account for these shifts.
Is market cap the same as a company's "equity value"?
In the context of public markets, market capitalization is the equity value. It represents what the public market believes the equity of the business is worth. However, "book value" (the value of assets minus liabilities on the balance sheet) is a different measure of equity. Market cap is usually higher than book value because it includes the value of future growth and intangible assets like brand name and intellectual property.
Final Recommendations for Investors
When evaluating investments in 2026, use market capitalization as your primary filter for risk and portfolio fit. Avoid the trap of looking at share price in isolation; it is a cosmetic number that does not reflect the actual scale of a business.
Instead, start by identifying which market-cap tier aligns with your current goals. If you need stability, look toward the large-cap and mega-cap sectors. If you are looking to outperform the broader market and can handle significant price swings, allocate a portion of your capital to small- and mid-cap stocks. Finally, always cross-reference market cap with debt levels (Enterprise Value) and earnings to ensure you are paying a fair price for the company’s size.
Image Gallery
Select an image to open it in a new tab.


Akira Tanaka
International Academic Trends Correspondent
