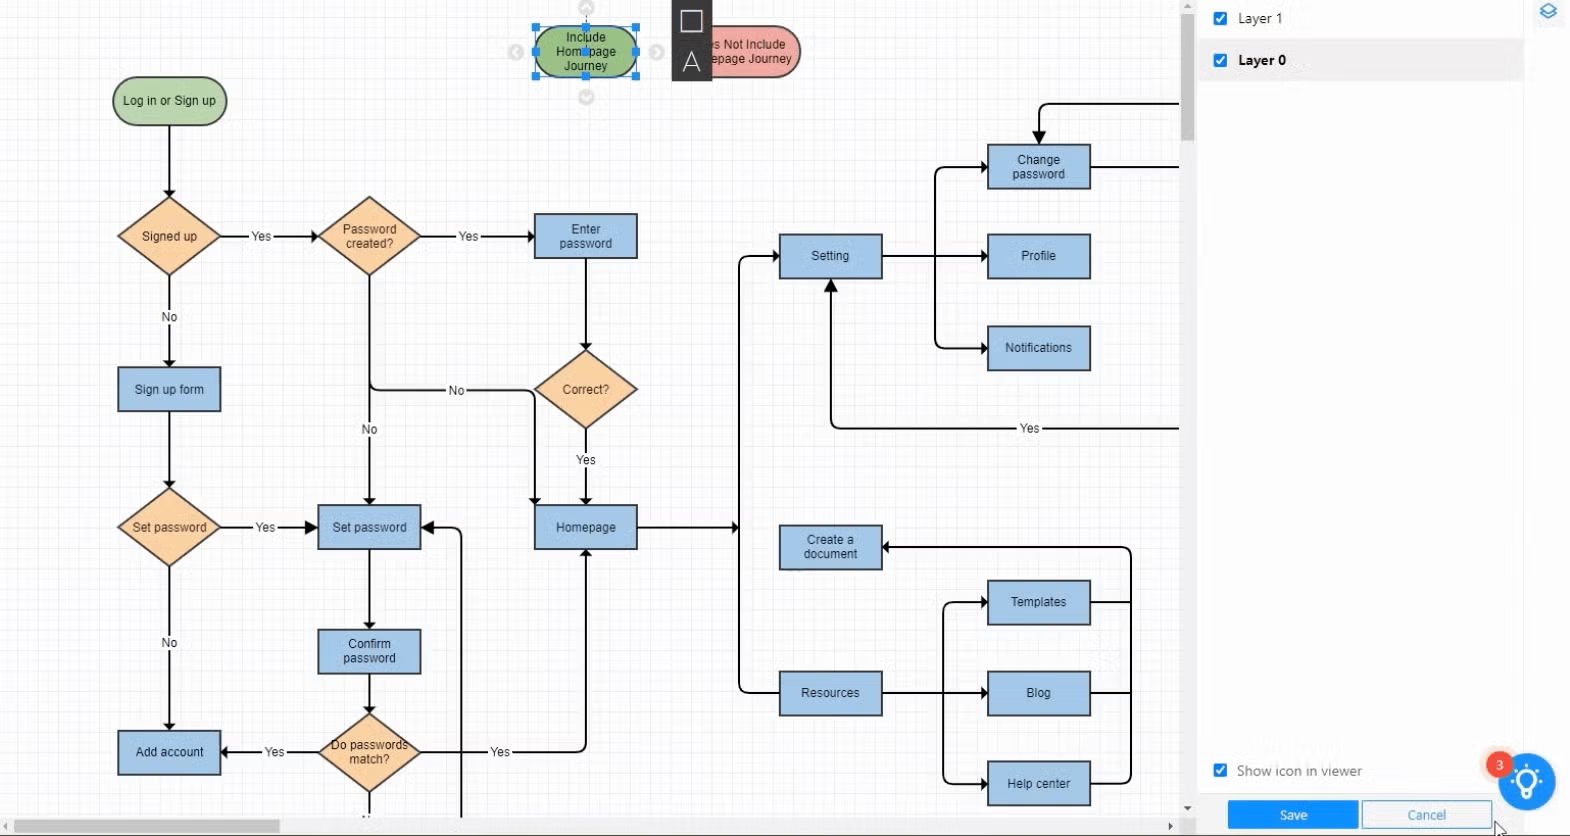
To build a network diagram in Gliffy, start by opening a new document and selecting the "Network" shape library from the "More Shapes" menu. Drag and drop industry-standard icons—such as routers, switches, and servers—onto the canvas, then use the connector tool to map the relationships and data flow between these devices.
Effective network documentation is the backbone of any resilient IT infrastructure. As we move through 2026, the complexity of hybrid cloud environments and decentralized office networks has only increased the demand for clear, accurate visual maps. Gliffy remains a primary choice for engineers and system administrators due to its seamless integration with the Atlassian ecosystem and its intuitive drag-and-drop interface. Whether you are mapping a simple home office or a multi-region enterprise cloud architecture, mastering the specific nuances of Gliffy can significantly reduce the time spent on documentation and troubleshooting.
Understanding the Role of Gliffy in Modern Network Mapping
Gliffy serves as a lightweight yet powerful alternative to heavy-duty CAD software or overly complex diagramming tools like Microsoft Visio. In the context of 2026, where speed and collaboration are paramount, Gliffy’s primary strength lies in its "what you see is what you get" (WYSIWYG) approach. It allows technical and non-technical stakeholders to view and edit diagrams without requiring specialized local software installations.
Building a network diagram is not just about placing icons on a page; it is about creating a functional blueprint that can be used for security audits, capacity planning, and incident response. Gliffy provides standardized shape libraries that adhere to industry norms, including Cisco-specific icons, AWS (Amazon Web Services), and Azure components. This ensures that your diagrams are universally understood by other professionals in the field.
Prerequisites and Environment Setup
Before you begin dragging shapes onto the canvas, you must ensure your environment is configured to support network diagramming. Gliffy operates as both a standalone web application (Gliffy Online) and an integrated plugin for Jira and Confluence.
1. Account Access and Platform Selection
Decide whether you will be working within Confluence or via the standalone web browser. If you are documenting for an internal team, building directly within a Confluence page is recommended because it allows for automatic versioning and easy discovery by teammates.
2. Activating the Network Shape Libraries
By default, Gliffy may only show basic shapes (circles, squares, arrows). To build a network diagram, you must manually enable the specialized libraries:
- Click the "More Shapes" button at the bottom of the left-hand sidebar.
- Locate the "Network" category.
- Check the boxes for "Network," "Cisco," and cloud-specific libraries like "AWS," "Azure," or "Google Cloud Platform" if you are working in a cloud-native environment.
- Click "OK" to add these to your sidebar.
3. Setting the Grid and Workspace
For technical diagrams, precision is vital. Go to the "View" menu and ensure "Snap to Grid" is turned on. This prevents "messy" diagrams where lines are slightly off-center, which can lead to confusion when interpreting complex connection paths.
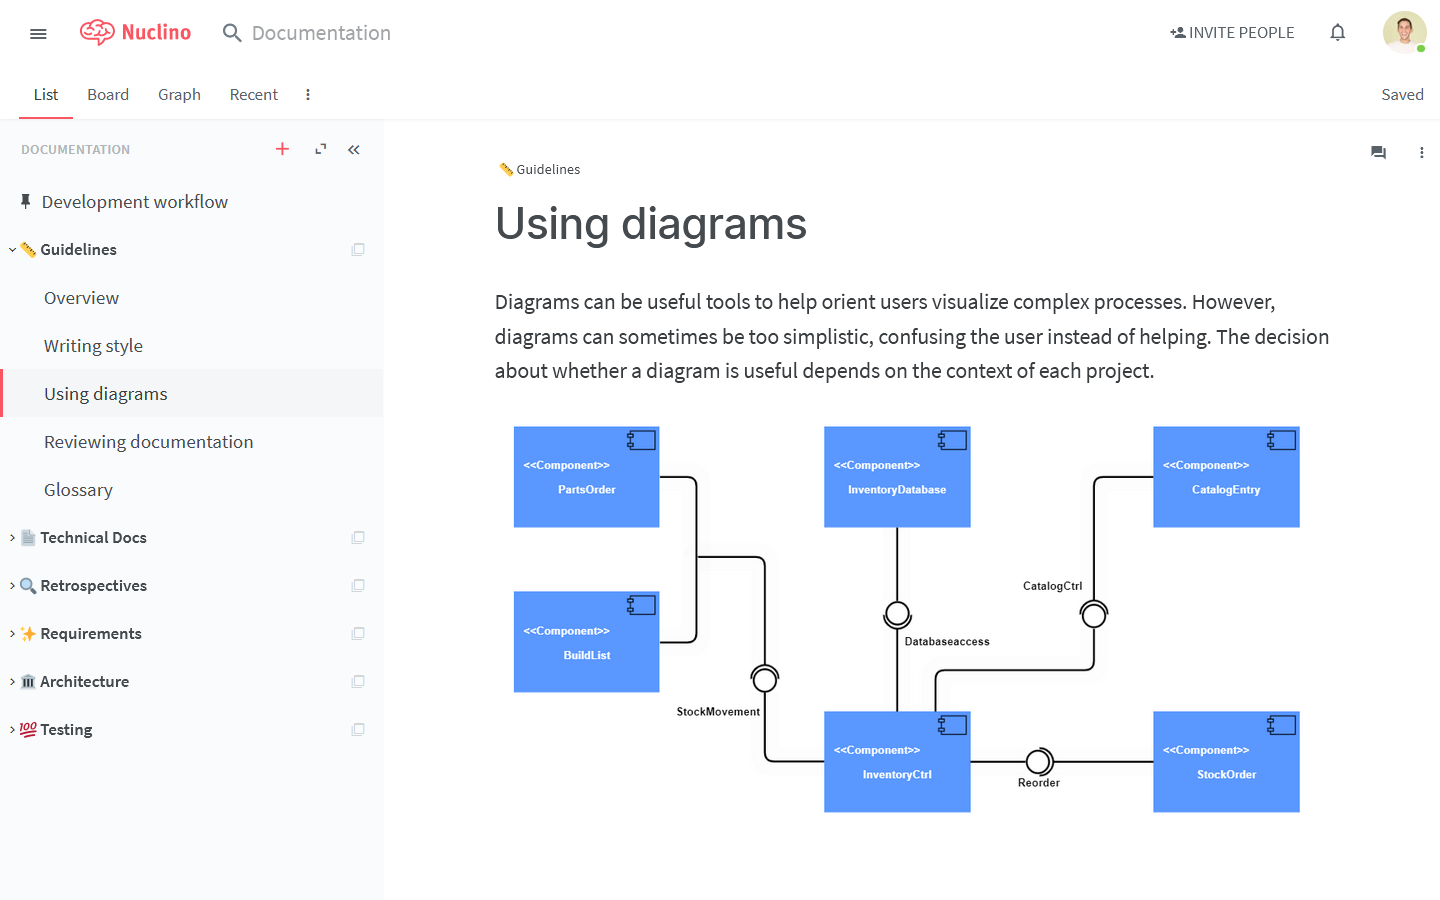
Step-by-Step Guide to Creating Your First Network Diagram
Once your libraries are active, follow this logical progression to build a structured and professional diagram.
Phase 1: Defining the Perimeter and Core
Start with the "Outside World" or your ISP (Internet Service Provider) connection. Usually, this is represented by a "Cloud" shape. From there, place your primary security and routing devices.
- Edge Devices: Drag a Firewall and a Router onto the top of the canvas.
- The Core Switch: Below the router, place your core switch. In a hierarchical network design, this acts as the central hub for all other segments.
Phase 2: Building the Logical Segments
Modern networks are rarely flat. Use Gliffy’s "Group" or "Section" tools to define different VLANs (Virtual Local Area Networks) or physical locations.
- Servers and Storage: Place your servers, databases, and NAS (Network Attached Storage) devices in one cluster.
- Workstations: Use generic laptop or desktop icons to represent user groups.
- Wireless Access Points: Distribute these icons to show how mobile devices connect to the internal infrastructure.
Phase 3: Establishing Connections
This is the most critical step. In Gliffy, you use the Connector Tool (often represented by a line icon in the top toolbar).
- Dynamic Connectors: Click on a connection point (a small circle that appears when you hover over a shape) and drag the line to a connection point on another shape.
- Orthogonal vs. Straight Lines: For network diagrams, orthogonal lines (lines that only move in 90-degree angles) are preferred. They keep the diagram clean and organized, especially when many lines cross each other.
- Labeling Connections: Double-click on any connector line to add text. This is where you should specify port numbers (e.g., Eth0/1), IP addresses, or connection speeds (e.g., 10Gbps).
Phase 4: Styling and Visual Hierarchy
A diagram where every icon is the same color and size is difficult to read.
- Color Coding: Use specific colors for different types of traffic. For example, use red for the management network, blue for the data network, and green for the guest network.
- Icon Scaling: Ensure that your core switches are physically larger on the canvas than individual end-user laptops to signify their importance in the hierarchy.
Organizing Complex Architectures with Layers and Groups
As a network grows, a single-layer diagram can become cluttered and unreadable. Gliffy offers a "Layers" feature that is essential for enterprise-level mapping.
Using Layers for Detail
You can create a "Physical" layer and a "Logical" layer. The physical layer shows the actual hardware and cables, while the logical layer shows IP addresses, subnets, and software-defined boundaries. By toggling these layers on and off, you can present the same diagram to different audiences—one for a technician who needs to know which cable to pull, and another for a manager who needs to see the subnet structure.
Grouping Objects
When you have finished a specific segment (like a server rack), select all the components and right-click to select "Group." This allows you to move the entire rack as one unit without breaking the individual connector lines within that group.
Industry-Standard Shape Libraries in Gliffy
Using the correct iconography is not just about aesthetics; it is about compliance and professional communication. Gliffy provides several sets that are standard as of 2026.
| Library Name | Best Used For | Key Components |
|---|---|---|
| Basic Network | General diagrams, home offices | Clouds, Hubs, generic PCs, generic Routers |
| Cisco | Enterprise on-premise hardware | Layer 3 Switches, ASA Firewalls, VPN Concentrators |
| AWS (v2026) | Public cloud infrastructure | EC2 Instances, S3 Buckets, VPC Peering, Lambda |
| Azure | Enterprise cloud environments | Virtual Machines, Resource Groups, Azure SQL |
| Home Networking | Residential or small retail | Modems, Wi-Fi Routers, Smart Home IoT devices |
Advanced Features for 2026 Workflows
In 2026, diagrams are rarely static images. Gliffy has evolved to support more dynamic documentation needs.
1. Linking to External Documentation
One of the most powerful features of Gliffy within Confluence is the ability to turn shapes into links. You can right-click a server icon and add a link to that server's specific documentation page or its real-time monitoring dashboard in a tool like Splunk or Datadog. This transforms the network diagram into a functional portal for the IT team.
2. Real-Time Collaboration
If you are working during a network outage or a major migration, you can share the Gliffy document with colleagues. Multiple users can view the changes in real-time, which is vital for "War Room" scenarios where everyone needs to be on the same page regarding current topology changes.
3. Embedding and Version Control
When you save a Gliffy diagram in a wiki environment like Confluence, it automatically tracks versions. If a network change is reverted, you can go back into the version history and restore the previous diagram, ensuring your documentation always matches the physical reality of the rack.
Troubleshooting and Common Pitfalls
Even with an intuitive tool, certain mistakes can render a network diagram useless.
- Crossing Lines without Clarification: When lines must cross, it can look like they are connected. Use the "bridge" or "jump" styling if available, or simply rearrange the icons to minimize crossings.
- Over-Labeling: Avoid putting every single detail (MAC addresses, serial numbers) directly on the diagram. It becomes "visual noise." Instead, put the most important info (Hostname and IP) on the diagram and link the icon to a detailed spreadsheet or wiki page for the rest.
- Scale Inconsistency: Ensure that if you are using Cisco icons, you don't mix them with Azure icons in a way that implies they are the same type of object, unless you are specifically documenting a hybrid cloud connection.
- Broken Connectors: Occasionally, if you move a shape too quickly, the connector line may detach. Always "wiggle" a shape after placing it to ensure all attached lines move with it. If they don't, the connection isn't locked.
Comparing Gliffy with Industry Alternatives
While Gliffy is excellent for integration, it is important to know where it stands against other tools in the market.
| Feature | Gliffy | Lucidchart | Microsoft Visio |
|---|---|---|---|
| Primary Platform | Browser / Atlassian | Browser / Standalone | Windows Desktop / O365 |
| Ease of Use | High (Drag & Drop) | High | Medium (Professional) |
| Atlassian Integration | Native / Best-in-class | Via Plugin | Limited |
| Offline Mode | Limited | Yes | Full Desktop Support |
| Pricing Model | Subscription (Per User) | Subscription (Per User) | One-time or O365 Sub |
Summary and Next Actions
Building a network diagram in Gliffy is a process of translating physical or logical infrastructure into a standardized visual language. By activating the correct libraries, utilizing orthogonal connectors, and leveraging the power of layers, you create more than just a picture; you create a vital technical asset.
Your next steps should include:
- Auditing your current hardware: Make a list of all critical nodes (Routers, Switches, Servers).
- Defining your scope: Decide if you are building a high-level "Bird's Eye" view or a detailed port-by-port map.
- Setting up your Gliffy template: Enable the Cisco and Cloud libraries so they are ready for use.
- Implementing a maintenance schedule: A network diagram is only useful if it is accurate. Set a quarterly reminder to update the diagram as hardware is decommissioned or added.
For official documentation and deeper technical support, visit the Gliffy Help Center or the Atlassian Marketplace for plugin-specific instructions.
FAQ
How do I import existing Visio files into Gliffy?
To import a Visio file, go to the Gliffy "File" menu and select "Import." Gliffy supports .vsdx and .vdx formats. Once imported, the shapes will be converted into Gliffy-compatible objects, though you may need to adjust some connector lines that didn't transition perfectly during the conversion process.
Can I create custom network icons in Gliffy?
Yes. If the standard libraries are missing a specific piece of proprietary hardware, you can upload your own images (PNG, JPG, or SVG) by dragging them directly onto the canvas. You can then save these to your "Custom" library for future use across different diagrams.
Does Gliffy support automated network discovery?
No, Gliffy is a diagramming tool, not a network monitoring or discovery tool. You cannot currently point Gliffy at an IP range and have it automatically draw the network. You must manually place the icons based on data gathered from other tools like Nmap, SolarWinds, or AWS Config.
Is Gliffy secure enough for sensitive network topologies?
Gliffy uses industry-standard encryption for data at rest and in transit. However, because network diagrams contain sensitive information (like IP schemes and security appliance locations), you should manage access permissions strictly within your Atlassian or Gliffy Online account settings to ensure only authorized personnel can view the maps.
How do I export my network diagram for a presentation?
You can export your diagram by going to File > Export. You have the option to save it as a PNG, JPG, or SVG for high-quality printing, or as a PDF for easy sharing. For the best resolution in technical reports, the SVG format is recommended as it remains crisp at any zoom level.
Image Gallery
Select an image to open it in a new tab.


Omar Farooq
EdTech Innovation and Virtual Pedagogy Journalist
