What is an Infographic? A Comprehensive Guide with Examples and Design Principles
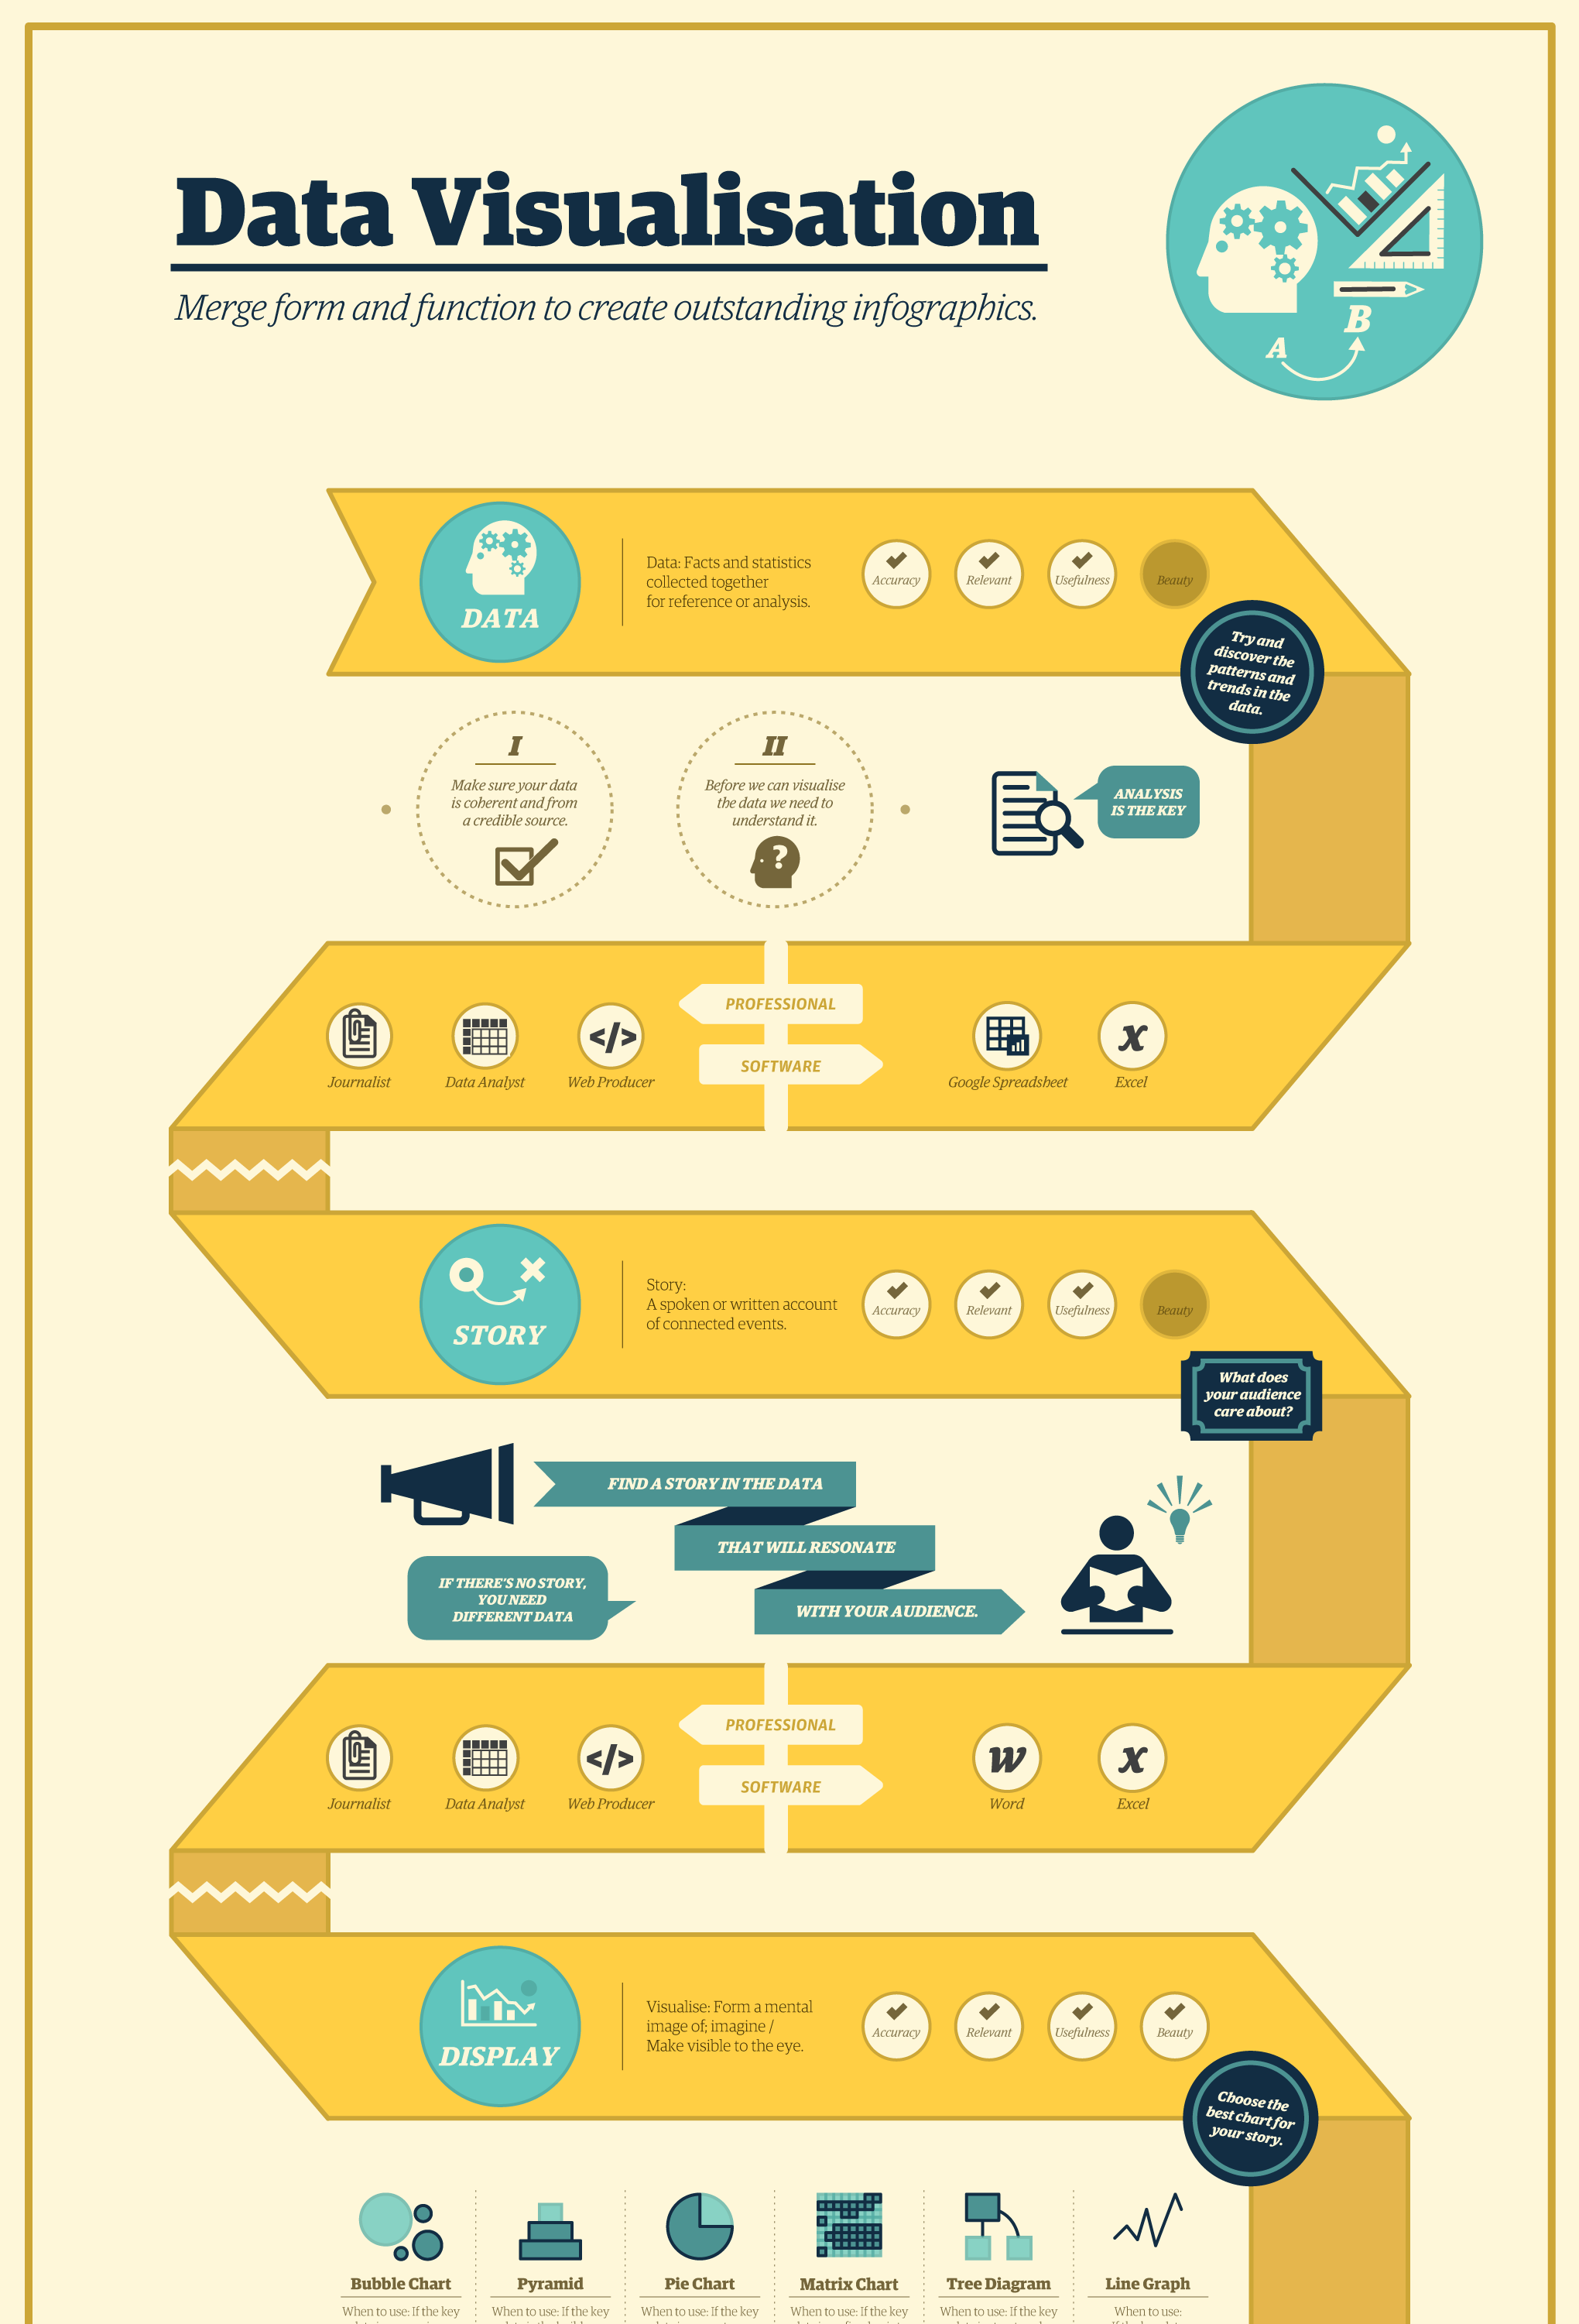
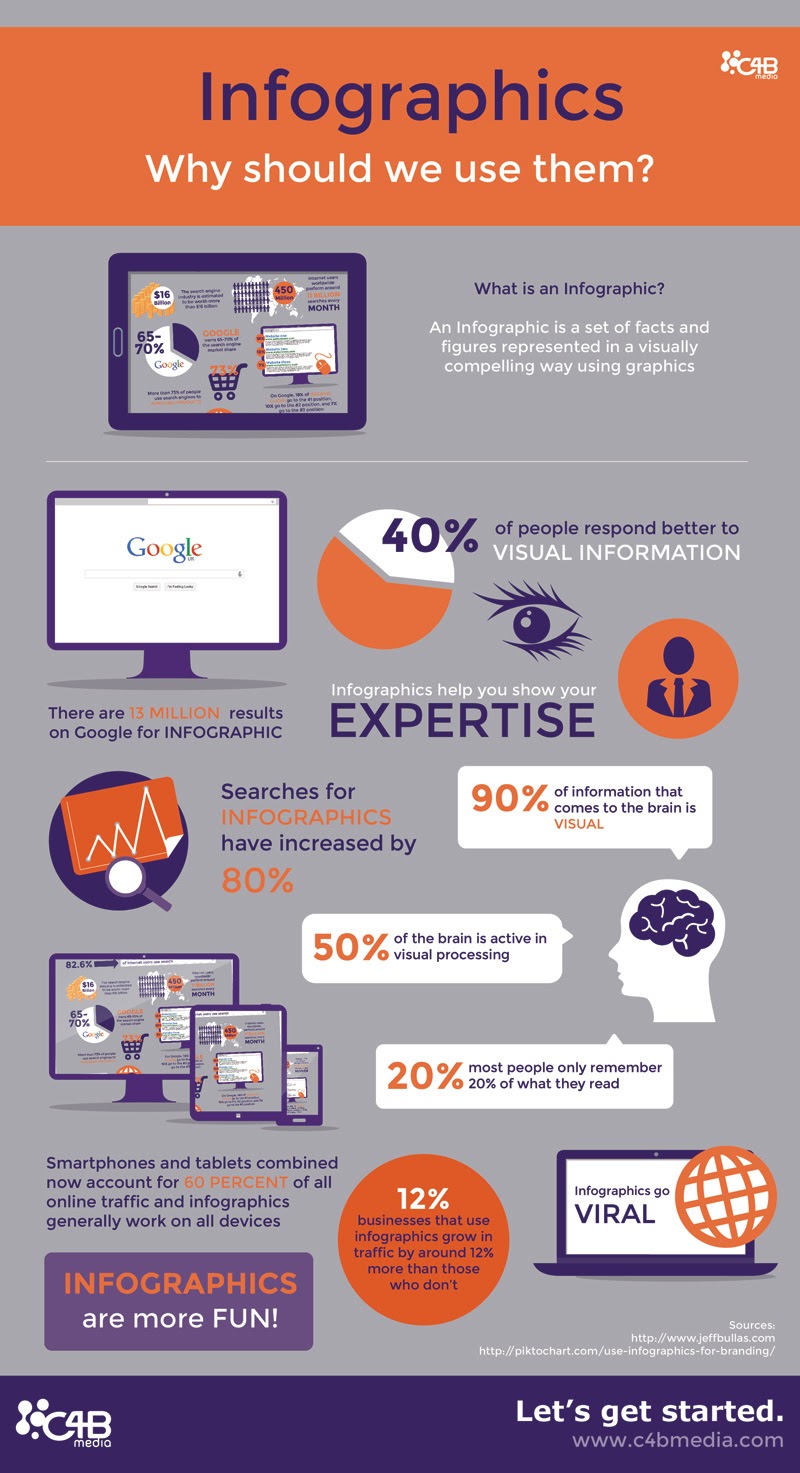
An infographic is a visual communication tool that combines imagery, data visualizations, and minimal text to provide an easy-to-understand overview of a topic. By transforming complex data into digestible graphics, infographics enhance comprehension, improve information retention, and encourage audience engagement across digital and print media platforms.
In 2026, infographics remain one of the most effective ways to cut through the noise of information overload. Whether used in marketing, education, or internal corporate reporting, they bridge the gap between raw data and actionable insight. This guide explores the various types of infographics, provides specific examples, and outlines the technical steps required to create high-impact visual content.
The Fundamentals of Infographic Design
To understand what an infographic is, one must look beyond the aesthetic. At its core, an infographic is a synthesis of three essential parts: the visual, the content, and the knowledge. The visual element consists of the color palettes, typography, and iconography that guide the eye. The content element involves the statistics, facts, and narrative flow. Finally, the knowledge element is the "insight"—the conclusion or takeaway the creator wants the audience to reach.
The human brain processes visual information significantly faster than plain text. According to research on visual perception, the brain can identify images seen for as little as 13 milliseconds. This cognitive efficiency is why infographics are preferred for presenting complex hierarchies, comparative data, or multi-step processes. In a professional context, they serve as a shorthand for decision-makers who need to grasp the "big picture" without wading through lengthy white papers or spreadsheets.
Common Types of Infographics and Examples
Choosing the right format is the most critical decision in the design process. If the format does not align with the data structure, the infographic will likely confuse rather than clarify. Below are the most common types utilized in 2026.
1. Statistical Infographics
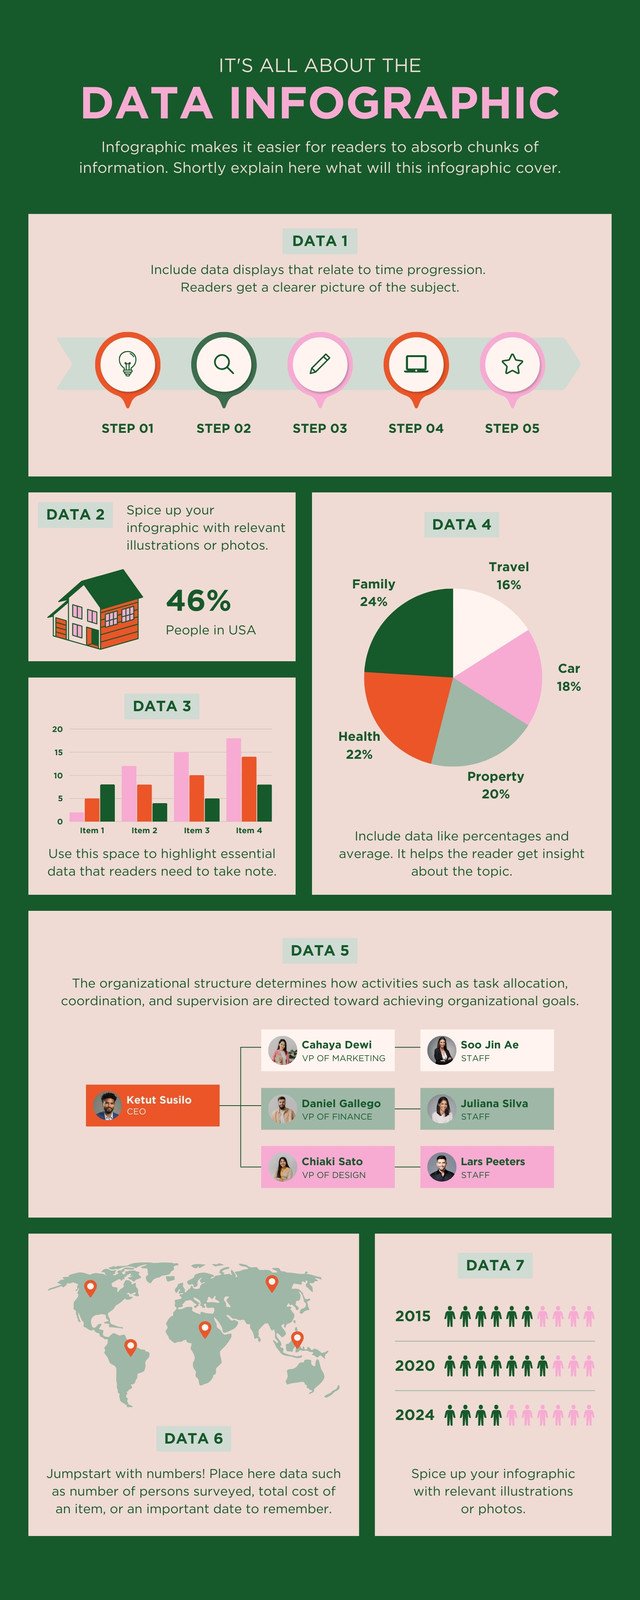
Statistical infographics focus on data visualization. They are used to present survey results, research findings, or financial data. The primary goal is to make the numbers the "hero" of the story.
- Example: A year-end report for a non-profit showing the percentage of donations allocated to various programs. Instead of a table, the infographic uses a large donut chart for the budget split and pictograms (e.g., small house icons) to represent the number of families served.
- Best For: Proving a point with hard evidence or simplifying complex datasets.
2. Informational Infographics
These are used when the goal is to explain a concept or provide an overview of a topic that isn't necessarily data-heavy. They rely on icons and clear headers to guide the reader through different sections.
- Example: A "Guide to Sustainable Living" that breaks down five different areas of the home (kitchen, bathroom, etc.) with tips on how to reduce waste in each.
- Best For: Educational content, "how-to" summaries, and introductory guides.
3. Timeline Infographics
Timeline infographics are essential for showing the history of a brand, the progression of a project, or the evolution of a specific technology. They use a central line (horizontal or vertical) to anchor chronological events.
- Example: A corporate history graphic showing a company’s journey from a 2010 startup to a 2026 global industry leader, highlighting key product launches and acquisitions along the way.
- Best For: Historical context, project roadmaps, and storytelling.
4. Process Infographics
Also known as "how-to" or flowcharts, these infographics break down a complex process into manageable steps. They often use arrows or numbered lists to direct the viewer’s eye.
- Example: A recruitment process infographic for a HR portal, showing the journey from "Application Submitted" to "Onboarding," with icons representing interviews and background checks.
- Best For: Standard Operating Procedures (SOPs), customer journey mapping, and instructional design.
5. Comparison Infographics
When a reader needs to choose between two or more options, a comparison infographic provides a side-by-side analysis. These are typically split down the middle or organized in a grid.
- Example: A "Laptop A vs. Laptop B" comparison for a tech review site, contrasting battery life, processing power, and price using bar charts and bulleted lists.
- Best For: Product reviews, "Pros vs. Cons" lists, and myth-busting.

Technical Specifications and Creation Tools
Creating an infographic in 2026 involves a mix of traditional design principles and modern AI-assisted tools. While professional designers may still prefer the granular control of the Adobe Creative Cloud, many organizations have shifted toward template-based platforms that allow for rapid iteration.
| Tool Name | Primary User Base | Difficulty Level | Key Strength |
|---|---|---|---|
| Adobe Illustrator | Professional Designers | High | Vector-based precision and custom branding. |
| Canva | Marketers & Students | Low | Massive template library and AI-generated icons. |
| Venngage | Data Analysts | Medium | Specialized in complex charts and business reports. |
| Piktochart | Educators & HR | Low/Medium | Strong focus on "presentation" style infographics. |
| Visme | Enterprise Teams | Medium | Interactive elements and advanced data integration. |
Step-by-Step Creation Guide
- Define Your Audience and Goal: Before picking a tool, determine who is looking at the graphic. A technical audience may appreciate complex scatter plots, whereas a general consumer audience needs simplified icons and "at-a-glance" conclusions.
- Collect and Verify Data: Ensure your sources are authoritative. In 2026, data integrity is paramount; always cite your sources at the bottom of the infographic in a small, unobtrusive font.
- Create a Wireframe: Do not start with colors. Sketch out the "skeleton" of the graphic. Where will the title go? Which data points need the most space? This prevents the design from becoming cluttered.
- Choose a Color Palette: Limit your palette to two or three primary colors and one accent color. High contrast is necessary for accessibility, ensuring that text is readable for individuals with visual impairments.
- Focus on Hierarchy: Use different font sizes to indicate importance. Your H1 (the title) should be the largest, followed by H2 subheaders, and then the body text. The "F-pattern" or "Z-pattern" of reading should guide the placement of elements.
Design Principles for Maximum Impact
An infographic's success is measured by how quickly the viewer understands the core message. To achieve this, designers must adhere to several key principles:
- Negative Space (White Space): Do not crowd the canvas. Negative space allows the viewer's eyes to rest and helps distinguish one section from another.
- Consistency: Use the same style of icons throughout the graphic. Mixing 3D icons with flat-design icons creates visual "noise" that distracts from the content.
- Accessibility (WCAG Standards): In 2026, digital accessibility is not optional. Ensure that your infographics include descriptive alt-text for screen readers and that the color contrast ratios meet Web Content Accessibility Guidelines (WCAG).
- Visual Balance: Distribute the weight of your elements evenly. If one side of the infographic is heavy with text, the other side should have a significant visual element to balance it out.
Common Pitfalls in Infographic Creation
Despite the accessibility of design tools, many infographics fail to deliver their message. One of the most common mistakes is data dumping. This occurs when the creator tries to include every piece of information they found, resulting in a wall of text that defeats the purpose of the medium. An effective infographic should be an "edited" version of the truth, focusing only on the most relevant insights.
Another frequent error is the use of misleading scales. For example, in a bar chart, the Y-axis should almost always start at zero. Starting an axis at a higher number can artificially inflate the differences between data points, which can be seen as a form of "data manipulation" and can damage the credibility of the publisher.
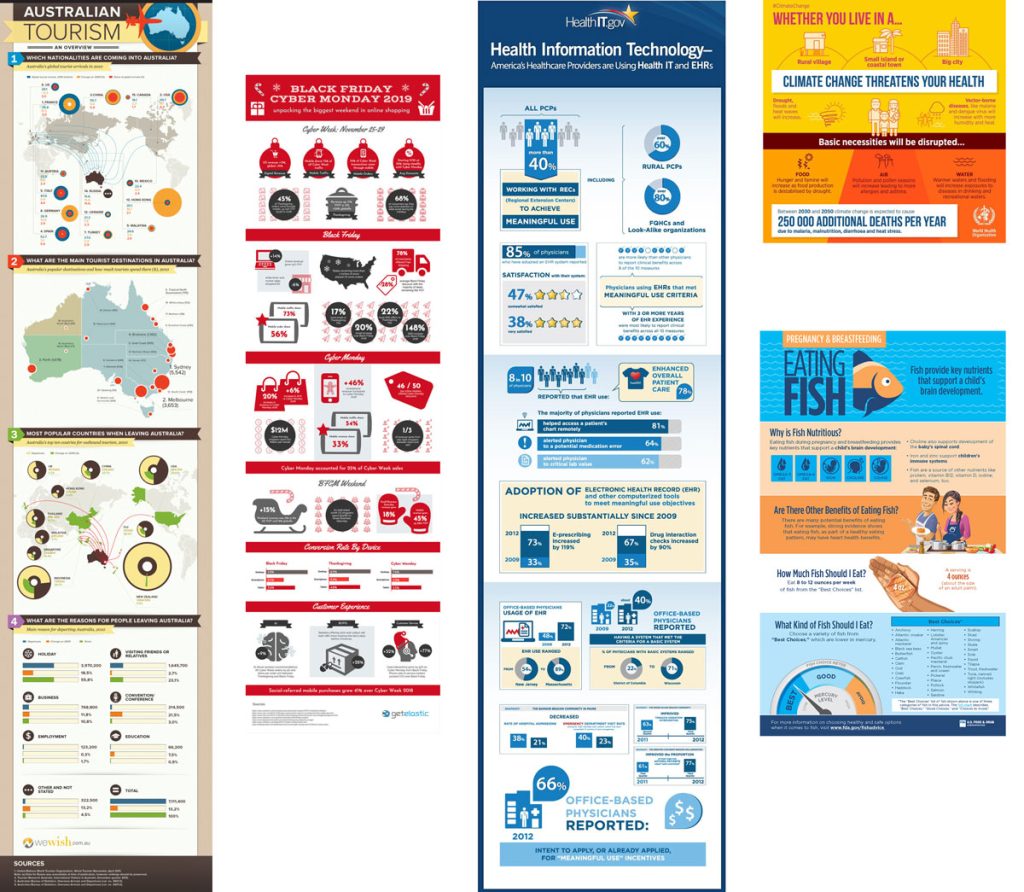
Finally, ignore the mobile experience at your own peril. In 2026, more than 70% of infographic consumption occurs on mobile devices. Long, narrow infographics (the "skyscraper" format) are generally easier to scroll through on a smartphone than wide, horizontal layouts designed for desktop monitors.
Frequently Asked Questions
What makes an infographic "viral"?
Virality is usually driven by a combination of high utility and unique design. An infographic that solves a common problem or provides a "new" perspective on a popular topic is more likely to be shared. In 2026, social media algorithms also prioritize graphics that have high "save" rates, meaning the content is valuable enough for users to reference later.
Are infographics still relevant in 2026?
Yes. Despite the rise of short-form video, infographics remain the gold standard for static, referenceable information. They are particularly vital in B2B marketing, academic publishing, and technical documentation where video may be too slow or too difficult to scan for specific facts.
How long should an infographic be?
There is no fixed length, but the most effective infographics are those that can be consumed in under three minutes. For web use, a width of 800 to 1,000 pixels is standard, with the length varying based on the content. If the graphic becomes too long, it is often better to split it into a "series" of smaller graphics.
Should I use AI to generate my infographics?
AI can be an excellent tool for generating icon sets, suggesting color palettes, or summarizing data. However, the "layout" and "narrative" should still be overseen by a human. Purely AI-generated infographics often suffer from "hallucinated" data or awkward text placement that can appear unprofessional.
How do I choose between a list and a process infographic?
If your items can be read in any order without losing meaning, use a list (Informational Infographic). If the items must be completed in a specific sequence to achieve a result, use a Process Infographic with clear directional cues like arrows or numbered steps.
Practical Recommendations
To begin your journey with infographics, start by auditing your existing long-form content. Look for a blog post, white paper, or report that is rich in data or steps. Attempt to "distill" that content into a single-page visual summary. Use a tool like Canva or Piktochart to experiment with pre-made templates before attempting a custom design from scratch.
Always prioritize clarity over cleverness. If a design element—no matter how beautiful—does not help the reader understand the data, remove it. The goal of an infographic is not just to be seen, but to be understood.
Image Gallery
Select an image to open it in a new tab.



Lars Thomsen
Global Labor Markets and Economic Strategy Editor
