
The average net worth of the American public is a complex financial metric primarily driven by home equity, retirement savings, and equity market performance. According to the most recent data from the Federal Reserve’s Survey of Consumer Finances, the mean net worth for U.S. households stands at approximately $1.06 million, though the median—a more accurate representation of the typical family—is closer to $192,900.
Distinguishing Mean vs. Median in Wealth Metrics
When evaluating the financial health of the American public, the distinction between "mean" and "median" is critical. The mean, or arithmetic average, is calculated by summing the total assets of every household in the country and dividing by the number of households. Because the United States features a highly skewed distribution of wealth, where a small percentage of ultra-high-net-worth individuals hold a significant portion of total assets, the mean is often inflated.
The median, by contrast, represents the exact midpoint of the data: half of the population holds more than this amount, and half holds less. Financial analysts prefer the median when discussing the "average" American experience because it is not distorted by the extreme outliers at the top of the economic hierarchy. Understanding this distinction is the first step in contextualizing your own financial position relative to national benchmarks.
The Components of Household Net Worth
Net worth is defined as the total value of assets minus total liabilities. To calculate your position, you must aggregate your holdings and subtract your debts. In the American context, this calculation usually involves several core categories:
- Primary Residence: For many American families, the home is the single largest asset. Home equity represents the current market value of the property minus the remaining mortgage balance.
- Retirement Accounts: This includes 401(k) plans, Individual Retirement Accounts (IRAs), and pension entitlements. These are often the largest liquid or semi-liquid assets for older households.
- Financial Assets: This category encompasses brokerage accounts, mutual funds, stocks, bonds, and cash holdings in savings or checking accounts.
- Debt Obligations: Liabilities include mortgage balances, credit card debt, student loans, auto loans, and personal lines of credit. Debt subtracts directly from total net worth.
- Other Assets: This includes business equity, investment real estate, vehicles, and collectibles.
Why Wealth Varies by Age Group
Net worth is rarely static; it follows a predictable "life cycle" trajectory for most Americans. Age is perhaps the most significant demographic indicator of expected net worth.
Younger households, typically those headed by individuals under 35, often have lower net worth because they are in the early stages of their careers, may be carrying significant student debt, and have had limited time to benefit from the compounding interest of investments. As individuals enter their 40s and 50s, net worth typically rises as mortgage balances decrease and retirement accounts grow through consistent contributions and market appreciation.
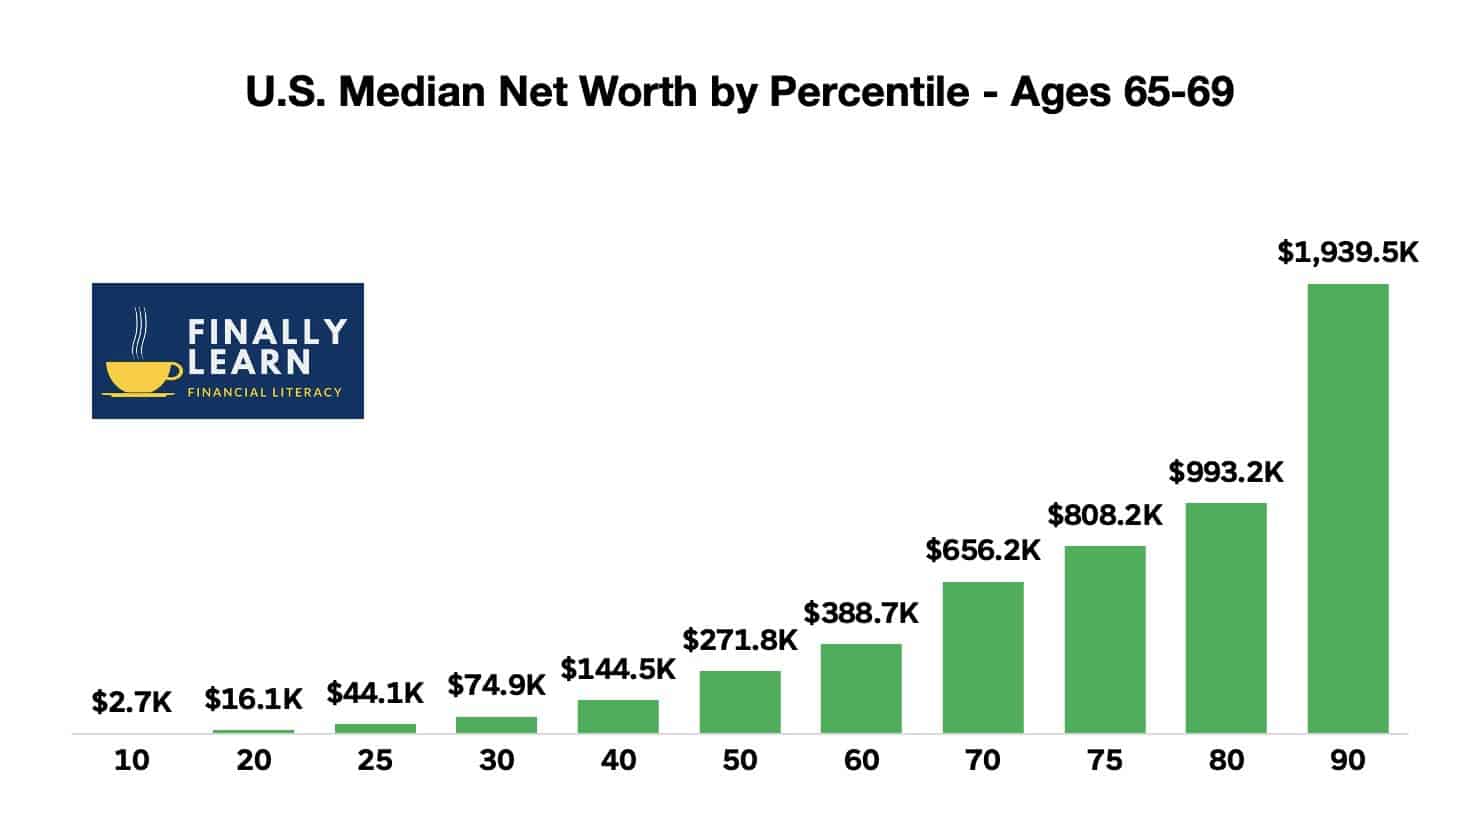
The peak for median net worth generally occurs in the age bracket of 65 to 74. At this stage, many Americans have paid off their primary mortgage, maximized their retirement savings, and are beginning to transition into a drawdown phase of their financial lives.
Comparing Wealth Across Demographic Segments
Wealth distribution in the United States is heavily influenced by factors beyond just age, including education level, geographic location, and professional field.
| Demographic Segment | Primary Net Worth Driver | Typical Wealth Concentration |
|---|---|---|
| Under 35 years | Income growth potential | Student debt & starter homes |
| 35–44 years | Real estate appreciation | Mortgage & education costs |
| 45–54 years | Retirement account growth | Career peak earnings |
| 55–64 years | Investment compounding | Peak wealth accumulation |
| 65+ years | Home equity & social security | Wealth preservation/drawdown |
The Impact of Economic Volatility
The American public’s net worth is not immune to macroeconomic shifts. Interest rate policies set by the Federal Reserve, the volatility of the S&P 500, and regional real estate cycles all create fluctuations in household balance sheets. When interest rates are low, borrowing costs decrease, often fueling home price appreciation and increasing the net worth of homeowners. Conversely, periods of high inflation or market downturns can quickly erode the value of financial portfolios.
Because a large share of household wealth is tied to equities and real estate, the "average" net worth can shift noticeably within a single fiscal year based on the performance of these two sectors. It is vital to recognize that an increase in net worth does not always equate to an increase in liquid cash flow; rather, it often represents an increase in "paper wealth" that may not be accessible without selling the asset.
Measuring Your Personal Financial Position
To determine how your net worth compares to the broader American public, follow these systematic steps:
- Audit Your Assets: Create a comprehensive list of everything you own with a resale value. Be conservative with valuations for vehicles and personal property; focus on market value rather than original purchase price.
- Total Your Liabilities: Compile a list of all outstanding debts. Include the current payoff amount for your mortgage, not the original loan amount.
- Calculate the Difference: Assets minus Liabilities = Net Worth.
- Adjust for Inflation: When comparing your current figure against historical data, remember to account for the erosion of purchasing power over time.
- Evaluate Trends: Instead of obsessing over a single point in time, track your net worth annually. A positive trend in net worth, even if it starts below the national median, is often a more important indicator of long-term financial health than a static number.
Common Pitfalls in Wealth Calculation
Many Americans inaccurately calculate their net worth by omitting liabilities or failing to account for depreciation. A common error is counting the full value of a home without subtracting the mortgage balance. Another error is failing to treat depreciating assets correctly; while a vehicle is an asset, its value declines significantly over time. When estimating net worth for long-term planning, it is best to stick to assets that offer some form of appreciation or long-term utility, such as real estate, index funds, or business interests.
Frequently Asked Questions
Does the average net worth include retirement accounts? Yes, the federal data on household wealth includes all retirement assets, including 401(k)s, IRAs, and employer-sponsored pension plans. Because these accounts are a major source of wealth for older generations, excluding them would result in a significant underestimation of the true financial state of the American public.
Why is my net worth lower than the reported average? The reported "mean" net worth is heavily skewed by the wealthiest 1% of the population. If your net worth is lower than the mean, you are not necessarily behind; you should compare your figures against the "median" for your specific age group, which provides a much more realistic benchmark for the typical household.
How often should I recalculate my net worth? An annual calculation is sufficient for most people. Tracking it more frequently, such as monthly, can lead to unnecessary anxiety caused by short-term market volatility. Aim to perform your calculation at the same time each year to provide a consistent comparison.
Is home equity considered "real" wealth? Home equity is a component of net worth, but it is "illiquid," meaning it cannot be easily spent without selling the home or taking out a loan against the property. While it represents significant value, it is best to view it as part of a diversified financial plan rather than a primary source of emergency cash.
Does debt negate wealth? Debt is a liability that directly offsets assets. However, not all debt is treated the same. High-interest consumer debt (like credit cards) is a destructive force to net worth, while lower-interest, tax-advantaged debt (like a mortgage) can sometimes be a strategic tool that allows you to deploy capital into more lucrative investments.
Recommendation for Next Actions
To manage and grow your net worth, focus on the "gap" rather than the "total." The gap between your income and your expenses determines your capacity for savings. Prioritize paying down high-interest debt, as this provides a guaranteed "return" on your money equal to the interest rate you are avoiding. Once high-interest debt is eliminated, shift your focus to maximizing contributions to tax-advantaged accounts like 401(k)s or IRAs, which allow your assets to compound over time. Always ensure your emergency fund is sufficient to avoid tapping into long-term investments during unexpected financial downturns.

Image Gallery
Select an image to open it in a new tab.





Lars Thomsen
Global Labor Markets and Economic Strategy Editor
