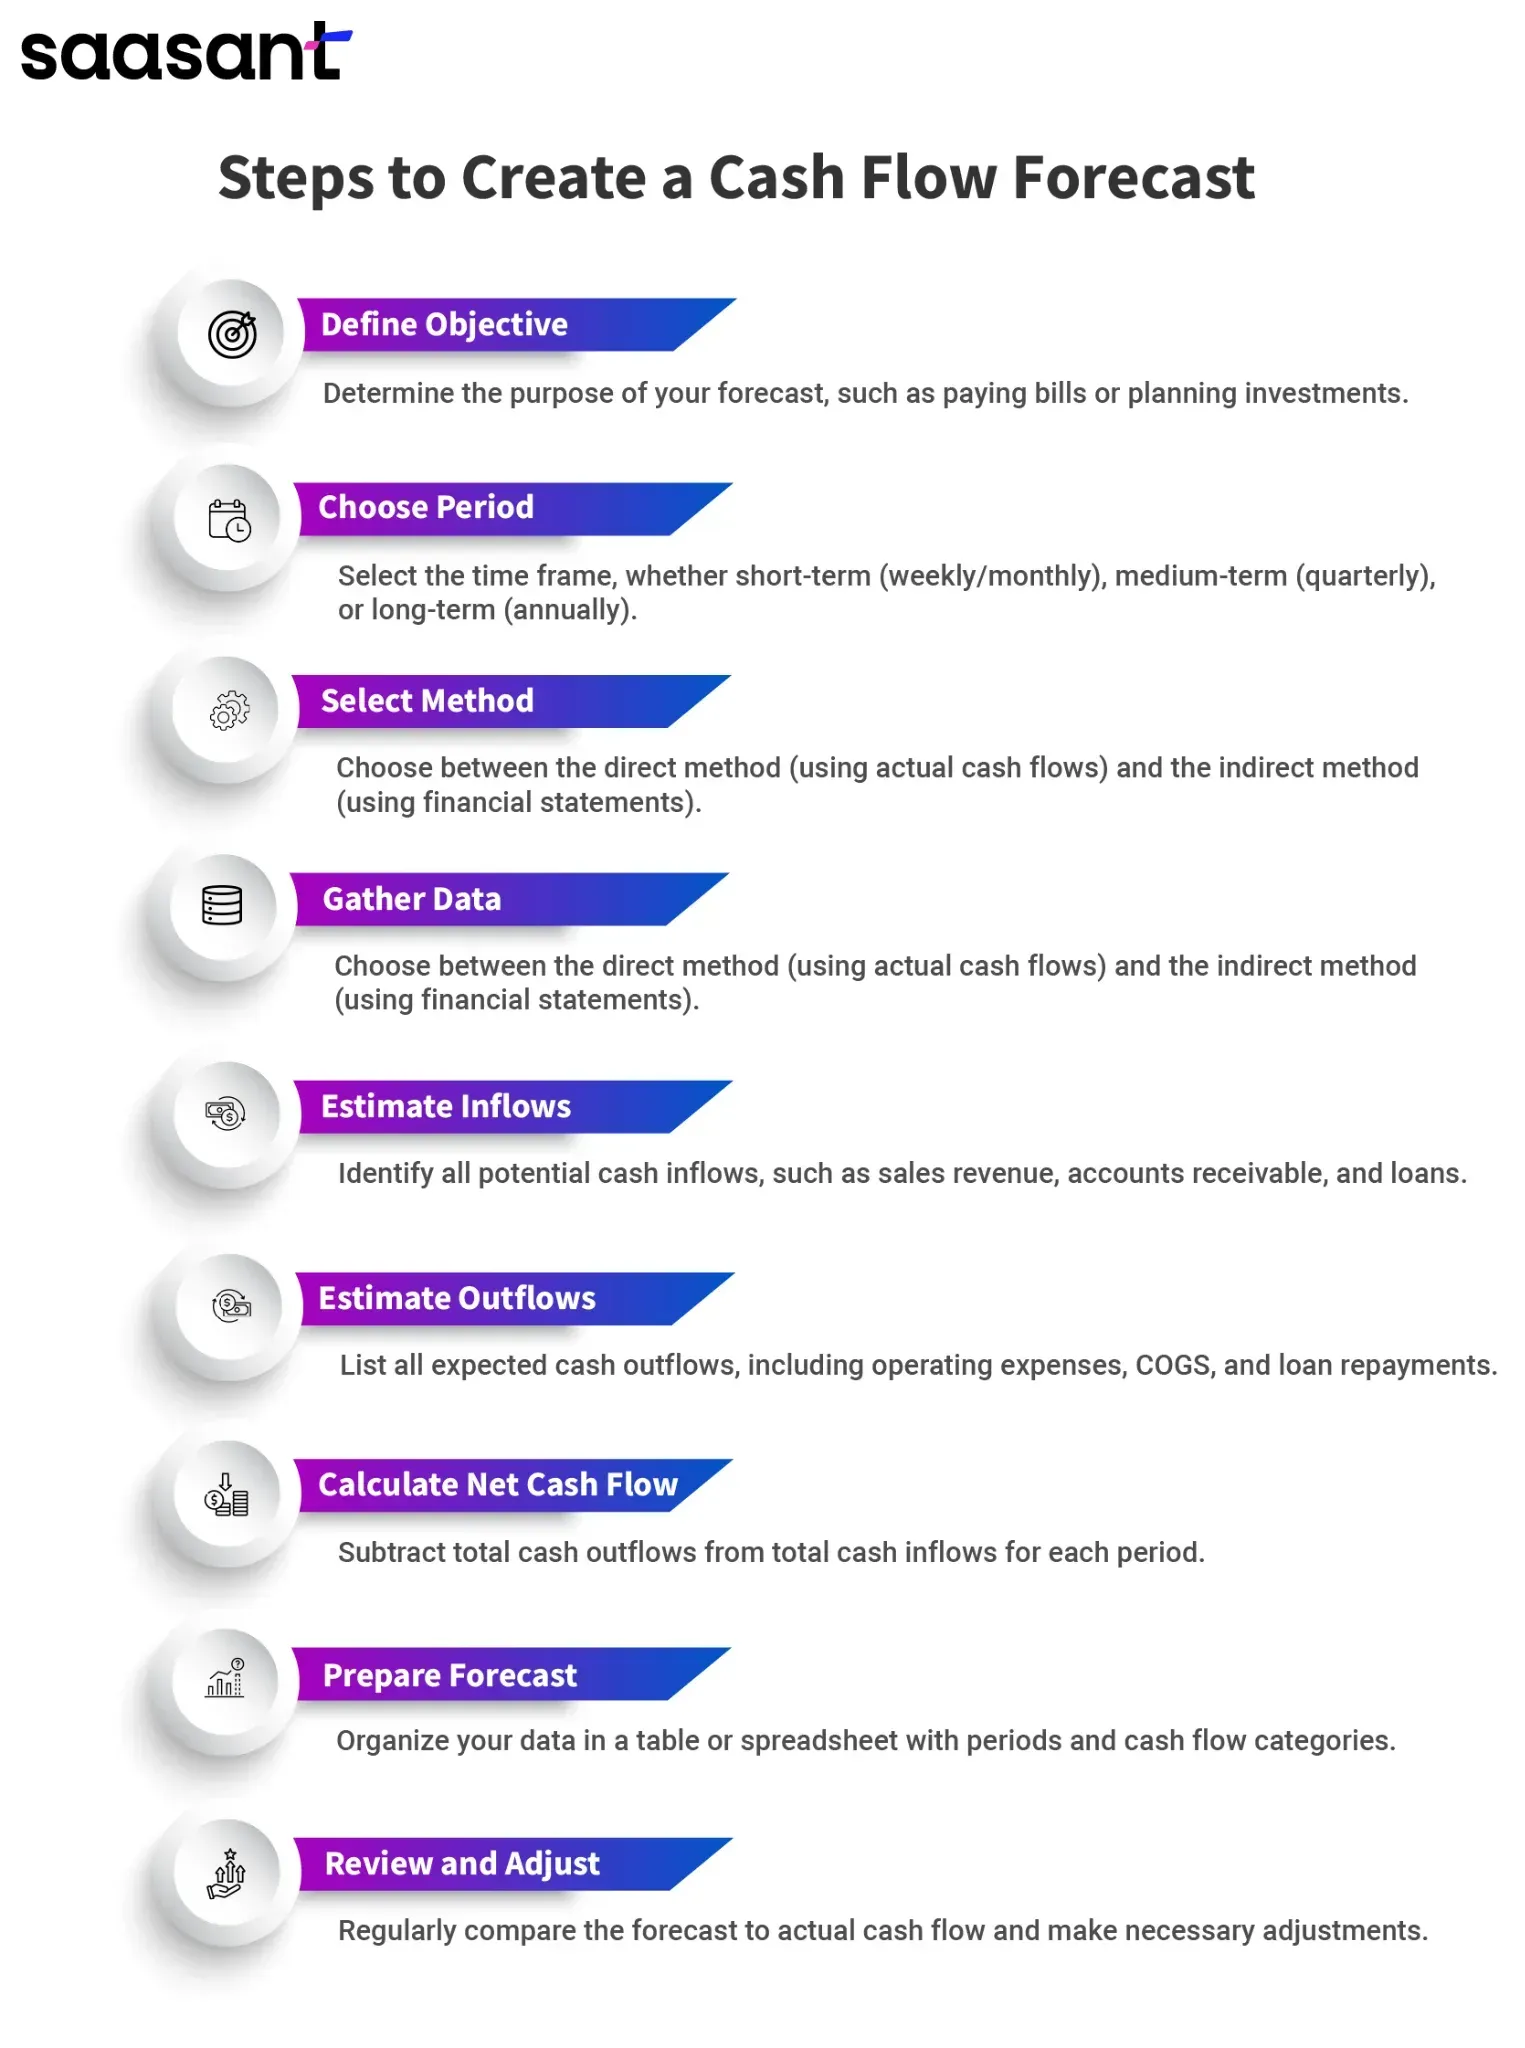
A cashflow table helps forecast cash needs by mapping out the timing and volume of expected money coming in versus money going out over a specific period. By visualizing these movements in a structured grid, businesses can identify future "cash gaps," schedule major expenditures during surplus months, and ensure they maintain sufficient liquidity to meet operational obligations.
The ability to look ahead at a company’s financial health is the difference between proactive growth and reactive crisis management. While many business owners focus heavily on the Profit and Loss (P&L) statement, the P&L often hides the reality of a bank balance. You can be profitable on paper while being "cash poor" because your customers haven't paid you yet, or your inventory is sitting in a warehouse. This is where the cashflow table, also known as a cash flow forecast or projection, becomes an indispensable tool for financial survival and strategic planning.
The Fundamental Mechanics of a Cashflow Table
To understand how a cashflow table helps forecast needs, one must first understand its structural composition. Unlike a static balance sheet, a cashflow table is a dynamic document, usually organized into columns representing time buckets—typically weeks or months—and rows representing categories of cash movement.
The Starting Balance
Every forecast begins with the "Beginning Cash Balance." This is the actual liquid cash available in bank accounts at the start of the period. This figure is the anchor; if this number is inaccurate, the entire forecast for the subsequent twelve months will be skewed.
Cash Inflows (The Sources)
The "Inflows" section of the table lists every way money enters the business. This includes:
- Cash Sales: Revenue collected immediately at the point of sale.
- Accounts Receivable (AR) Collections: This is the most critical variable. Forecasting cash needs requires estimating when customers will actually pay their invoices (e.g., 30, 60, or 90 days), rather than when the sale was recorded.
- Asset Sales: Cash from selling equipment or property.
- Financing: Injections from loans, lines of credit, or investor equity.
Cash Outflows (The Uses)
The "Outflows" section tracks every dollar leaving the business. In a 2026 business environment where many services are subscription-based and automated, these are often easier to predict but harder to reduce quickly. They include:
- Operating Expenses: Payroll, rent, utilities, and software subscriptions.
- Cost of Goods Sold (COGS): Payments to suppliers for raw materials or inventory.
- Capital Expenditures (CapEx): Large one-time purchases for growth, like new machinery or technology infrastructure.
- Debt Service: Principal and interest payments on existing loans.
Identifying the "Cash Gap" Before It Occurs
The primary way a cashflow table helps forecast needs is by highlighting the "Cash Gap"—the period where your outflows exceed your inflows and your starting balance combined.
For example, a construction company might sign a massive contract in January. On the P&L statement, January looks like a record-breaking month for revenue. However, the cashflow table reveals a different story: the company must pay for materials and labor in February and March, but the client won't pay the first major invoice until April.
Without a cashflow table, the owner might see the "profit" in January and decide to buy a new truck. With the table, the owner sees that the "Ending Cash Balance" for March is projected to be negative. The table forecasts a cash need of $50,000 for that period, allowing the owner to secure a short-term line of credit or negotiate a deposit from the client before the work begins.

Strategic Planning and Scenario Modeling
In 2026, financial volatility remains a constant challenge. A cashflow table allows for "What-If" analysis, which is the cornerstone of modern forecasting. By adjusting the variables within the table, a manager can see the ripple effects of different business decisions.
Testing Growth Strategies
If a business plans to expand into a new territory, the cashflow table can model the impact. It might show that while the expansion will eventually be profitable, the initial marketing spend and hiring costs will drain the cash reserves to a dangerously low level in month four. This forecast tells the leadership team that they need to raise additional capital now, rather than waiting until the bank account hits zero.
Preparing for Economic Contraction
Conversely, if the market shifts, a business can use the table to model a 20% decrease in AR collections. This helps forecast which expenses are "must-pay" (like payroll) and which can be deferred (like office renovations) to keep the business solvent during a downturn.
Comparing Cash Management Tools
While many businesses use various reports, the cashflow forecast serves a unique purpose compared to historical documents.
| Feature | Cash Flow Statement (Historical) | Cash Flow Table (Forecast) |
|---|---|---|
| Time Orientation | Past (Looking back at what happened) | Future (Looking forward at what might happen) |
| Primary Goal | Compliance and tax reporting | Liquidity management and planning |
| Data Source | Actual accounting records | Estimates, sales pipelines, and historical trends |
| Update Frequency | Monthly or Quarterly | Weekly or "Rolling" |
| Primary User | Investors, Tax Authorities, Lenders | Internal Management, CFOs, Owners |
| Flexibility | Rigid (must follow GAAP/IFRS) | High (can be customized to the business) |
Improving the Accuracy of Your Forecast
A cashflow table is only as useful as the data fed into it. To accurately forecast cash needs, businesses must look beyond simple averages.
Factoring in Seasonality
Most businesses have peaks and valleys. A retail business might see 40% of its inflows in the fourth quarter but face massive outflows for inventory in the third quarter. A cashflow table helps forecast the specific amount of "cushion" needed to survive the lean months. By looking at three years of historical data, a manager can apply seasonal multipliers to the forecast to make it more realistic.
Accounting for Payment Delays
One of the most common mistakes in forecasting is assuming customers will pay on time. If your terms are "Net 30," but your average Days Sales Outstanding (DSO) is actually 44 days, your cashflow table should reflect the 44-day reality. Forecasting cash needs based on a 14-day delay across all invoices can reveal a massive hidden requirement for working capital.
The Role of "Burn Rate"
For startups and high-growth companies, the cashflow table is the primary tool for calculating "Burn Rate"—the rate at which a company spends its capital before generating positive cash flow. By forecasting the monthly net loss, the table tells the founders exactly how many months of "runway" they have left. This provides a hard deadline for when they must either become profitable or secure more funding.
Modern Integration: Automation in 2026
As of 2026, the process of building and maintaining a cashflow table has been significantly streamlined by AI-integrated accounting software. Modern systems now connect directly to bank feeds and CRM pipelines to provide "Real-Time" forecasting.
These tools can analyze a specific customer's past payment behavior to predict the likelihood of an invoice being paid late. This level of granular detail makes the cashflow table even more accurate at forecasting cash needs. Instead of guessing that "Inflows" will be $100,000, the software can provide a "Probability-Weighted" inflow figure based on the current sales pipeline and historical collection rates.
Avoiding Common Forecasting Pitfalls
Even with the best tools, a cashflow table can lead to incorrect conclusions if certain factors are ignored.
- The "Optimism Bias": Overestimating sales and underestimating the time it takes to close a deal. It is always safer to forecast cash needs based on "Conservative" sales targets and "Aggressive" expense estimates.
- Ignoring One-Time Costs: Annual insurance premiums, quarterly tax payments, and software license renewals often surprise business owners. A robust cashflow table includes a "Non-Recurring Expenses" row to capture these "cash-killers."
- Static Forecasting: A forecast is not a "set it and forget it" document. In 2026, the most successful firms use "Rolling Forecasts," where they add a new month to the end of the table as the current month closes. This ensures the business is always looking 12 months into the future.
FAQs About Cashflow Tables
How often should I update my cashflow table?
For most small to medium-sized businesses, a weekly update is ideal. This involves replacing the "Projected" figures for the past week with "Actual" figures and then adjusting the future weeks based on any new information (such as a delayed project or an unexpected repair bill). Larger, more stable corporations may find a monthly update sufficient, while businesses in a crisis or rapid-growth phase should monitor cash daily.
What is the difference between a budget and a cashflow forecast?
A budget is a plan that outlines what you intend to spend and earn to reach a specific goal. A cashflow forecast is a realistic prediction of what will actually happen to your cash balance. You might budget $10,000 for marketing in June, but if you don't actually pay the agency until August, the budget shows the "expense" in June while the cashflow table shows the "outflow" in August.
Can a cashflow table help me get a loan?
Yes. Lenders are primarily concerned with "Debt Service Coverage"—your ability to pay back the loan. A detailed cashflow table proves to a bank that you understand your cash cycles and have a clear plan for how the loan proceeds will be used and how they will eventually be repaid through increased inflows.
Do I need specialized software to create a cashflow table?
While specialized FP&A (Financial Planning and Analysis) software is standard in 2026 for larger firms, a well-constructed spreadsheet (Excel or Google Sheets) remains an incredibly effective tool for many. The key is the logic and the data input, not necessarily the complexity of the software.
What should I do if my table forecasts a cash shortage?
If the table shows a negative ending balance in a future month, you have several "levers" to pull:
- Accelerate Inflows: Offer discounts for early payment or require deposits.
- Delay Outflows: Negotiate longer payment terms with vendors.
- Reduce Expenses: Cut non-essential spending.
- Secure Financing: Open a line of credit before you actually need the money.
Practical Recommendation for Business Leaders
To master your cash needs, start by creating a 13-week rolling cashflow forecast. This timeframe is long enough to capture most billing cycles but short enough to maintain high accuracy.
Assign a specific team member to update the "Actuals" every Monday morning. Review the "Ending Balance" for the next three months during your leadership meetings. If the balance ever dips below a "Safety Buffer" (typically 1–3 months of operating expenses), treat it as an immediate priority. By treating the cashflow table as a "living" document rather than a once-a-year exercise, you turn financial uncertainty into a manageable, predictable part of your business operations.
Image Gallery
Select an image to open it in a new tab.
Simon Caldwell
Enterprise Technology and Systems Editor
