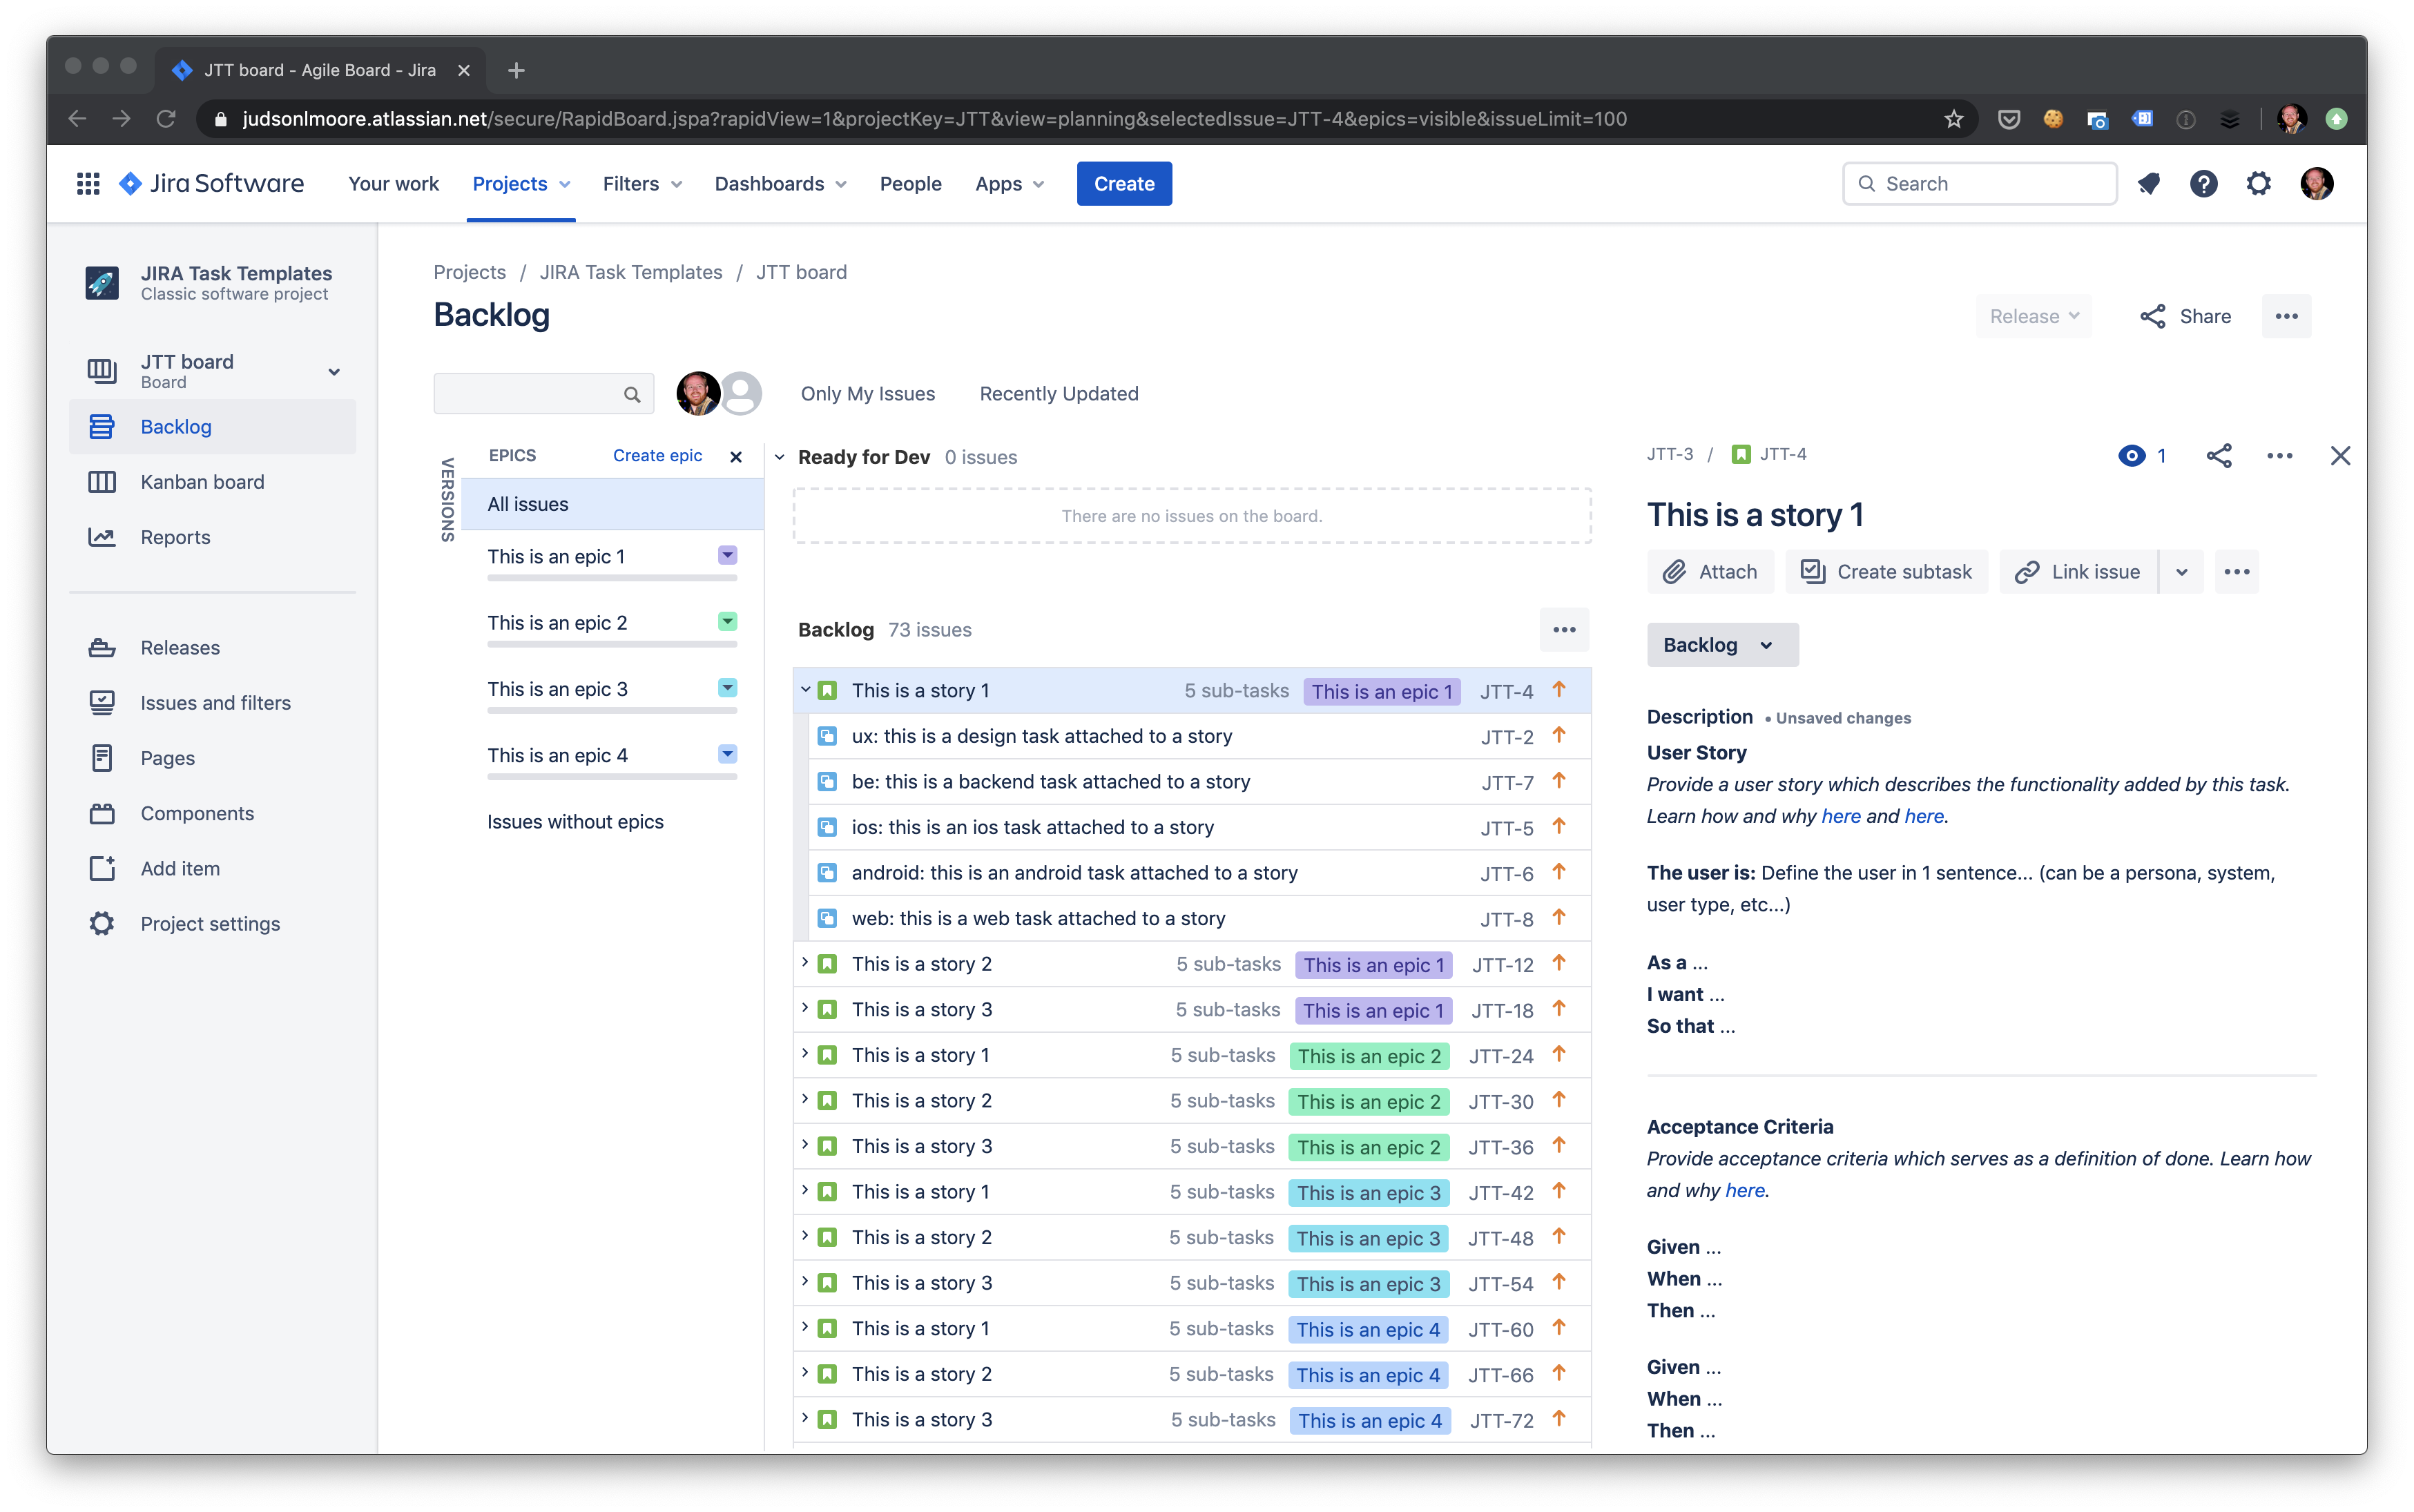
Exporting your Jira backlog to Microsoft Excel is a critical operational task for project managers, product owners, and stakeholders who need to perform offline analysis, create custom visual reports, or share project status updates with non-Jira users. By leveraging the built-in search and export functionalities within Jira, you can transform complex issue tracking data into a structured format suitable for pivot tables, advanced filtering, and long-term documentation.
Understanding the Jira Export Functionality
Jira, developed by Atlassian, is designed as a dynamic web-based issue tracking system. While it excels at live collaboration, its native reporting tools may occasionally fall short for users who require custom data manipulation. Exporting to Excel serves as the primary bridge between Jira’s real-time state and the static, highly customizable environment of a spreadsheet.
In Jira Cloud, the export functionality is tied to the Issue Navigator. This feature allows users to query the database, select specific fields, and extract the resulting data into a CSV (Comma-Separated Values) format, which is the native language of Excel. Because Jira issues contain complex metadata—including custom fields, linked items, and historical status changes—the export process requires a clear understanding of how to filter your backlog effectively before initiating the download.
Prerequisites for Successful Exporting
Before attempting to export your backlog, ensure you have the necessary permissions and environment settings.
- Jira Permissions: You must have the Export Issues permission for the project. If you are unable to see the "Export" button, consult your Jira administrator to verify your permission scheme settings.
- Browser Compatibility: While most modern browsers (Chrome, Firefox, Edge, Safari) handle CSV downloads seamlessly, ensure your browser is not blocking pop-ups or automatic file downloads.
- Data Scope: Decide whether you want to export all issues or only those meeting specific criteria (e.g., only "To Do" items, issues assigned to a specific sprint, or items with a high priority). Creating a tailored search query is the most effective way to ensure your Excel file remains manageable and relevant.
Step-by-Step: Exporting Your Backlog to Excel
The most reliable method to get your backlog into Excel involves using the Issue Navigator search. Follow these steps to ensure accuracy.
1. Execute the Search
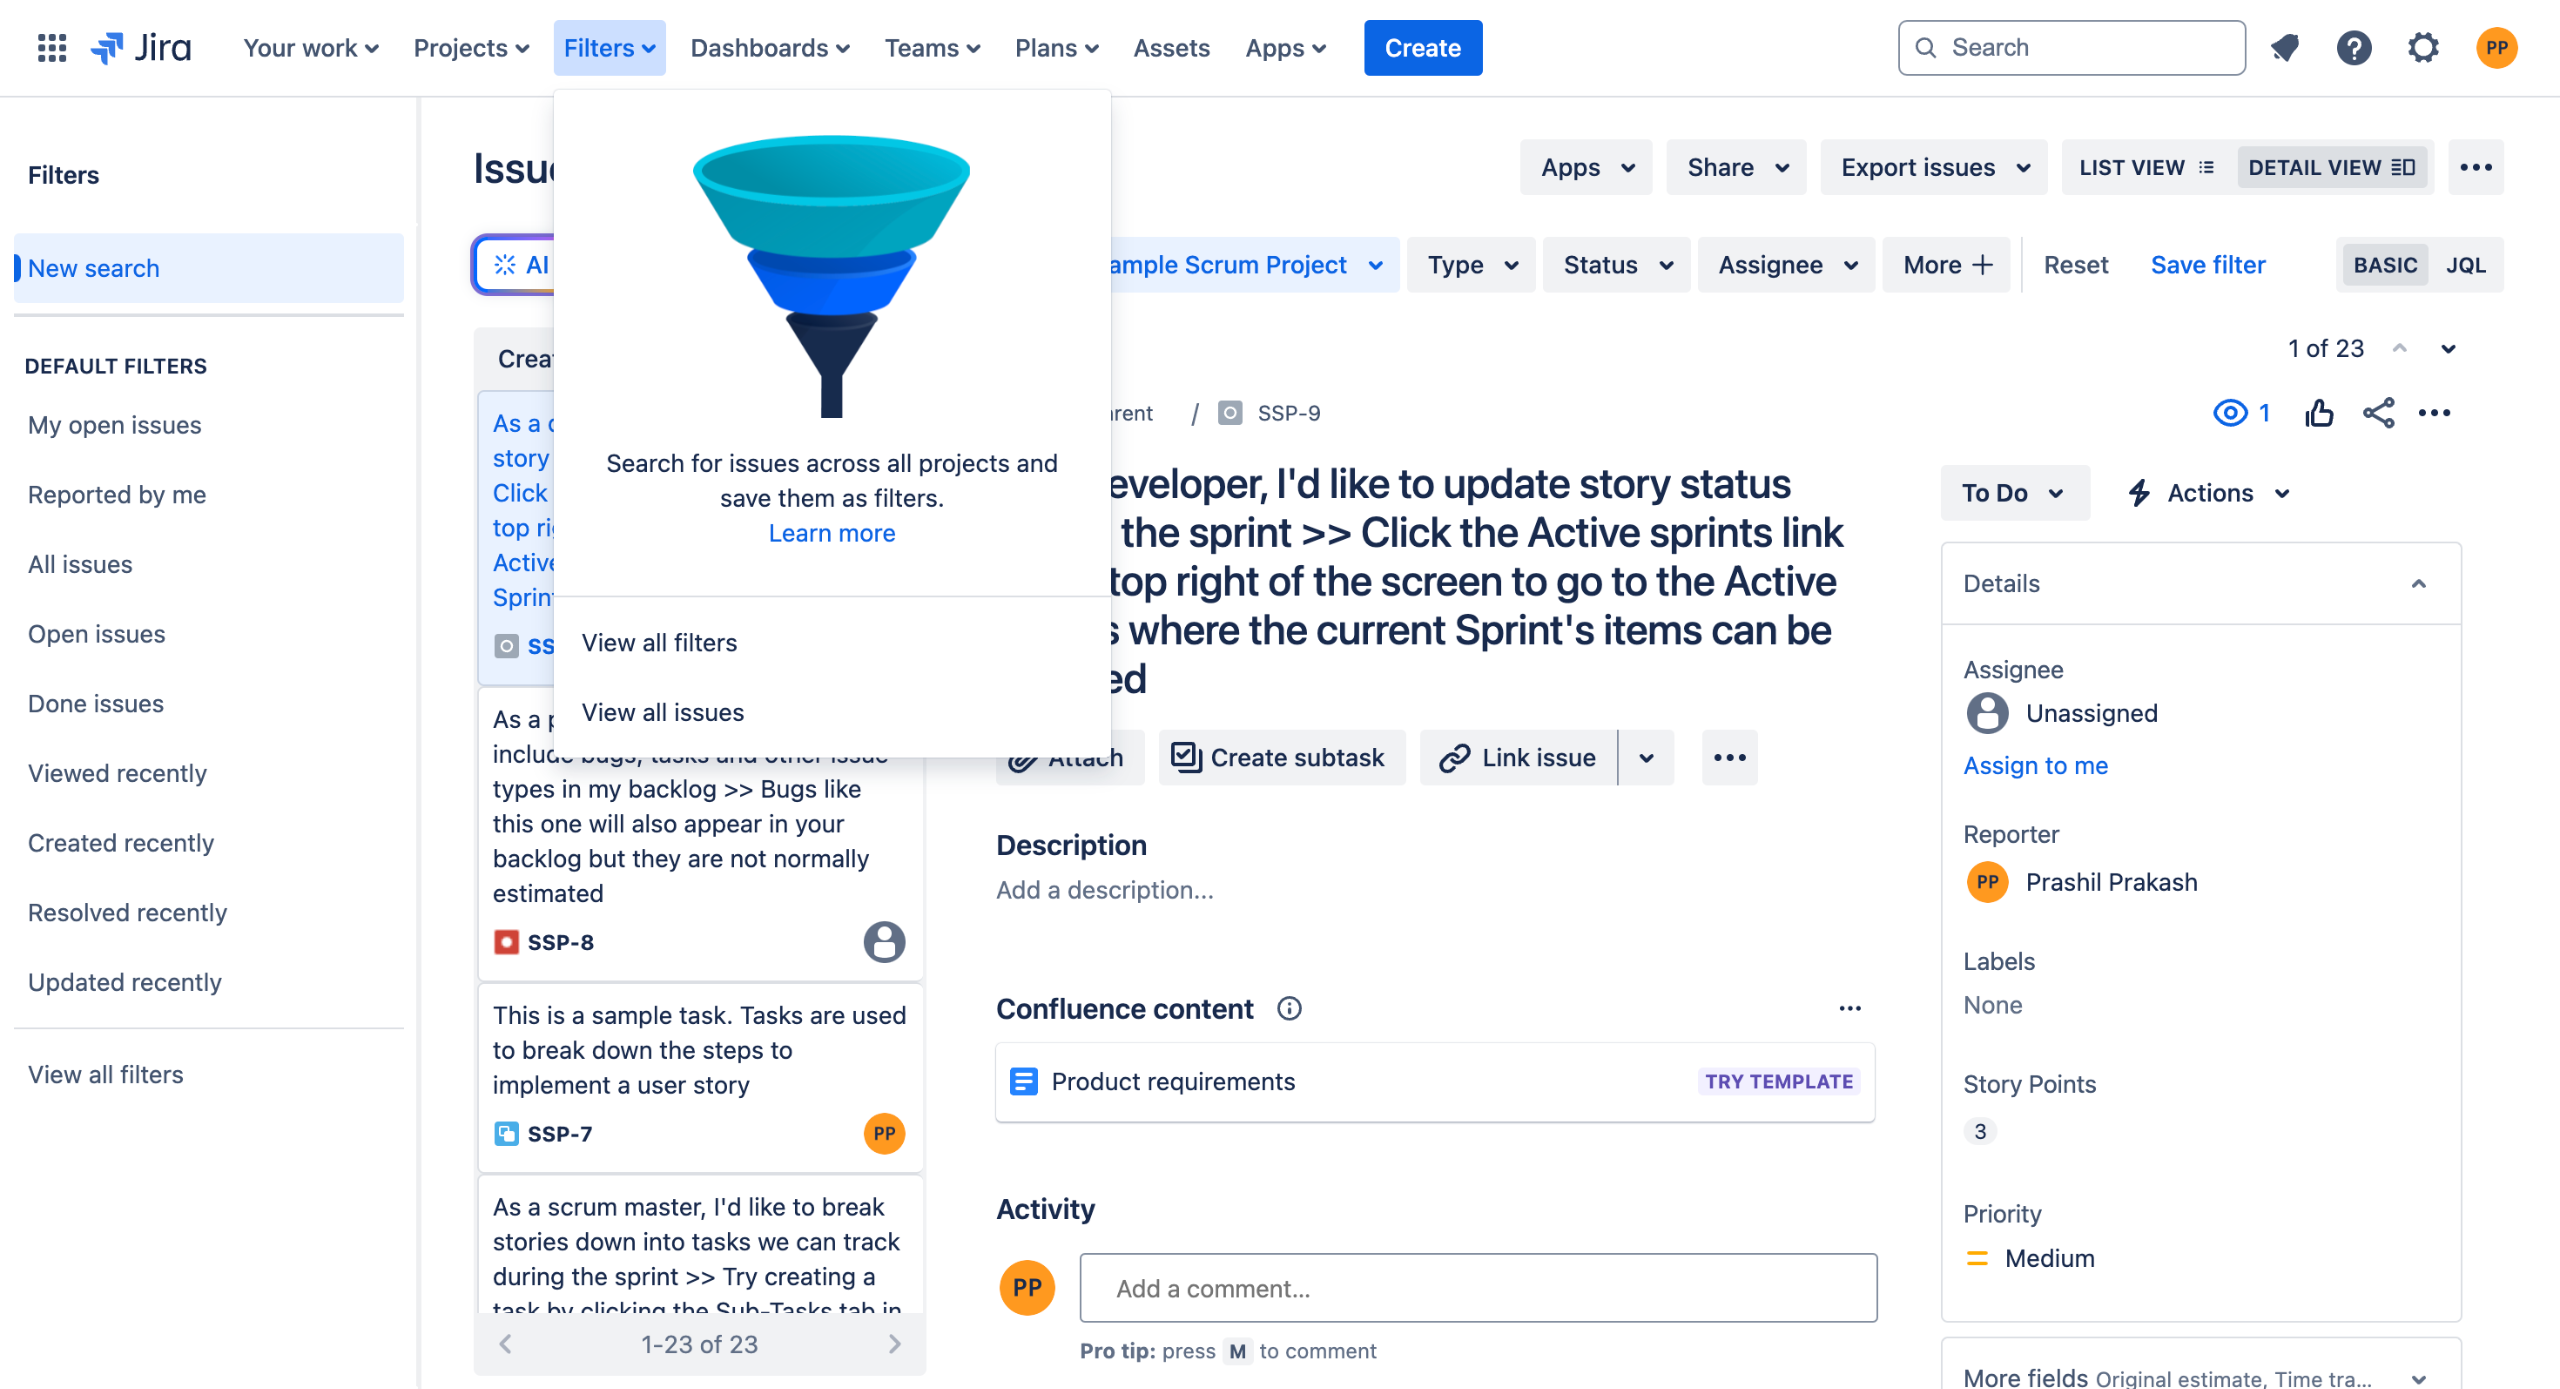
Navigate to the "Issues" menu in the top navigation bar and select "Search for issues." This opens the Issue Navigator. Use the basic search interface to select your project and filter by status (e.g., "Backlog" or specific statuses representing your queue). If you are comfortable with Jira Query Language (JQL), you can switch to the advanced view by clicking the "Advanced" button. For example, a simple query such as project = "MYPROJ" AND status = "Backlog" will isolate your backlog items.
2. Configure Your Columns
Before exporting, ensure that the columns displayed in the Issue Navigator are the fields you want to see in Excel. Click the "Columns" button on the right side of the screen and select the fields relevant to your report, such as "Summary," "Issue Key," "Assignee," "Priority," "Story Points," and "Created Date." The file you export will contain the exact columns visible in this view.
3. Initiate the Export
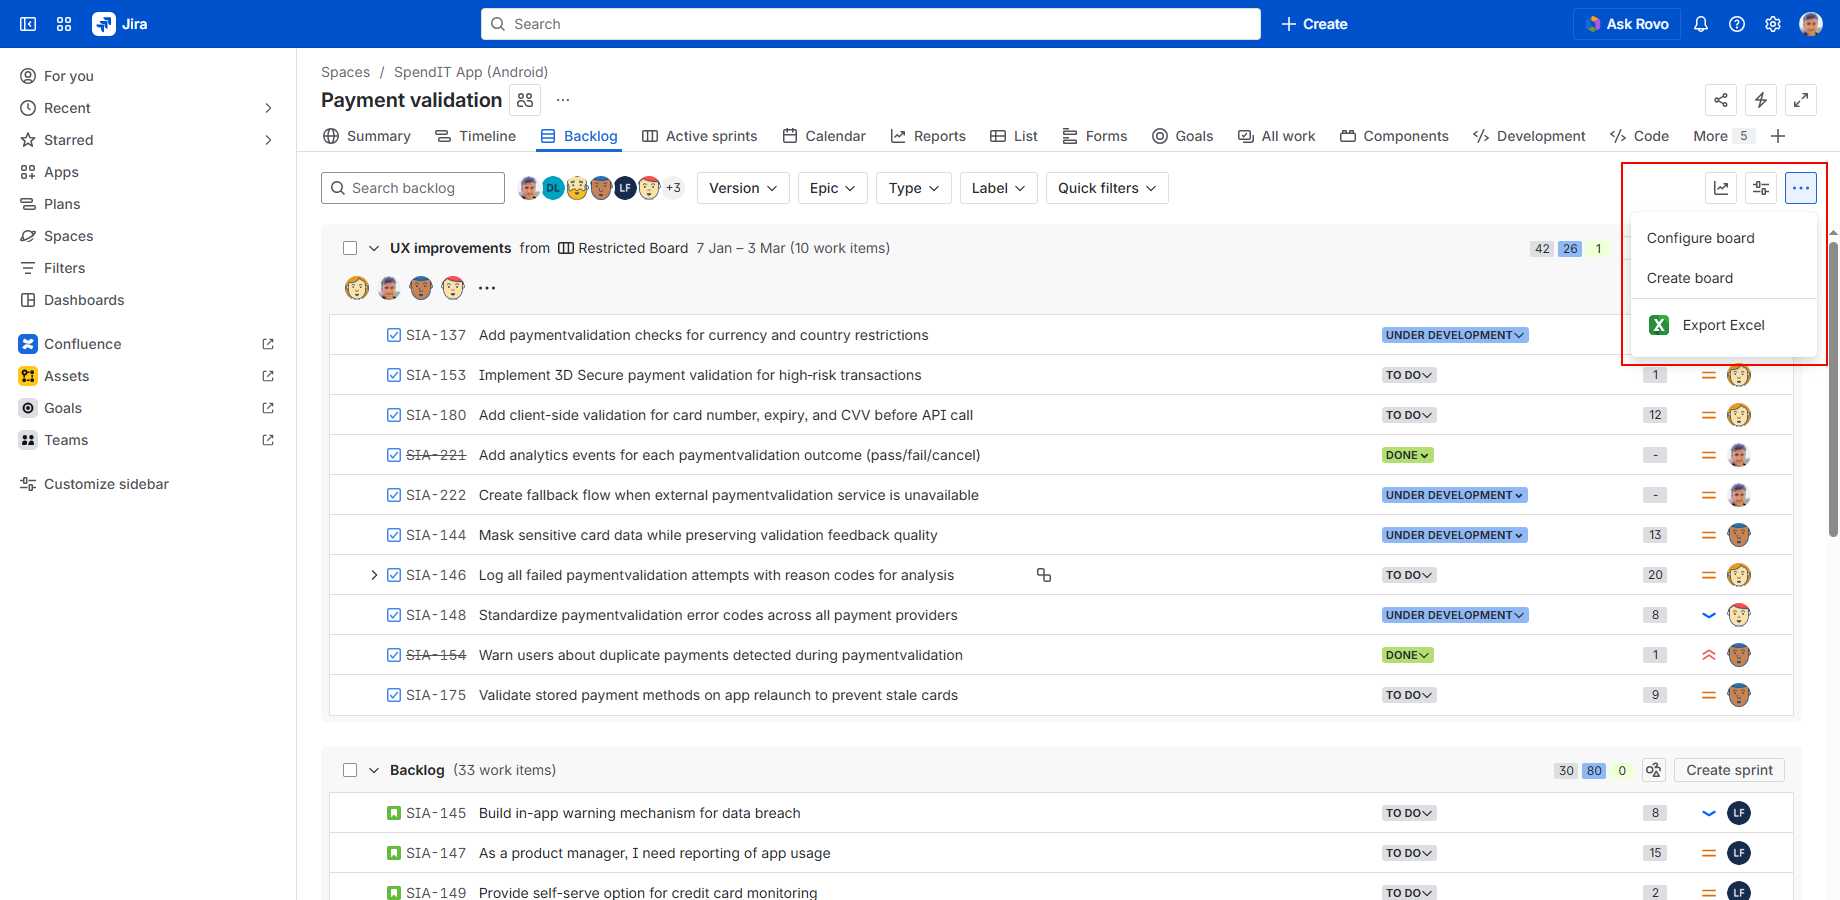
Once your list is filtered and your columns are configured, look for the "Export" icon (often represented by an arrow or a list symbol) in the top-right corner of the Issue Navigator. Click it and select "Export Excel CSV (all fields)" or "Export Excel CSV (my defaults)." Choosing "all fields" is generally recommended if you want to perform deep data analysis, as it captures hidden system fields that might be useful for auditing purposes.
4. Opening and Formatting in Excel
After the CSV file downloads, open it directly with Microsoft Excel. Because CSV is a plain-text format, you may need to perform initial formatting steps:
- Text to Columns: If all your data appears in a single column, use the "Data" tab’s "Text to Columns" tool, selecting "Delimited" and choosing "Comma" as the separator.
- Formatting Tables: Highlight your data and press
Ctrl + T(orCmd + Ton Mac) to convert the range into an official Excel Table, which enables automatic filtering and sorting.
Comparing Export Options
| Method | Best For | Pros | Cons |
|---|---|---|---|
| Standard CSV Export | Ad-hoc reporting | Fast, no add-ons required | Static, not updated in real-time |
| Excel Add-ins (e.g., Jira Connector) | Recurring reports | Syncs data, refreshes live | May require extra licensing/setup |
| API/REST Export | Developers/Automation | Highly customized data | High technical overhead |
Troubleshooting Common Issues
Even with a straightforward process, users sometimes encounter hurdles during the export.
Handling Special Characters
If you notice that special characters (such as emojis or non-Latin script) appear as garbled text in Excel, this is usually an encoding issue. Microsoft Excel often defaults to specific encoding schemes that do not always align with Jira’s UTF-8 output. To fix this, open the CSV file using the "Get Data" or "Import" function in Excel instead of double-clicking the file. This allows you to select "UTF-8" as the file origin during the import wizard, ensuring special characters display correctly.
Large Backlogs and Timeouts
If your backlog contains thousands of issues, the browser may time out or the file may become sluggish. If you face this, refine your search criteria to export in chunks—for instance, by exporting issues month-by-month or by status category—and then combine the sheets manually in Excel.
Missing Custom Fields
If a custom field is missing from your export, verify that the field is added to the "Issue Navigator" view. Even if a field is visible on the issue screen, it must be explicitly added to the columns in the Issue Navigator to appear in the exported CSV.
Advanced Data Handling: Using JQL for Smarter Exports
To extract only the most valuable data, mastering Jira Query Language (JQL) is essential. JQL allows you to bypass the constraints of the basic search interface. For instance, if you need to export your backlog for a capacity planning meeting, you might use a query like:
project = "DEV" AND statusCategory = "To Do" AND priority in (High, Critical) ORDER BY priority DESC.
By refining your JQL, you ensure that your Excel file is not cluttered with irrelevant tasks, allowing you to focus your attention on critical path items. Once you have a complex query that produces the perfect dataset, you can "Save" the filter in Jira. This allows you to rerun the same report repeatedly without having to rebuild the search criteria each time.
Limitations of Manual Exports
It is important to acknowledge that a manual CSV export is a point-in-time snapshot. It does not reflect changes made in Jira after the file is downloaded. If you require a dashboard that updates automatically, a static export will quickly become obsolete. For teams requiring real-time visibility, consider building a Jira Dashboard using the built-in "Filter Results" gadget or exploring Power BI/Tableau connectors that link directly to the Jira REST API. These tools provide the benefits of an Excel-like interface while maintaining a live connection to your project data.
Best Practices for Data Hygiene
Before sharing your exported backlog, take a moment to clean the data:
- Remove Redundant Rows: Filter out subtasks if you are only interested in parent stories, or vice versa.
- Validate Dates: Ensure that date fields (e.g., "Due Date" or "Resolved") are formatted correctly in Excel, as some regional settings may misinterpret the date format provided by the Jira export.
- Secure Sensitive Data: Be mindful of sharing the file. Jira exports may contain sensitive information, such as assignee email addresses or internal notes. Always strip columns containing non-public information before circulating the spreadsheet to external stakeholders.
Frequently Asked Questions
Can I export Jira comments to Excel? Yes, but they are often difficult to read because they appear as a long text string in a single cell. When exporting, ensure you select the "Comments" field in your column configuration. You may need to enable "Wrap Text" in Excel to view these blocks of text properly.
Why are my story points not calculating in Excel? Jira exports numbers as plain text in CSV files. To perform math on story points, select the column in Excel and change the cell format from "General" to "Number." You can then use the SUM function to calculate the total effort for the backlog.
Does exporting to Excel remove the data from Jira? No. Exporting is a "read-only" process. It creates a local copy of your data on your computer; your Jira project, status, and backlog remain entirely unaffected by the export process.
Is there a limit on how many issues I can export at once? Jira Cloud generally imposes a limit of 1,000 issues for standard exports. If your backlog exceeds this, you must use filters to break your export into smaller segments or use a dedicated plugin that supports larger data sets.
Can I automate the export process? Manual exporting cannot be scheduled. However, you can use built-in Jira subscriptions to email yourself a link to a filter search, or utilize third-party automation tools to send data to Google Sheets or Excel Online on a recurring basis.
Final Recommendation
For most users, the standard CSV export via the Issue Navigator is sufficient for periodic reviews. If you find yourself exporting the same backlog items every Monday morning, save your JQL filter in Jira and add it to your "Starred Filters" for quick access. For teams that require ongoing, high-frequency data analysis, consider transitioning from manual exports to a connected Business Intelligence tool to reduce administrative overhead and ensure that every stakeholder is viewing the most current information available in the system.
Image Gallery
Select an image to open it in a new tab.


Ingrid Bjornson
Global Cyber Policy and Regulation Analyst
