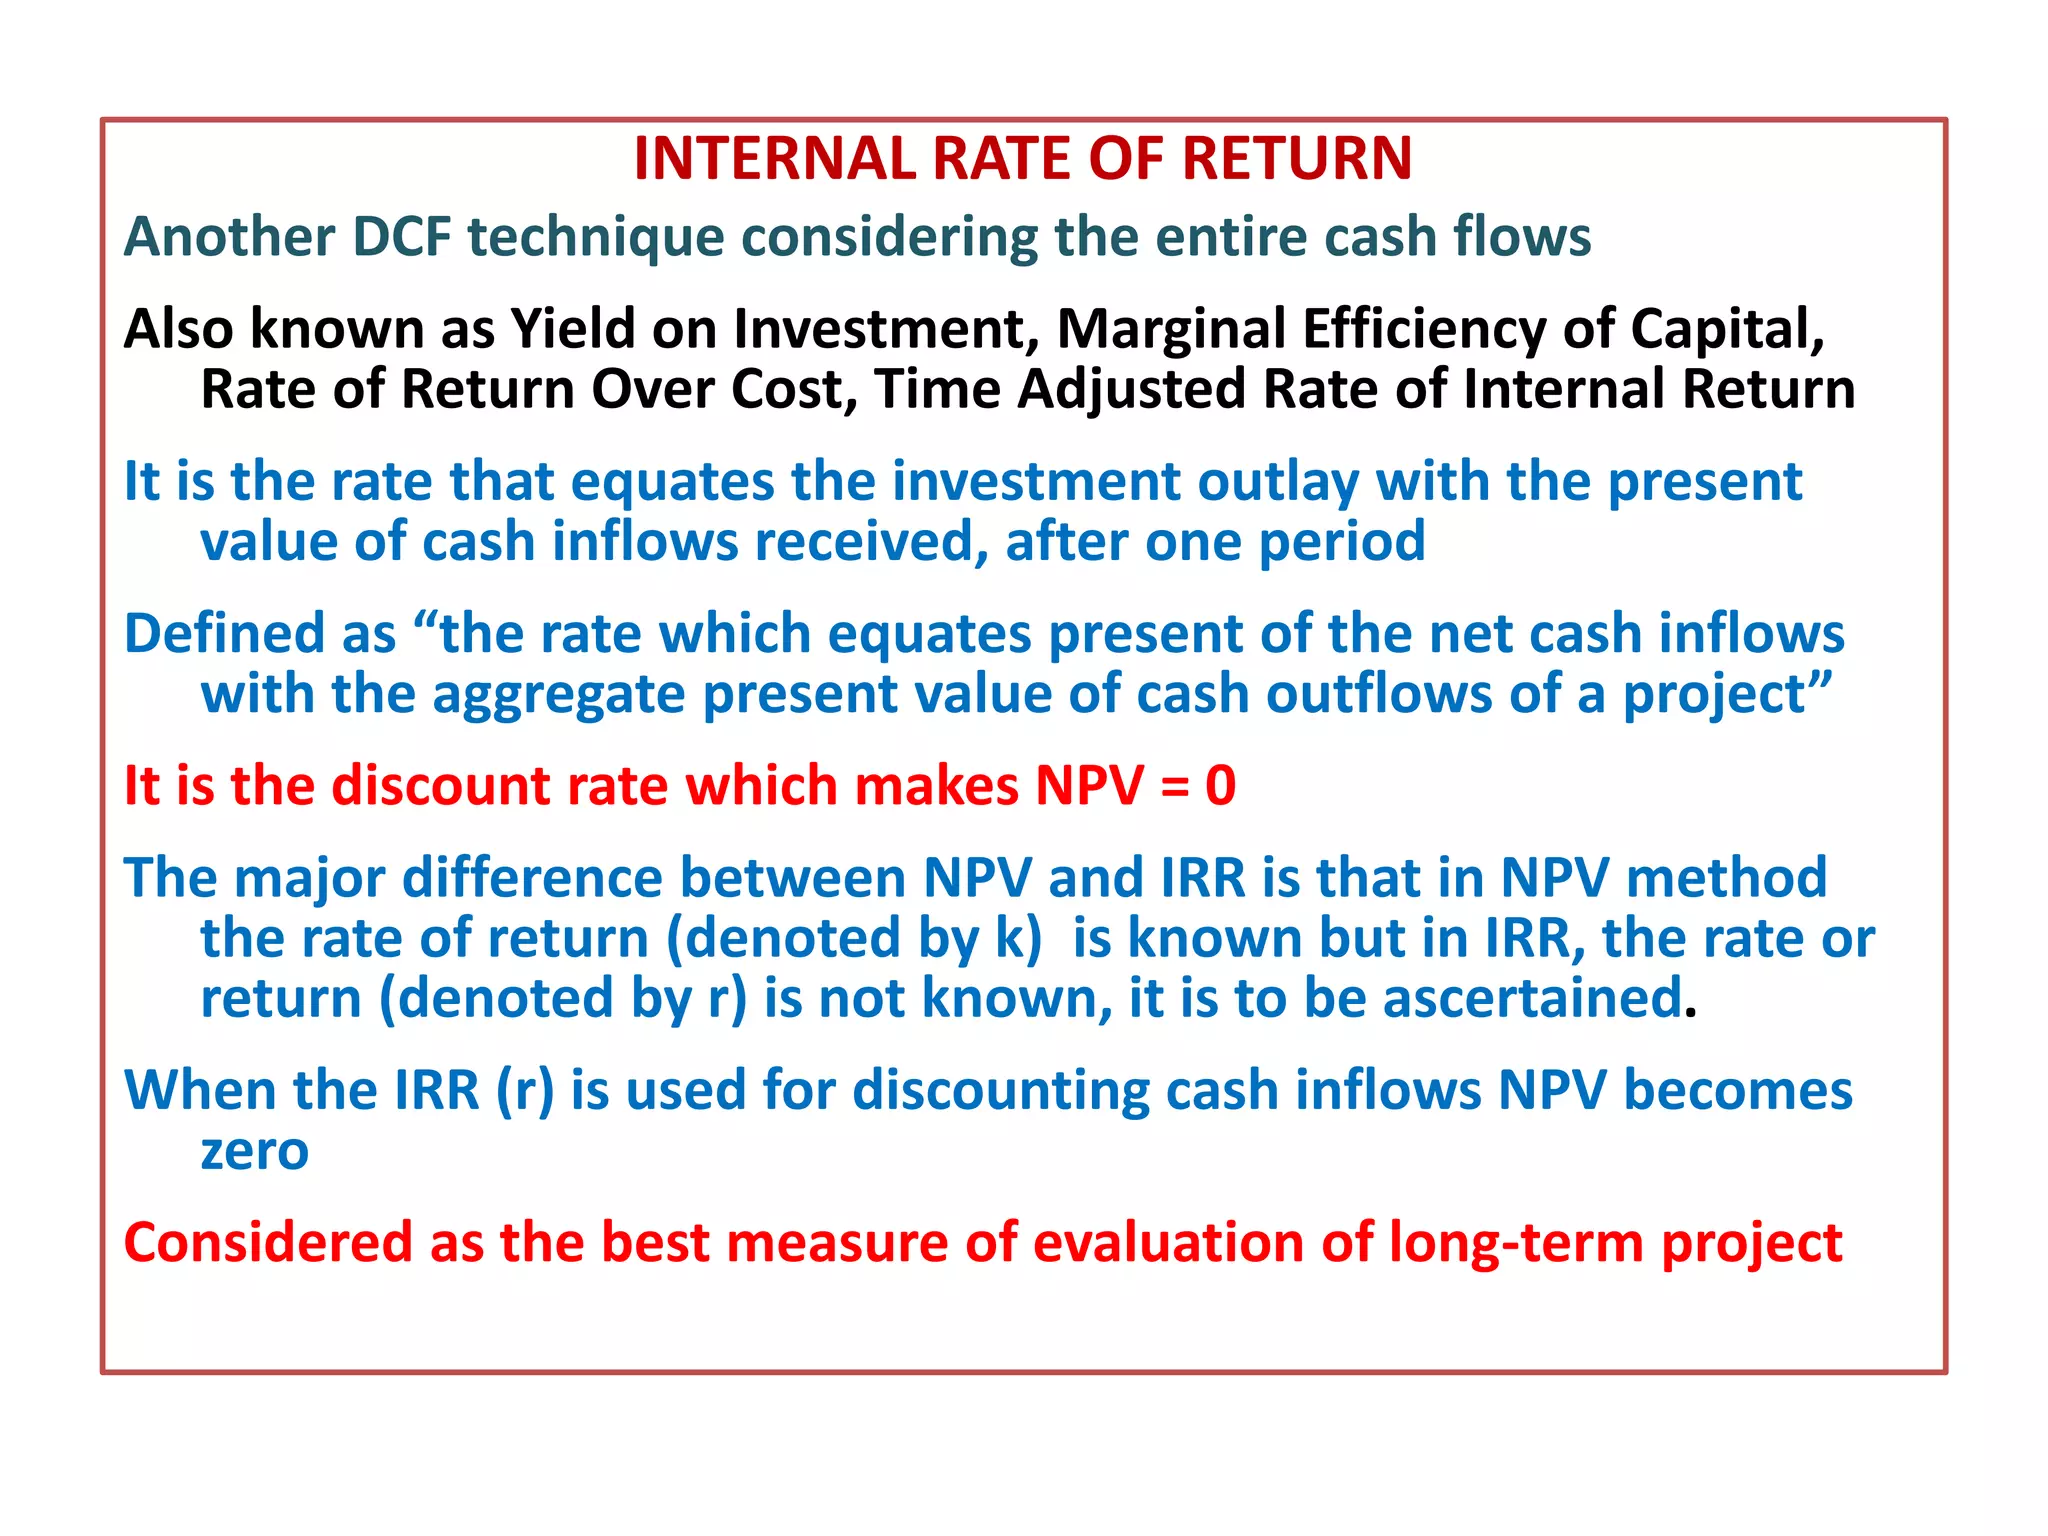
The internal rate of return (IRR) in project management is a financial metric used to estimate the profitability of potential investments by calculating the discount rate that makes the net present value (NPV) of all cash flows equal to zero.
Project management is as much about financial governance and resource allocation as it is about timelines, deliverables, and stakeholder management. When organizations evaluate multiple competing initiatives, project managers and financial controllers cannot rely on intuition or gross revenue projections alone. They need rigorous, standardized metrics to determine which projects will yield the highest return relative to their capital outlay.
One of the most powerful and widely utilized tools in financial project evaluation is the Internal Rate of Return (IRR). Understanding how IRR functions, how to calculate it, and how to apply it within project management workflows enables practitioners to make data-backed decisions that align project delivery with overarching corporate financial strategy.
What is the Internal Rate of Return (IRR)?
At its core, the internal rate of return is a discount rate that forces the Net Present Value (NPV) of all future cash flows from a specific project to equal zero. Stated differently, IRR is the annualized percentage yield that an organization can expect to earn on the capital invested in a project over its operational lifecycle.
To understand IRR, it is helpful to look at its mathematical relationship with Net Present Value. The NPV formula discounts future cash flows back to their present value using a specified hurdle rate or cost of capital:
$$\text{NPV} = \sum_{t=1}^{n} \frac{CF_t}{(1 + r)^t} - C_0 = 0$$
Where:
- $CF_t$ = Net cash inflow during period $t$
- $C_0$ = Initial total investment cost (cash outflow at time zero)
- $r$ = Internal Rate of Return (IRR)
- $n$ = Number of periods (lifespan of the project)
Because finding $r$ requires solving a polynomial equation where the output is zero, it cannot be isolated algebraically when a project spans more than two periods. Instead, it is calculated iteratively using financial calculators, spreadsheet software like Microsoft Excel or Google Sheets, or specialized project portfolio management (PPM) systems.
Why IRR Matters in Project Management
While project managers are traditionally evaluated on the "triple constraint"—scope, time, and budget—modern project management extends deep into portfolio value realization. Enterprise-level projects represent significant capital expenditures (CapEx) and operational expenditures (OpEx). IRR serves several critical functions in this context:
1. Capital Allocation and Prioritization
Organizations rarely have infinite budgets. When five different digital transformation or infrastructure projects are proposed, but the organization only has the capital to fund two, project management offices (PMOs) use IRR to rank them. Projects with the highest IRR are typically prioritized because they promise the most efficient generation of wealth per dollar spent.
2. Setting Investment Hurdles
IRR provides a direct percentage benchmark that can be compared against the company’s Cost of Capital or Weighted Average Cost of Capital (WACC). If a project’s IRR falls below the WACC, it means the project destroys value—it costs more to finance than it returns.
3. Communicating Value to C-Suite Stakeholders
Executive leadership and board members speak the language of finance. When a project manager can present a business case anchored in IRR, payback period, and NPV, they bridge the gap between technical execution and financial stewardship.

IRR vs. Other Financial Metrics
Evaluating a project using only IRR can lead to blind spots. Professional project managers and financial analysts evaluate IRR alongside complementary financial metrics to form a comprehensive view of project viability.
| Metric | Definition | Primary Advantage | Primary Limitation |
|---|---|---|---|
| Internal Rate of Return (IRR) | The discount rate at which NPV equals zero, expressed as a percentage yield. | Intuitive percentage output makes it easy to compare projects of different scales. | Can produce multiple rates for unconventional cash flows; ignores absolute dollar value. |
| Net Present Value (NPV) | The sum of the present values of incoming and outgoing cash flows over time. | Measures absolute wealth added to the firm in real currency terms. | Harder for non-financial stakeholders to interpret relative project efficiency. |
| Payback Period | The amount of time required for an organization to recover its initial investment. | Extremely simple to calculate and emphasizes liquidity and risk mitigation. | Ignores the time value of money and cash flows occurring after the payback threshold. |
| Return on Investment (ROI) | Net profit divided by the initial cost of the investment, expressed as a percentage. | Universally understood across business units. | Does not account for the time value of money or project duration. |
How to Calculate and Interpret IRR
Calculating IRR manually is impractical for complex projects with irregular cash flows spanning several years. However, understanding the mechanics helps project managers audit financial models and avoid garbage-in, garbage-out errors.
Step-by-Step Scenario Example
Imagine an enterprise software implementation project managed by a PMO.
- Initial Investment ($C_0$): $100,000 (spent in Year 0 for software licenses, customization, and training).
- Year 1 Cash Inflow: $30,000 (operational savings and efficiency gains)
- Year 2 Cash Inflow: $50,000
- Year 3 Cash Inflow: $50,000
To find the IRR, we plug these figures into a spreadsheet function: =IRR(values) where values range from Year 0 to Year 3 (-$100,000, $30,000, $50,000, $50,000).
- Calculated IRR: Approximately 14.8%
Interpretation Rule of Thumb
To determine whether this project should be greenlit, the project manager must compare the 14.8% IRR against the company's hurdle rate (minimum acceptable rate of return):
- If IRR > Hurdle Rate (e.g., WACC is 10%), the project is financially attractive and should generally be approved.
- If IRR < Hurdle Rate (e.g., WACC is 18%), the project fails to meet the required yield threshold and should be rejected or restructured.
- If IRR = Hurdle Rate, the project breaks even on an economic profit basis, adding no net value.
Limitations and Pitfalls of IRR in Project Management
While IRR is robust, relying on it blindly without understanding its structural limitations can result in poor project selection and stranded assets.
1. The Reinvestment Assumption Flaw
The mathematical engine behind IRR assumes that all intermediate cash inflows generated throughout the project are reinvested at the exact same rate as the IRR itself. If a project has an unusually high IRR of 45%, the formula assumes the organization can continuously reinvest cash inflows at that same 45% yield—which is frequently unrealistic in standard market conditions. To counter this, advanced financial analysts often use the Modified Internal Rate of Return (MIRR), which allows managers to specify a realistic reinvestment rate for positive cash flows.
2. Unconventional Cash Flows and Multiple IRRs
When a project has standard cash flows—one large initial cash outflow followed exclusively by positive inflows—there is only one real solution for IRR. However, complex infrastructure or long-term construction projects often feature intermittent cash outflows (e.g., major mid-project overhauls, environmental remediation, or deferred capital expenditures). When cash flows switch signs multiple times (negative to positive, then back to negative), Descartes' rule of signs dictates that the equation can yield multiple IRRs, rendering the metric mathematically ambiguous and practically useless.
3. Scale Blindness
IRR measures efficiency as a percentage, not absolute value creation. Consider two mutually exclusive projects:
- Project A: Initial cost of $10,000 with an IRR of 35% ($3,500 return).
- Project B: Initial cost of $1,000,000 with an IRR of 18% ($180,000 return).
While Project A has a superior IRR percentage, Project B generates vastly more total wealth for the enterprise. Selecting projects based strictly on high IRR percentages while ignoring project scale can lead to under-investing in high-impact corporate growth.
Best Practices for Integrating IRR into Project Governance
To maximize the utility of IRR while mitigating its risks, project management offices and portfolio directors should establish standardized governance protocols.
- Pair IRR with NPV: Never evaluate a project using IRR in isolation. Always pair it with Net Present Value to understand both percentage efficiency and absolute dollar returns.
- Standardize Hurdle Rates: Ensure that the finance department provides a clear, consistent hurdle rate that reflects current macroeconomic conditions, inflation, and borrowing costs.
- Account for Risk and Uncertainty: Because cash flow projections are estimates, run sensitivity analyses and Monte Carlo simulations on the cash flow inputs before calculating project IRR.
- Audit Cash Flow Timelines: Ensure that project managers do not manipulate cash flow timing (hockey-stick forecasting) to artificially inflate early-year returns and drive up the IRR.
Frequently Asked Questions
What is a good internal rate of return for a project?
A "good" IRR is entirely relative to an organization's cost of capital, industry sector, and risk appetite. Generally, any project where the IRR comfortably exceeds the company's Weighted Average Cost of Capital (WACC)—plus a risk premium—is considered financially viable. In high-risk venture settings, hurdle rates and expected IRRs may exceed 20% to 30%, whereas stable infrastructure projects might target a healthy 8% to 12%.
How does IRR differ from ROI?
While both measure financial returns as percentages, Return on Investment (ROI) calculates the total net profit divided by the initial investment cost without factoring in the duration of the project. Conversely, IRR incorporates the time value of money, discounting future cash flows so that multi-year projects can be evaluated accurately based on when cash is actually received or spent.
Can IRR be negative?
Yes. An IRR will be negative if the total present value of cash inflows is less than the initial capital expenditure required to launch the project. A negative IRR indicates that the project will lose money over its lifecycle and fail to return the principal investment.
What should I do if a project yields multiple IRRs?
Multiple IRRs occur when a project experiences alternating cash flow signs (positive and negative inflows throughout its lifecycle). When this happens, standard IRR software functions become unreliable. Project managers should pivot to using Net Present Value (NPV) analysis or calculate the Modified Internal Rate of Return (MIRR), which resolves sign-change anomalies by explicitly separating financing costs from reinvestment returns.
Who is responsible for calculating IRR in project management?
While enterprise project managers build and maintain business cases, the formal calculation and validation of financial metrics like IRR, NPV, and payback periods are typically performed in collaboration with the corporate finance department, financial controllers, or specialized Project Management Office (PMO) analysts.
Next Steps for Project Leaders
To incorporate IRR effectively into your current project management practices, begin by reviewing your organization's existing business case templates. Ensure that capital expenditure requests require structured cash flow forecasts rather than static revenue estimates. Partner with your finance team to establish clear hurdle rates for different project tiers, and incorporate MIRR alongside standard IRR for long-term initiatives with complex, multi-phase funding requirements.
Image Gallery
Select an image to open it in a new tab.
Mateo Castillo
Decentralized Finance and E-Payments Strategist
