
The arithmetic mean is the sum of all values divided by the count of values, making it ideal for standard additive data, while the geometric mean is the n-th root of the product of n numbers, which is essential for calculating average growth rates, percentages, and skewed data distributions. Selecting the correct measure prevents significant misinterpretation of financial performance, scientific data, and historical trends.
Understanding the Arithmetic Mean
The arithmetic mean, often referred to simply as "the average," is the most common measure of central tendency used in general statistical analysis. It is calculated by taking the sum of a dataset’s values and dividing that total by the number of observations. In mathematical notation, for a set of values $x_1, x_2, ..., x_n$, the arithmetic mean ($\bar{x}$) is defined as:
$\bar{x} = \frac{\sum_{i=1}^{n} x_i}{n}$
When the Arithmetic Mean Excels
The arithmetic mean is best suited for scenarios where the data points are additive and not heavily influenced by outliers or extreme fluctuations. It provides a clear, intuitive center point for symmetric distributions. For instance, if you are measuring the height of students in a classroom or the daily temperature in a specific city, the arithmetic mean offers a reliable representation of the "typical" value. Because it is easy to calculate and intuitively understood by the general public, it remains the standard for reporting in social sciences, public policy, and simple descriptive statistics.
The Vulnerability of the Arithmetic Mean
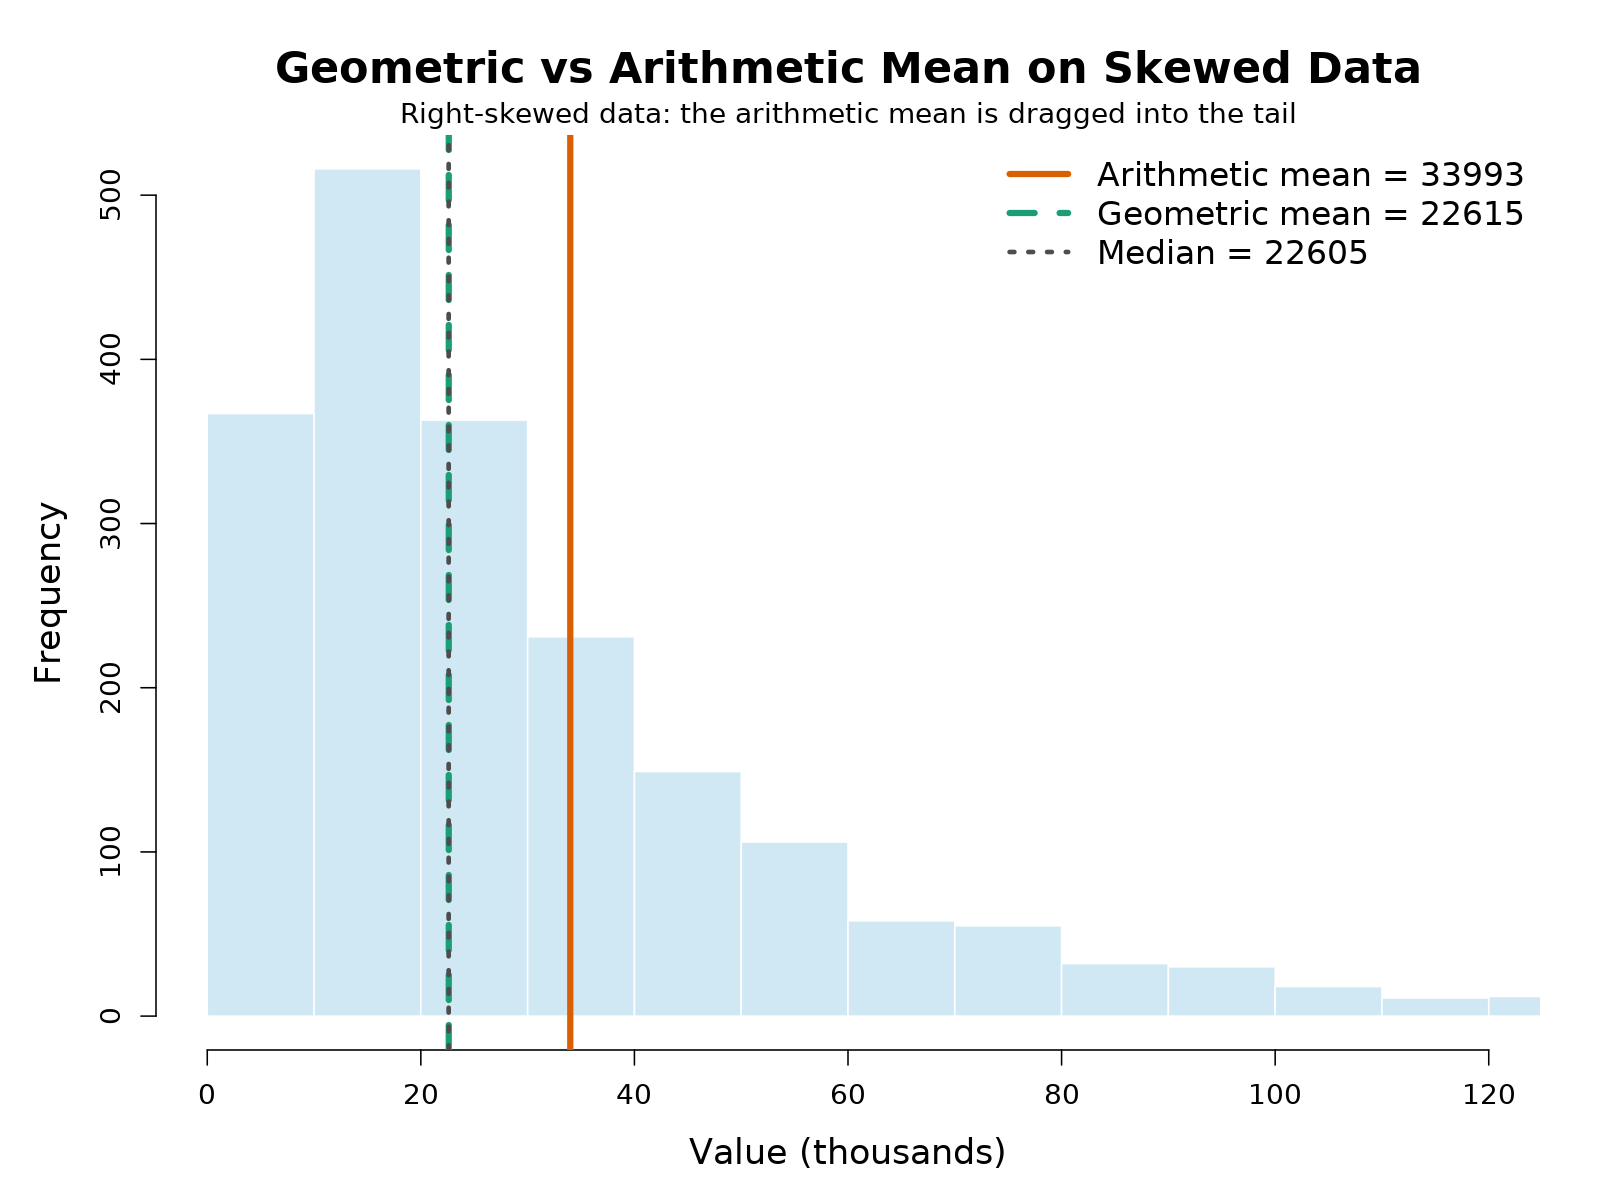
Despite its ubiquity, the arithmetic mean is highly sensitive to extreme values. A single outlier—an extremely high or low number—can disproportionately skew the mean, pulling it away from the actual "center" of the data. In datasets where values cover several orders of magnitude, the arithmetic mean can provide a misleading impression of the underlying reality. This is why financial analysts and data scientists often turn to the geometric mean when dealing with percentage-based data or compounding growth.
Exploring the Geometric Mean
The geometric mean is a type of average that indicates the central tendency of a set of numbers by using the product of their values rather than their sum. It is defined as the $n$-th root of the product of $n$ numbers. For a set of values $x_1, x_2, ..., x_n$, the geometric mean ($G$) is expressed as:
$G = \sqrt[n]{x_1 \cdot x_2 \cdot ... \cdot x_n}$
The Role of Compounding and Ratios
The primary domain of the geometric mean is the analysis of phenomena that change over time, specifically those involving compounding or multiplicative effects. If you are analyzing investment returns, population growth, or bacterial colony expansion, the geometric mean is mathematically superior to the arithmetic mean.
Consider an investment that grows by 10% in the first year and drops by 10% in the second year. If you use the arithmetic mean of the returns (+10% and -10%), you would conclude the average return is 0%. However, the actual value of your investment after two years would be: $1.10 \times 0.90 = 0.99$, a 1% loss. The geometric mean correctly accounts for the compounding nature of these figures, providing a more accurate reflection of the total performance.
Essential Prerequisites for the Geometric Mean
Unlike the arithmetic mean, the geometric mean has strict mathematical requirements:
- Positivity: All values in the dataset must be positive. Because the geometric mean involves the product of numbers, a negative value would lead to an undefined or complex number (if there is an even count of negative values).
- Homogeneity: The data should be multiplicative or proportional in nature.
- Logarithmic Transformation: In practice, for large datasets, the geometric mean is often calculated by taking the arithmetic mean of the logarithms of the numbers and then exponentiating the result. This simplifies the math and prevents numerical overflow.

Geometric Mean vs Mean: A Comparative Analysis
Choosing between these two measures requires a clear understanding of the data structure and the specific question you are trying to answer. The following table provides a breakdown of their primary differences and optimal application environments.
| Feature | Arithmetic Mean | Geometric Mean |
|---|---|---|
| Calculation Method | Sum of values divided by count | $n$-th root of the product of values |
| Mathematical Basis | Additive processes | Multiplicative/Compounding processes |
| Outlier Sensitivity | High (skewed by extreme values) | Low (less influenced by outliers) |
| Core Application | General descriptive statistics | Growth rates, ROI, index numbers |
| Data Requirements | Any real number | Must be positive numbers |
Impact of Outliers
The arithmetic mean is a "linear" estimator. If you have a dataset of incomes and one individual earns a billion dollars while the rest earn $50,000, the arithmetic mean will skyrocket, failing to describe the experience of the average person. The geometric mean, by compressing the scale, provides a more stable measure that better reflects the central tendency of skewed distributions.
Practical Implications for Decision Making
In professional environments—such as portfolio management or environmental engineering—choosing the wrong mean can lead to costly strategic errors. If an analyst uses the arithmetic mean to estimate the long-term growth of a fund, they will consistently overestimate the final wealth, leading to poor capital allocation. Conversely, in engineering, using the arithmetic mean to average sound pressure levels or chemical concentrations can lead to underestimating exposure risks, as the arithmetic mean often ignores the "weight" of multiplicative shifts in concentration.
Common Mistakes and Misconceptions
One of the most frequent errors in statistical reporting is the "arithmetic assumption." This occurs when an analyst treats percentage changes as additive integers. If a project experiences a 20% improvement followed by a 20% decline, the net result is not zero—it is a 4% decline ($1.20 \times 0.80 = 0.96$). Using the arithmetic mean in this context suggests that the average performance was "neutral," which creates a false sense of security regarding stability.
Another mistake is applying the geometric mean to data where it is not mathematically sound, such as simple additive measurements like shoe sizes or test scores. Applying the geometric mean here would compress the data in a way that loses its physical or practical meaning. Always identify whether your data represents an "amount" (arithmetic) or a "rate" (geometric).
Frequently Asked Questions
Which mean is always smaller?
Mathematically, the geometric mean is always less than or equal to the arithmetic mean for any set of positive numbers. They are only equal if all the numbers in the dataset are identical. This property, known as the AM-GM inequality, is a fundamental pillar of optimization theory.
Can I use the geometric mean for negative numbers?
No. Because the geometric mean involves the product of the values, the presence of negative numbers makes the calculation problematic. If your data contains negative values, you must either shift the data (by adding a constant) or use a different statistical approach, such as the median, which is more robust against outliers and doesn't rely on multiplicative logic.
When should I use the median instead?
The median—the middle value of a sorted dataset—should be used when your data is highly skewed and you want a measure that is entirely unaffected by the magnitude of extreme outliers. While the geometric mean is useful for rates, the median is the best choice for reporting income, house prices, or any dataset where the "typical" observation is the priority over the mathematical average.
Why does the geometric mean matter for investors?
It matters because it represents the "time-weighted return." When you invest money, losses take a larger percentage of your remaining capital than gains add to it. A 50% loss followed by a 50% gain does not bring you back to your starting point; it leaves you at 75% of your original investment. The geometric mean is the only way to accurately calculate the actual value change over time.
How do I calculate the geometric mean in spreadsheet software?
In 2026, standard spreadsheet tools like Excel and Google Sheets offer built-in functions. You can use the =GEOMEAN(range) function to quickly calculate the geometric mean for a column of data. Ensure that all values in your range are positive; otherwise, the function will return a calculation error.
Strategic Recommendation
If you are performing data analysis, first classify your variables based on their origin. If you are dealing with additive quantities—such as physical dimensions, counts of units, or simple scores—stick to the arithmetic mean. If you are calculating performance metrics, growth rates, or any figure involving percentage changes over time, utilize the geometric mean to maintain mathematical integrity. Always verify your dataset for positivity before applying the geometric mean to ensure your results are not just theoretically sound, but practically accurate for your stakeholders.
Image Gallery
Select an image to open it in a new tab.




Omar Farooq
EdTech Innovation and Virtual Pedagogy Journalist
