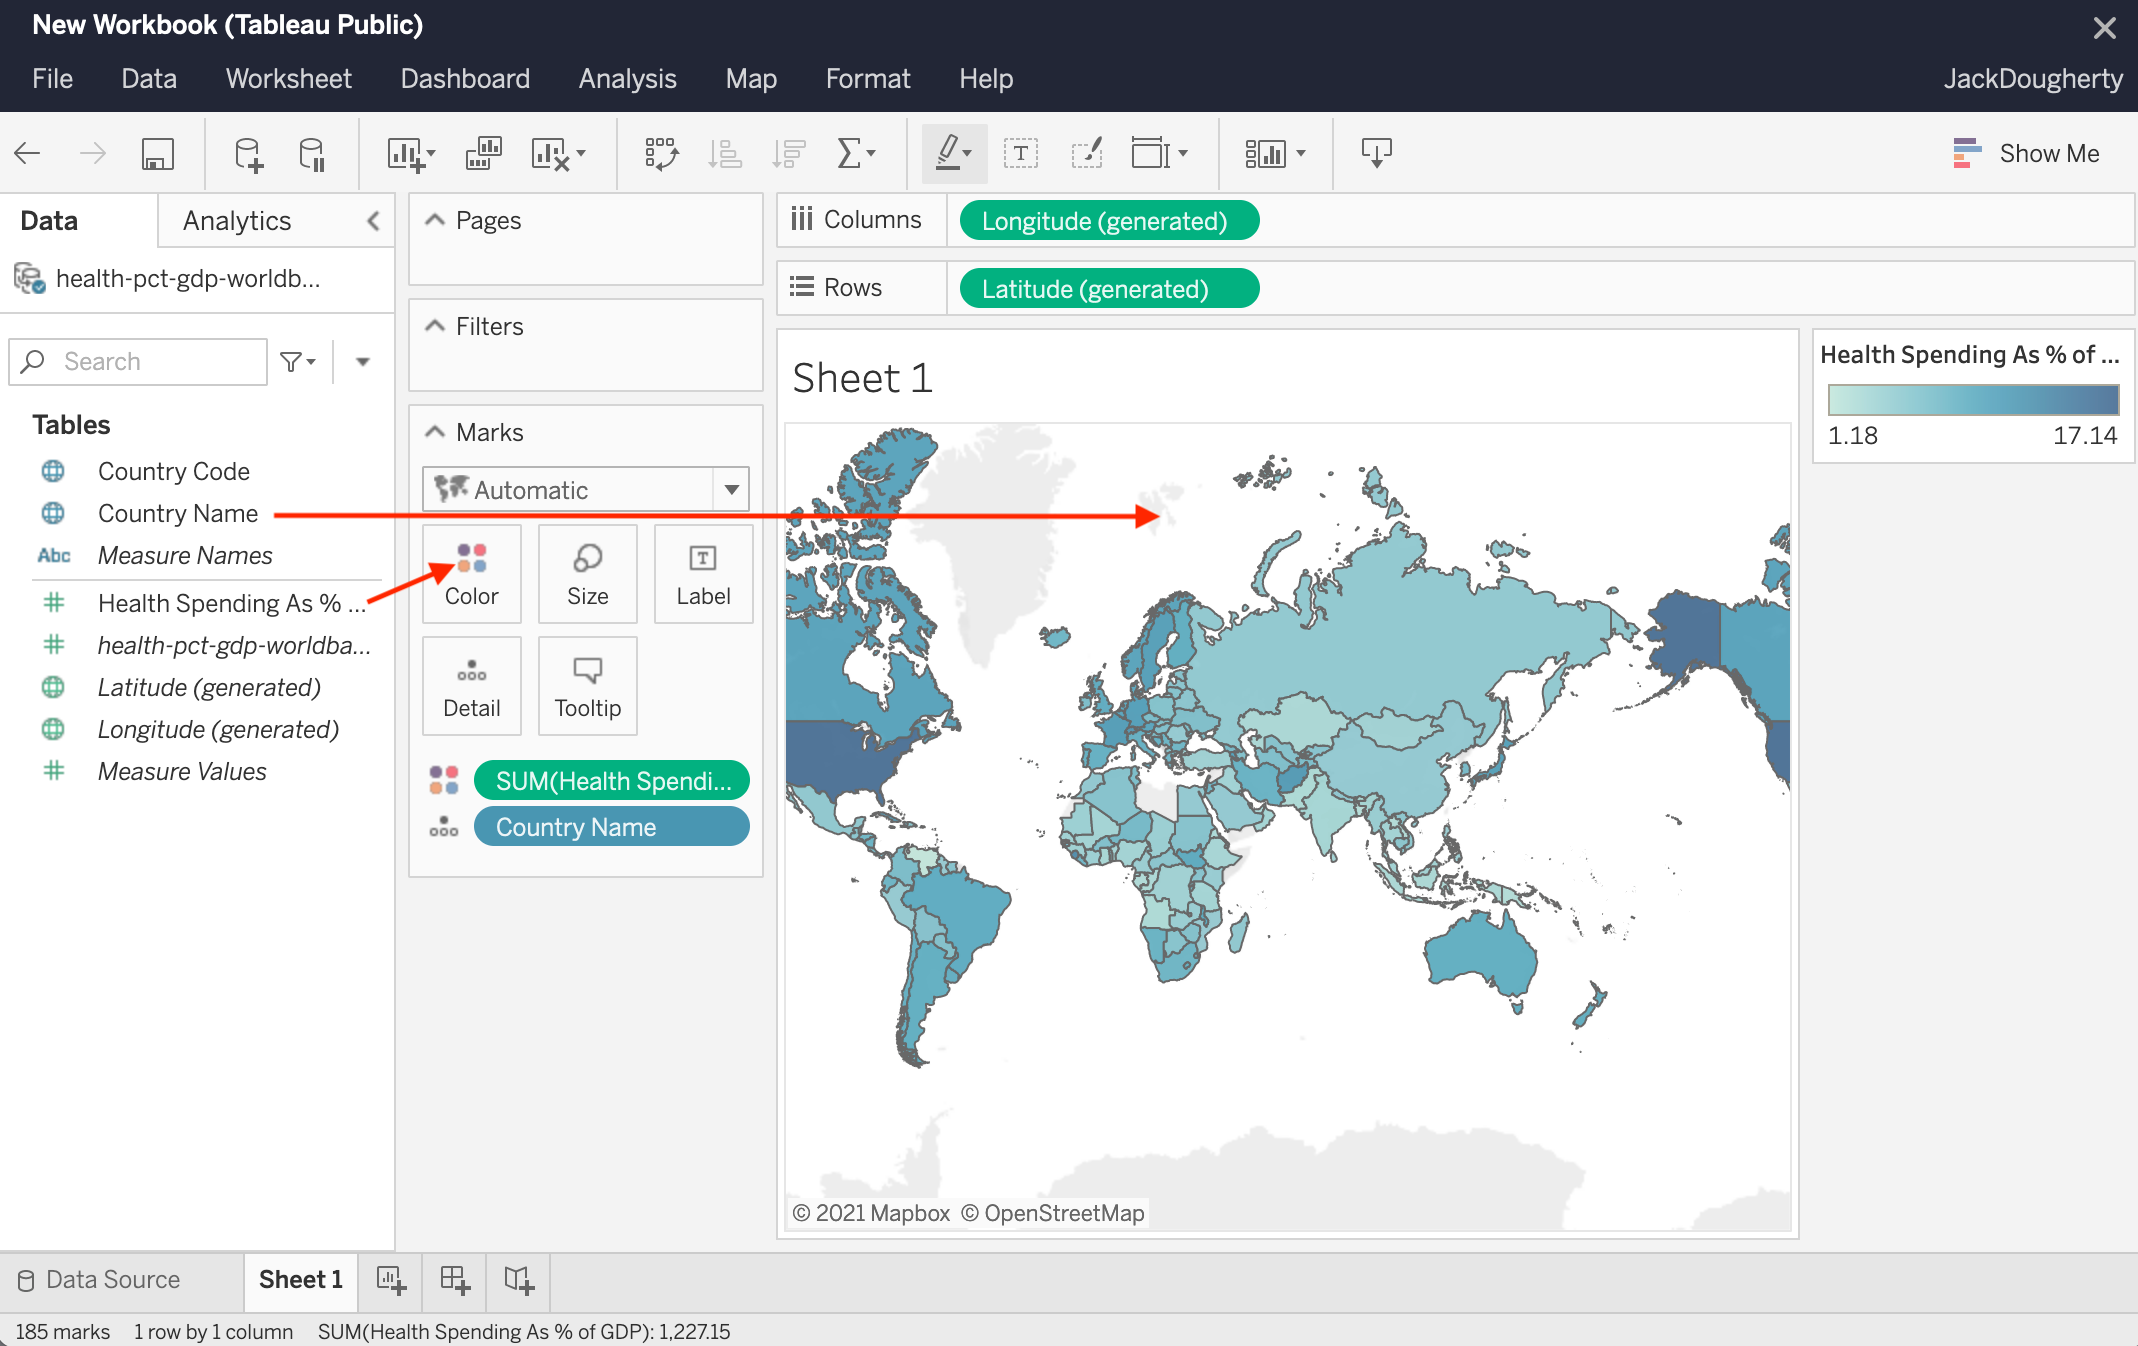
A Tableau map chart transforms complex geographic data into intuitive visual narratives by plotting spatial coordinates or administrative boundaries onto interactive backgrounds. To create one, you assign geographic roles to your data fields—such as City, State, or Latitude and Longitude—and drag them into the view, allowing Tableau to render points, polygons, or heat signatures that reveal regional trends and spatial patterns.
Geographic data visualization is a cornerstone of modern business intelligence, and as of 2026, Tableau remains the industry standard for translating location-based information into actionable insights. Whether you are analyzing global supply chain logistics, regional sales performance, or local demographic shifts, the ability to visualize data on a map provides a layer of context that standard bar or line charts cannot replicate. Maps answer the "where" of your data, helping stakeholders identify clusters, outliers, and spatial correlations that would otherwise remain hidden in a spreadsheet.
Understanding Geographic Roles and Data Requirements
Before dragging fields onto a canvas, it is essential to understand how Tableau interprets geographic data. Tableau does not simply "draw" a map; it matches your data against a vast internal database of geocodes or uses provided spatial coordinates to place marks accurately.
Internal Geocoding vs. External Coordinates
Tableau possesses an extensive built-in library of geographic roles. If your dataset contains names of common entities like countries, states, provinces, or postal codes, Tableau can automatically geocode these. By right-clicking a field and selecting Geographic Role, you tell the software how to interpret the string. For example, assigning "Zip Code" to a field allows Tableau to instantly find the center point (centroid) of that zip code.
However, internal geocoding has limits. It is generally restricted to administrative boundaries. For more granular visualization—such as the exact location of an IoT sensor or a specific storefront—you must provide Latitude and Longitude coordinates in your underlying data. When these numerical fields are present, Tableau bypasses its internal name-matching and plots the data with GPS-level precision.
Spatial Files
For advanced users in 2026, spatial files are the preferred method for complex mapping. Tableau supports various formats, including:
- Shapefiles (.shp): The industry standard for GIS (Geographic Information Systems).
- KML (.kml): Keyhole Markup Language, commonly used by Google Earth.
- GeoJSON (.json): A lightweight format favored for web-based spatial data.
- TopJSON: An extension of GeoJSON that encodes topology and reduces file size.
Using spatial files allows you to move beyond standard boundaries. You can map custom sales territories, watershed regions, or floor plans of buildings by defining custom polygons that Tableau treats as marks.
Primary Types of Tableau Map Charts
Choosing the right map type depends entirely on the question you are trying to answer. As of 2026, Tableau offers five primary mapping styles, each suited for different analytical needs.
1. Proportional Symbol Maps
Proportional symbol maps use marks (usually circles) placed at specific geographic points. The size and color of these marks represent quantitative values.
- Best Use Case: Visualizing the magnitude of a metric at specific locations, such as total sales per store.
- Advantage: They allow for the comparison of two metrics simultaneously—size for volume and color for profit margin.
2. Choropleth (Filled) Maps
In a choropleth map, geographic areas (polygons) are shaded or patterned in proportion to a measurement.
- Best Use Case: Showing ratios or aggregated data across defined regions, such as average household income by county or tax rates by country.
- Caution: These maps can be misleading because larger geographic areas naturally draw more visual attention, even if their data values are less significant than those of smaller, high-density areas.
3. Density (Heat) Maps
Density maps utilize a "heat" gradient to show the concentration of data points. Rather than looking at individual marks, you see where marks are most "crowded."
- Best Use Case: Visualizing "hot spots" in dense datasets, such as crime incidents in a city or foot traffic patterns in a mall.
- Advantage: They handle overlapping marks much better than symbol maps, providing a smooth visual representation of intensity.
4. Point Distribution Maps
These maps plot every single occurrence as a discrete mark on the map.
- Best Use Case: Identifying the specific location of events or assets, such as the position of every cell tower in a network or the occurrences of a rare bird sighting.
- Requirement: These require high-precision Latitude and Longitude data.
5. Flow and Spider Maps
Flow maps use lines to show the movement of objects or information from one location to another.
- Best Use Case: Supply chain routes, migration patterns, or hub-and-spoke distribution networks.
- Implementation: These typically require the
MAKELINEandMAKEPOINTfunctions in Tableau to connect origin and destination coordinates.

Step-by-Step: Creating a Standard Map in Tableau
Following a structured workflow ensures your map is both accurate and performant. Here is the standard process for building a geographic visualization in the 2026 version of Tableau Desktop or Tableau Cloud.
- Connect to Your Data: Ensure your data contains geographic fields. If you have "State" and "City," make sure they are categorized correctly in the Data Pane.
- Assign Geographic Roles: If Tableau hasn't automatically recognized your fields, right-click the dimension (e.g., "Postal Code"), select Geographic Role, and choose the appropriate category. A globe icon will appear next to the field name.
- Generate the Map: Double-click the geographic fields. Tableau will automatically place Latitude (generated) and Longitude (generated) on the Rows and Columns shelves.
- Choose Your Mark Type: On the Marks Card, change the mark type from "Automatic" to "Map" for a filled choropleth, or "Circle" for a symbol map.
- Encode Data with Color and Size: Drag a measure (like "Sales") onto Color or Size on the Marks Card. For filled maps, only Color is applicable.
- Refine the Background: Go to the Map menu at the top and select Background Layers. Here you can choose styles like Satellite, Outdoors, or Dark, and toggle layers like streets, terrain, or water bodies to provide context without cluttering the view.
Strategic Comparison of Mapping Techniques
| Map Type | Best For | Data Requirement | Visual Strength |
|---|---|---|---|
| Symbol Map | Comparing magnitudes at specific points | Lat/Long or City/Zip | High precision; shows two metrics (Size/Color) |
| Filled Map | Aggregated regional data (Ratios) | Administrative Boundaries | Clear regional boundaries; high visual impact |
| Density Map | Concentration and Hotspots | High-volume point data | Smooths "noise"; identifies clusters |
| Flow Map | Path and movement analysis | Origin & Destination Lat/Long | Shows direction and connectivity |
| Custom Spatial | Non-standard boundaries | .shp, .kml, or GeoJSON | Absolute flexibility for niche industries |
Advanced Features: Map Layers and Spatial Functions
In recent iterations of Tableau, the introduction of Map Layers has revolutionized how geographic data is visualized. Previously, users were limited to "Dual Axis" maps, which allowed for only two layers of data. Now, you can add an unlimited number of marks layers to a single map.
Utilizing Map Layers
To add a layer, simply drag a geographic field onto the view. A "Add a Marks Layer" drop-zone will appear in the top-left corner of the map. This allows you to, for example:
- Layer 1: A filled map showing state-level sales.
- Layer 2: A symbol map showing individual store locations.
- Layer 3: A buffer zone (using the
BUFFERfunction) showing a 50-mile radius around distribution centers.
Spatial Functions for Deep Analysis
Tableau's calculation engine includes specific functions designed for spatial math:
- MAKEPOINT(Lat, Long): Converts coordinates into a spatial object.
- MAKELINE(Point A, Point B): Draws a line between two spatial points.
- BUFFER(Point, Distance, 'Unit'): Creates a circular polygon around a point. This is invaluable for "proximity analysis," such as determining how many customers live within 10 miles of a new retail location.
- DISTANCE(Point A, Point B, 'Unit'): Calculates the literal distance between two points, useful for logistics and shipping cost estimations.
Troubleshooting Common Mapping Issues
Even experienced analysts encounter hurdles when mapping geographic data. Addressing these early prevents the dissemination of inaccurate information.
The "Unknown" Locations Notification
The most common error is a small indicator in the bottom-right corner of the map saying "X unknown." This happens when Tableau cannot find a match for a location name (e.g., a misspelled city or a zip code that doesn't exist in the database).
- Solution: Click the indicator and select Edit Locations. You can manually map the unrecognized names to the correct entities or provide specific Latitude/Longitude coordinates for those rows.
Ambiguous Locations
If you have a city named "Springfield," Tableau may not know which one to plot, as there are many in the United States.
- Solution: Always include a higher level of geographic hierarchy in your view. Adding "State" to the Detail on the Marks Card tells Tableau exactly which Springfield to use.
Coordinate Misplacement
Sometimes maps appear "flipped" or data points end up in the middle of the ocean.
- Solution: Check that your Latitude and Longitude fields aren't swapped. Latitude represents North/South (Y-axis), while Longitude represents East/West (X-axis). In Tableau, Longitude goes on the Columns shelf and Latitude goes on the Rows shelf.
Optimizing Map Performance
Maps can be resource-intensive, especially when dealing with millions of points or complex spatial files with thousands of vertices.
- Use Extracts: Always use Tableau Data Extracts (.hyper) for mapping. They are optimized for spatial queries and significantly outperform live connections to traditional databases.
- Simplify Geometry: If using custom shapefiles, use tools like Mapshaper to reduce the number of vertices in your polygons. High-resolution boundaries often add detail that is invisible at the dashboard level but slows down rendering.
- Filter Aggressively: Don't load global data if the user only needs to see one region. Use context filters to limit the data sent to the mapping engine.
- Zoom Levels: Set appropriate zoom levels. If you are showing state-level data, disable the user's ability to zoom into street levels where the data is no longer relevant.
Frequently Asked Questions
Can Tableau map data outside of the United States?
Yes. Tableau supports global geographic data, including countries, regions, provinces, and postal codes for most nations. For areas where internal geocoding is less detailed, you can always use Latitude/Longitude or provide a custom GeoJSON file for that specific country’s administrative levels.
How do I use custom icons on a map?
In a symbol map, change the Mark type to Shape. You can then drag a dimension to the Shape card. To use custom brand icons or specific imagery, save your image files in the "My Tableau Repository/Shapes" folder on your computer. After reloading shapes in Tableau, you can assign these custom images to your geographic points.
Is it possible to map indoor spaces like floor plans?
Yes, though it requires a different approach. You can use a custom background image (a JPG or PNG of the floor plan) and then map X and Y coordinates to it. Alternatively, if you have a spatial file (like a KML) representing the rooms and hallways, you can treat it as a standard spatial map.
How do I integrate Mapbox with Tableau?
Tableau allows you to replace the default background maps with custom styles from Mapbox. Under Map > Background Maps > Add Mapbox Map, you can enter your Mapbox API token and the URL of the style you created. This is excellent for branding or for using specialized layers like satellite imagery with high-resolution topographic data.
Can I perform spatial joins in Tableau?
Yes. In the Data Source tab, you can join two datasets based on their spatial relationship (e.g., where a point "Intersects" with a polygon). This allows you to count how many individual incidents (points) occurred within specific sales territories (polygons) without having a shared ID between the two datasets.
Practical Recommendation for Next Actions
To master Tableau map charts, begin by auditing your current data for geographic depth. If you rely solely on city names, consider enriching your dataset with precise Latitude and Longitude to unlock density maps and spatial functions. For your next project, try using the Map Layers feature to overlay two different data sources—such as layering "Customer Locations" (points) over "Market Saturation" (filled polygons). This multi-layered approach provides the context necessary for high-stakes decision-making in 2026's data-driven landscape.
Image Gallery
Select an image to open it in a new tab.
Lars Thomsen
Global Labor Markets and Economic Strategy Editor
