Understanding What It Means to Accept the Null Hypothesis in Statistical Testing
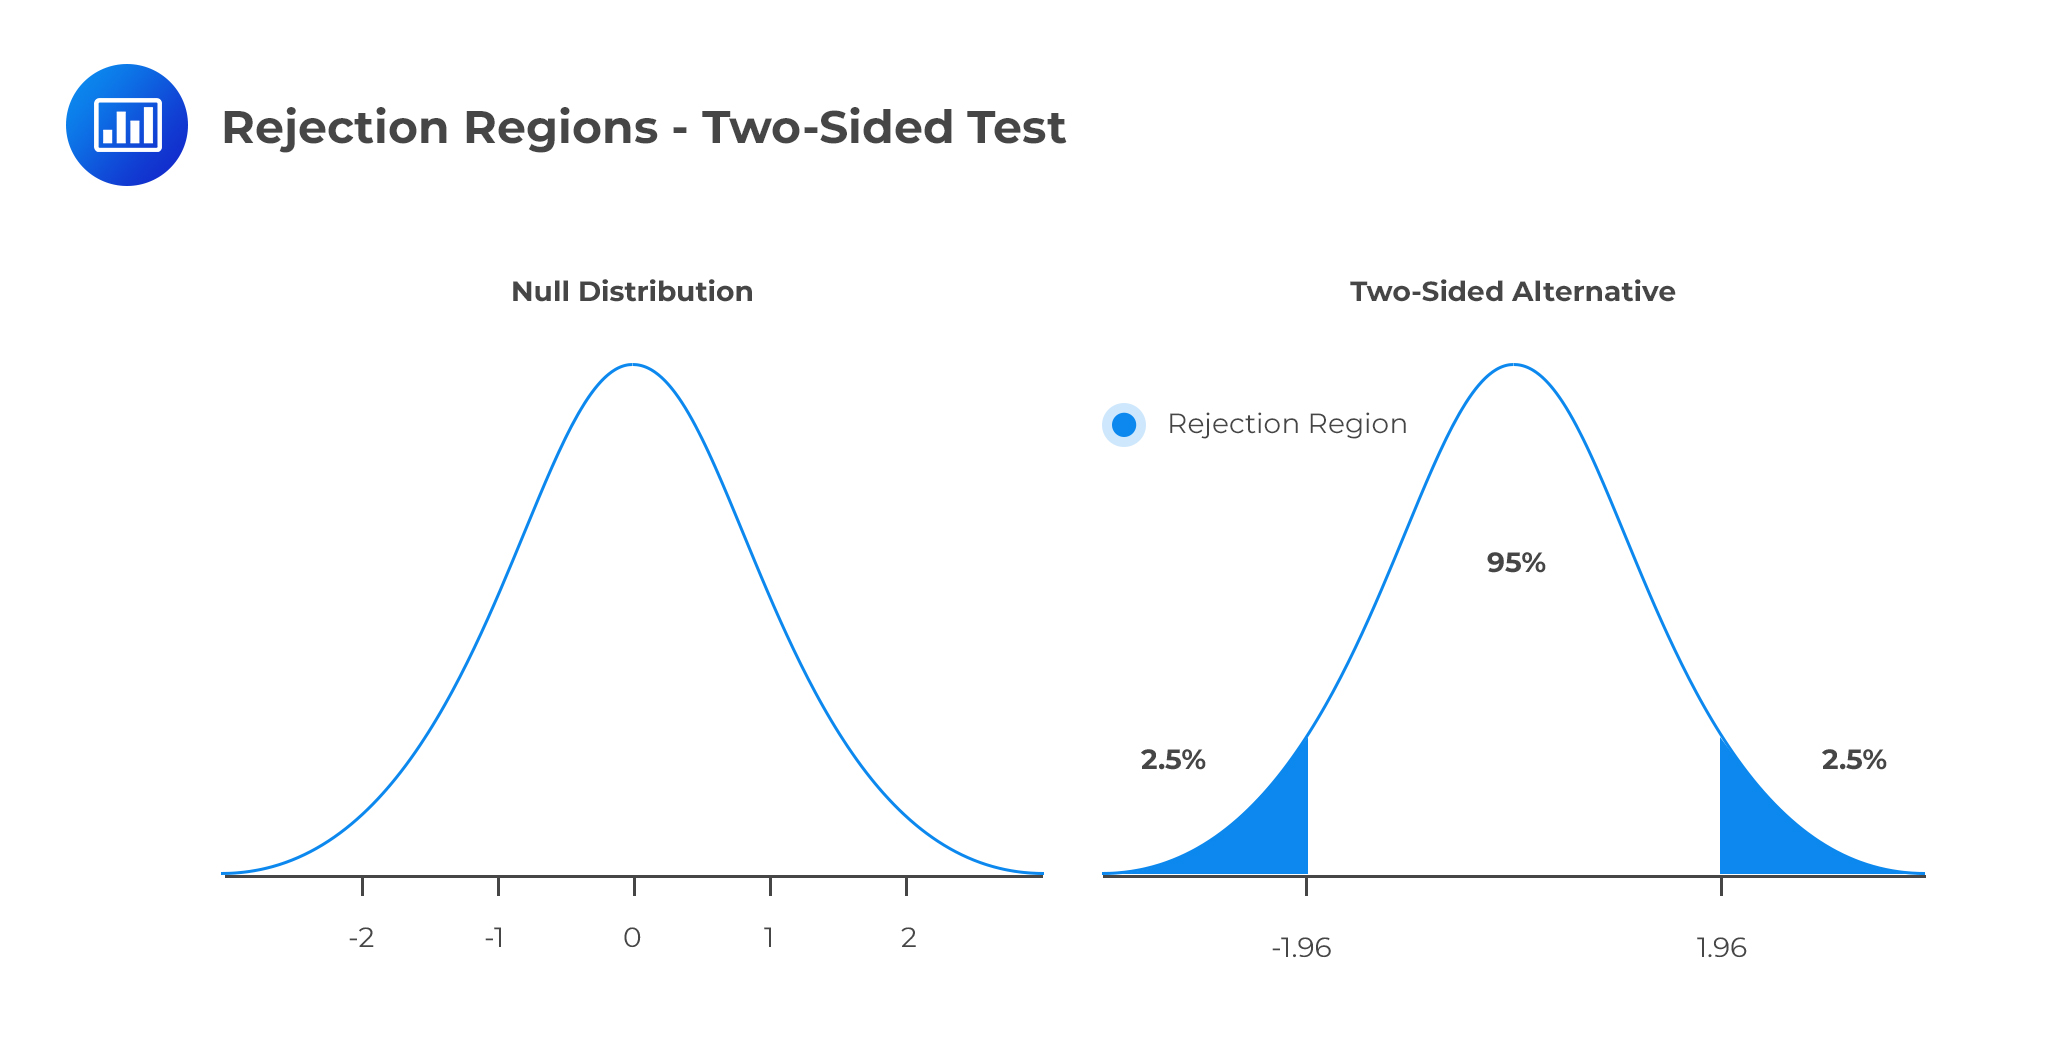
In classical inferential statistics, accepting or failing to reject the null hypothesis means that the data collected during an experiment or study do not provide sufficient statistical evidence to conclude that a true effect, relationship, or difference exists in the broader population. Rather than proving the null hypothesis is true, this outcome indicates that any observed variations or sample differences are likely attributable to random chance, sampling variability, or measurement error.
To fully understand this foundational concept, one must look beyond basic textbook definitions and explore how hypothesis testing operates in real-world research environments. Statistical analysis rarely deals in absolute certainties. Instead, it evaluates probabilities, weighing the likelihood of observing specific data under a default assumption against an alternative theory.
Navigating this process requires careful attention to experimental design, error rates, and the subtle yet crucial distinction between failing to reject a hypothesis and declaring it definitively correct.
The Conceptual Foundation of Hypothesis Testing
Hypothesis testing provides a structured mathematical framework for making decisions using experimental data. Every formal statistical test begins by establishing two competing propositions: the null hypothesis and the alternative hypothesis.
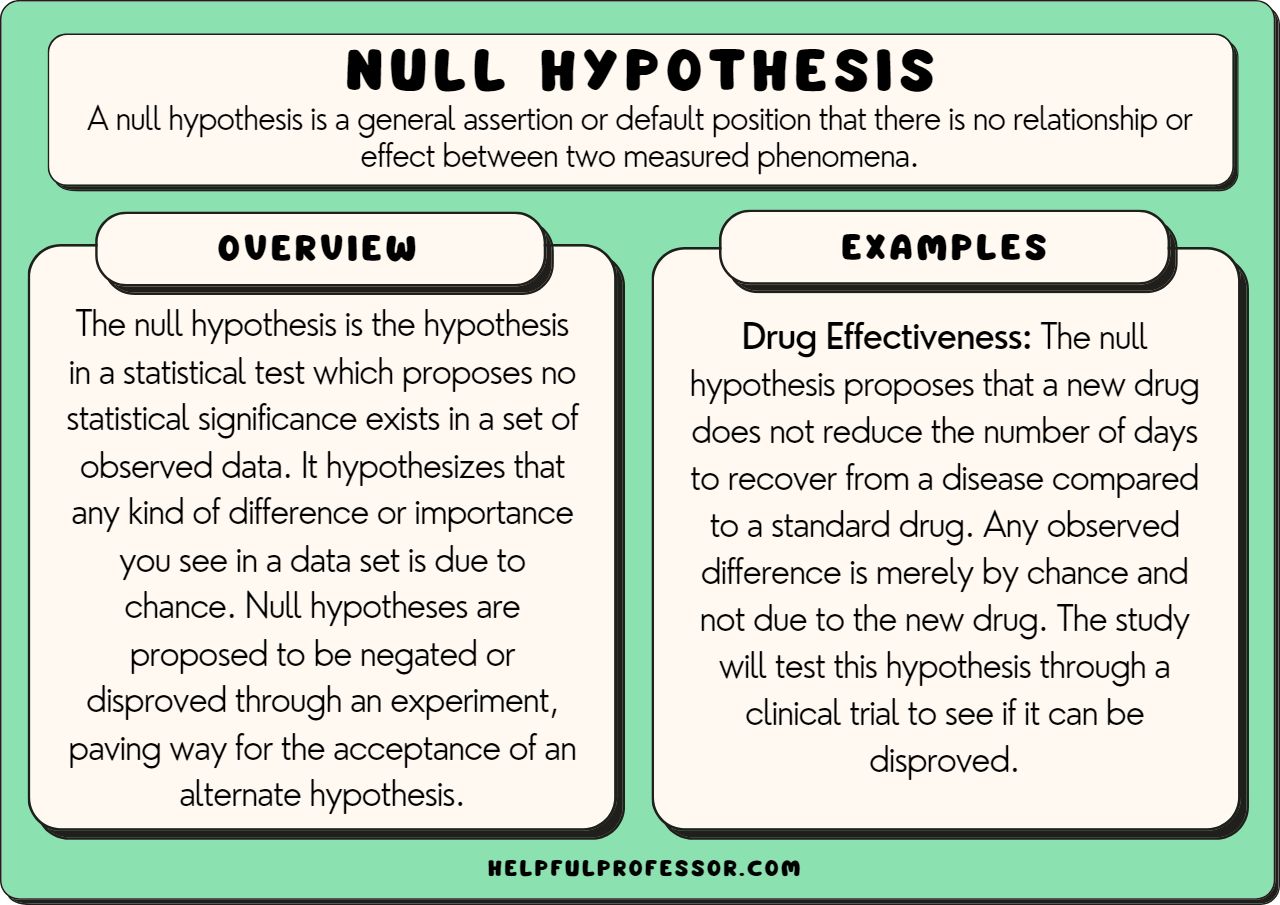
The null hypothesis, designated as $H_0$, represents the default position that there is no effect, no relationship, and no difference between groups or variables. It acts as the baseline assumption, mirroring the legal principle of presuming innocence until proven guilty.
Conversely, the alternative hypothesis, designated as $H_1$ or $H_a$, proposes that a specific effect, relationship, or difference does exist within the population. Researchers typically design studies because they suspect the alternative hypothesis is true, but they must test it by attempting to dismantle or discredit the null hypothesis.
The Role of Probability and Sampling
When researchers collect data, they almost always examine a sample rather than an entire population. Because samples are subject to random variation, two groups drawn from the exact same population will almost never produce identical mean values.
Statistical tests calculate the probability—known as the $p$-value—of obtaining the observed sample results (or more extreme results) assuming that the null hypothesis is entirely true. If this probability falls below a pre-determined threshold, researchers reject the null hypothesis. If the probability is high, researchers fail to reject it.
Terminological Nuance: Accepting Versus Failing to Reject
A common point of confusion among students and early-career researchers involves the linguistic distinction between "accepting" the null hypothesis and "failing to reject" it. While many practitioners use the phrases interchangeably in casual conversation, strict frequentist statistics draws a sharp theoretical line between the two.
Why Frequentist Statistics Avoids Proof
In frequentist inference, tests are designed to falsify the null hypothesis, not to verify it. Failing to reject $H_0$ does not mean the null hypothesis has been proven true; it merely means the data lack the statistical power or the magnitude of effect required to discredit it.
Imagine testing a new pharmaceutical drug designed to lower blood pressure. If a clinical trial yields a $p$-value greater than the significance level, the researchers cannot conclude that the drug has zero effect. They can only conclude that the current study failed to demonstrate an effect that is distinguishable from random noise.
| Decision Term | Statistical Meaning | Practical Interpretation |
|---|---|---|
| Reject the Null | The $p$-value is below the significance threshold ($\alpha$). | Evidence supports the alternative hypothesis; the observed effect is statistically significant. |
| Fail to Reject the Null | The $p$-value exceeds the significance threshold ($\alpha$). | Evidence is insufficient to support the alternative hypothesis; the effect cannot be distinguished from chance. |
| Accept the Null | Informal terminology implying confirmation of the default state. | Technically incorrect in strict frequentist statistics, but often used informally to describe proceeding as if $H_0$ is true. |
Bayesian Alternatives
For researchers who wish to quantify the actual probability that a null hypothesis is true, frequentist methods often fall short. This limitation has popularized Bayesian hypothesis testing.
Unlike frequentist testing, Bayesian methods use Bayes' theorem to calculate Bayes factors, which allow researchers to directly evaluate the relative likelihood of both the null and alternative hypotheses given the observed data. In a Bayesian framework, one can indeed compute the probability that the null hypothesis is true, making "accepting" a more mathematically coherent concept within that specific paradigm.
Mechanics of the Decision Process
Executing a statistical test involves a rigid sequence of procedural steps designed to eliminate researcher bias and ensure reproducibility. Understanding these steps clarifies why a test ultimately leads to retaining the null hypothesis.
Setting the Significance Level ($\alpha$)
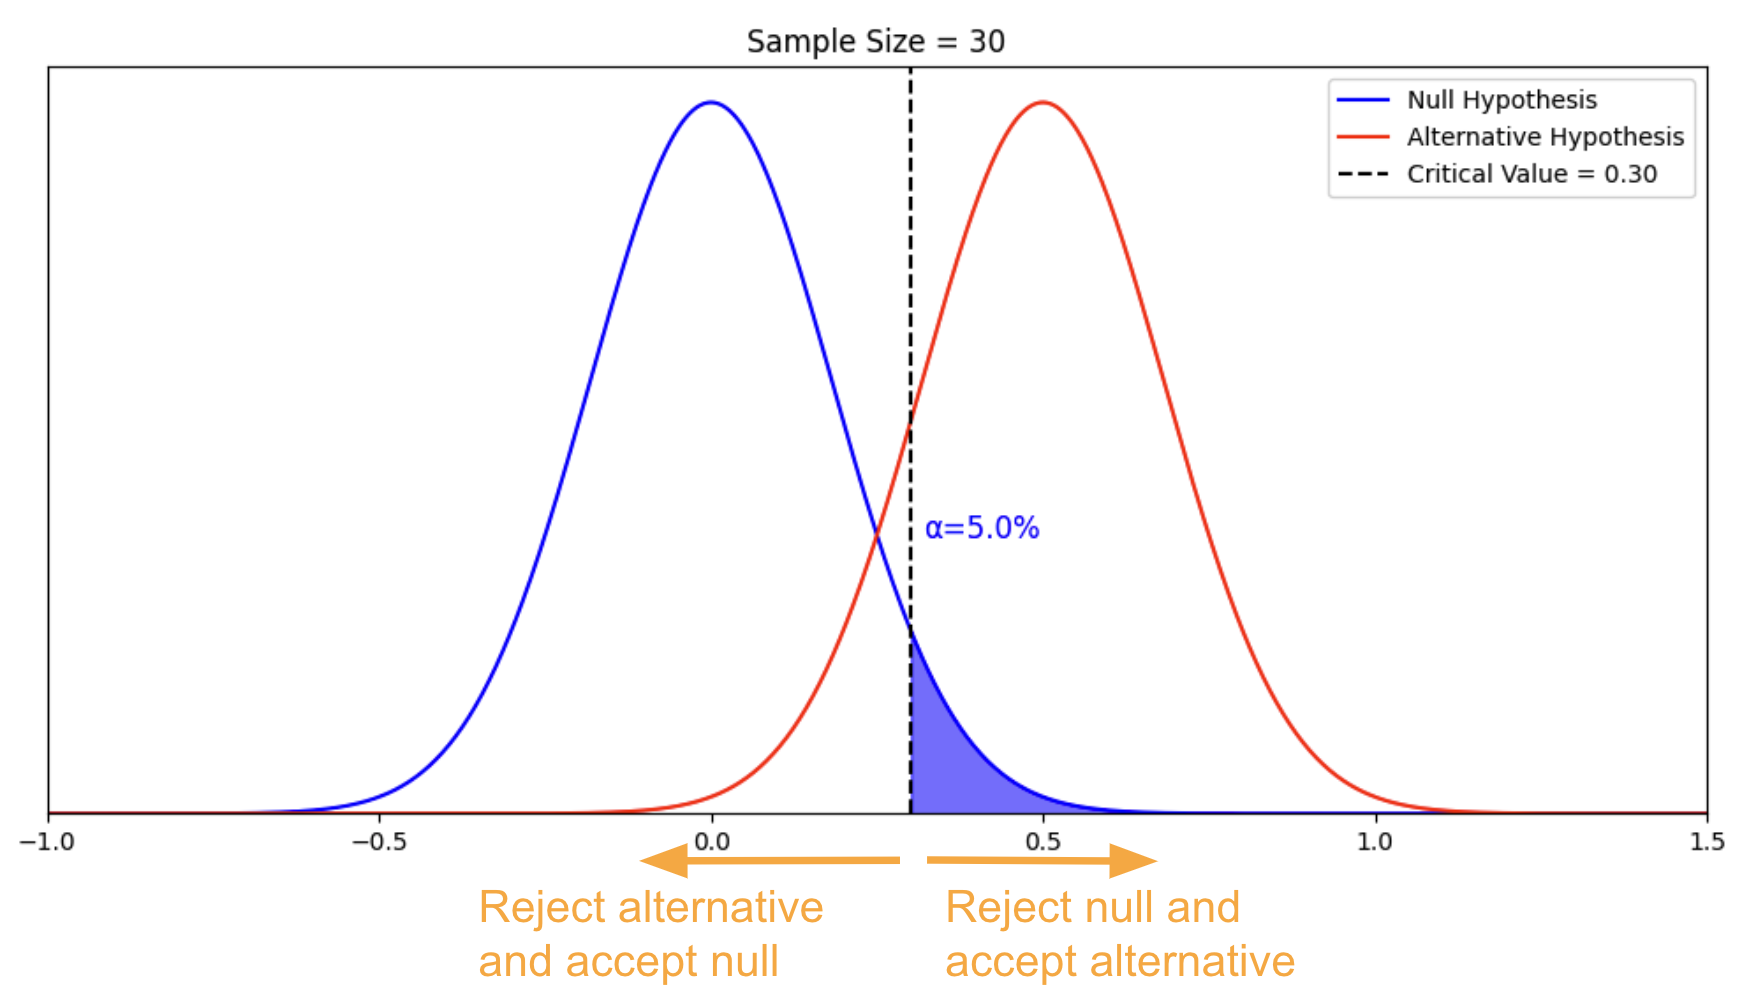
Before examining any data, a researcher must establish the significance level, denoted as $\alpha$ (alpha). Common choices are $0.05$ ($5%$), $0.01$ ($10%$), or $0.001$ ($0.1%$).
This value represents the maximum risk a researcher is willing to take of committing a Type I error—rejecting a null hypothesis that is actually true. If $\alpha$ is set to $0.05$, the researcher accepts a $5%$ risk of declaring a significant effect when none exists.
Calculating Test Statistics and $p$-Values
Once data collection is complete, the software or researcher computes a test statistic (such as a $t$-score, $z$-score, $F$-statistic, or chi-square value) based on the specific test being used. This test statistic is then converted into a $p$-value by referencing a theoretical probability distribution.
- If $p \le \alpha$: The result is deemed statistically significant. The researcher rejects the null hypothesis.
- If $p > \alpha$: The result is not statistically significant. The researcher fails to reject the null hypothesis.
Understanding Statistical Errors
Every decision made in hypothesis testing carries inherent risk because decisions are based on samples rather than exhaustive population measurements. Statisticians categorize these risks into two distinct error types.
| Error Type | Description | Probability Symbol | Real-World Consequence |
|---|---|---|---|
| Type I Error | Rejecting a true null hypothesis. | $\alpha$ (Alpha) | False positive; claiming an effect exists when it does not. |
| Type II Error | Failing to reject a false null hypothesis. | $\beta$ (Beta) | False negative; missing a real effect that actually exists. |
The Danger of Type II Errors When Retaining the Null
When a researcher fails to reject the null hypothesis, there is always a possibility of committing a Type II error. Several factors contribute to this risk:
- Small Sample Size: Inadequate sample sizes reduce statistical power, making it difficult to detect subtle differences even if they are genuinely present in the population.
- High Measurement Noise: Inaccurate instruments or poorly designed survey questions introduce high variance, masking true underlying signals.
- Overly Conservative Significance Levels: Setting $\alpha$ to an excessively strict level (e.g., $0.001$) decreases Type I errors but dramatically increases Type II errors.
Assessing statistical power—the probability of correctly rejecting a false null hypothesis ($1 - \beta$)—before conducting a study helps mitigate the risk of unwarranted retention of $H_0$.
Practical Scenarios Across Disciplines
The implications of failing to reject the null hypothesis vary significantly depending on the field of study.
Clinical Research and Pharmaceuticals
In clinical trials, the null hypothesis typically posits that an experimental treatment performs no better than a placebo or standard care. If a trial fails to reject the null hypothesis, the regulatory bodies, such as the U.S. Food and Drug Administration (FDA), will generally not approve the drug for that specific indication.
This outcome protects consumers from ineffective therapies, though it can represent a substantial financial loss for developers. For further reading on clinical trial standards, consult the guidelines provided by the U.S. Food and Drug Administration.
Quality Control and Manufacturing
In industrial manufacturing, the null hypothesis often states that a production line meets exact dimensional tolerances or purity standards. If quality control technicians fail to reject the null hypothesis, production continues uninterrupted.
However, if a sample indicates a deviation, rejecting the null hypothesis triggers a halt in production to investigate machinery calibration or raw material consistency.
Academic Research and Publication Bias
In academic publishing, studies that fail to reject the null hypothesis historically faced severe publication bias, often referred to as the "file-drawer effect." Journals favored studies showing significant positive results.
Modern scientific publishing increasingly values pre-registered studies and null results, recognizing that knowing what does not work is just as critical for scientific progress as knowing what does.
Common Misinterpretations and Pitfalls
Interpreting statistical output requires strict discipline to avoid common logical fallacies.
1. Assuming Absence of Effect Equals Proof of Zero
Failing to find evidence of an effect is not the same as finding evidence of the absence of an effect. A study might simply lack the statistical power required to detect a genuinely small, yet meaningful, phenomenon.
2. P-Hacking and Retrospective Justification
Researchers must never adjust their significance thresholds or alter hypotheses post hoc to achieve a desired outcome. Maintaining rigorous methodological integrity ensures that decisions regarding the null hypothesis remain valid and defensible.
Frequently Asked Questions
Does failing to reject the null hypothesis mean my hypothesis was wrong?
Not necessarily. It means your specific sample data did not provide enough evidence to support your alternative hypothesis. Your hypothesis might be correct, but the study may have suffered from a small sample size, high measurement error, or an effect size too small to detect with the current design.
What is the difference between statistical significance and practical significance?
Statistical significance indicates that an observed effect is unlikely to be the result of random chance alone. Practical significance evaluates whether the magnitude of that effect is large enough to matter in a real-world, operational, or clinical context. A study with a massive sample size can yield a statistically significant result that has virtually no practical importance.
Can a hypothesis test prove that the null hypothesis is true?
No. Frequentist hypothesis testing cannot prove a null hypothesis is true. It can only provide or withhold evidence against it. To establish positive evidence in favor of a null hypothesis, researchers typically employ equivalence testing or Bayesian methods that specifically test for negligible effect sizes.
Why do some statisticians object to the phrase "accept the null"?
Strict frequentist statisticians object because data can never verify a universal default claim; data can only fail to disprove it. Using the word "accept" implies a level of certainty and positive proof that frequentist tests are not mathematically equipped to provide.
How does sample size affect the decision to retain the null hypothesis?
Larger sample sizes increase statistical power, making it easier to detect even minor differences between groups. Conversely, small sample sizes inflate the likelihood of a Type II error, often forcing researchers to retain a null hypothesis even when a true effect exists.
Conclusion and Next Actions
When a statistical analysis results in failing to reject the null hypothesis, researchers should resist the temptation to view the study as a complete failure. Instead, they should evaluate the study's statistical power, review measurement precision, and examine whether confounding variables obscured a true relationship.
For practitioners planning new studies, the best next action is to conduct a thorough priori power analysis to determine the exact sample size needed to detect meaningful effect sizes, thereby minimizing ambiguity in future hypothesis tests.
Image Gallery
Select an image to open it in a new tab.


Lars Thomsen
Global Labor Markets and Economic Strategy Editor
