Understanding the Signal Transduction Pathway Diagram: A Comprehensive Guide to Cellular Communication
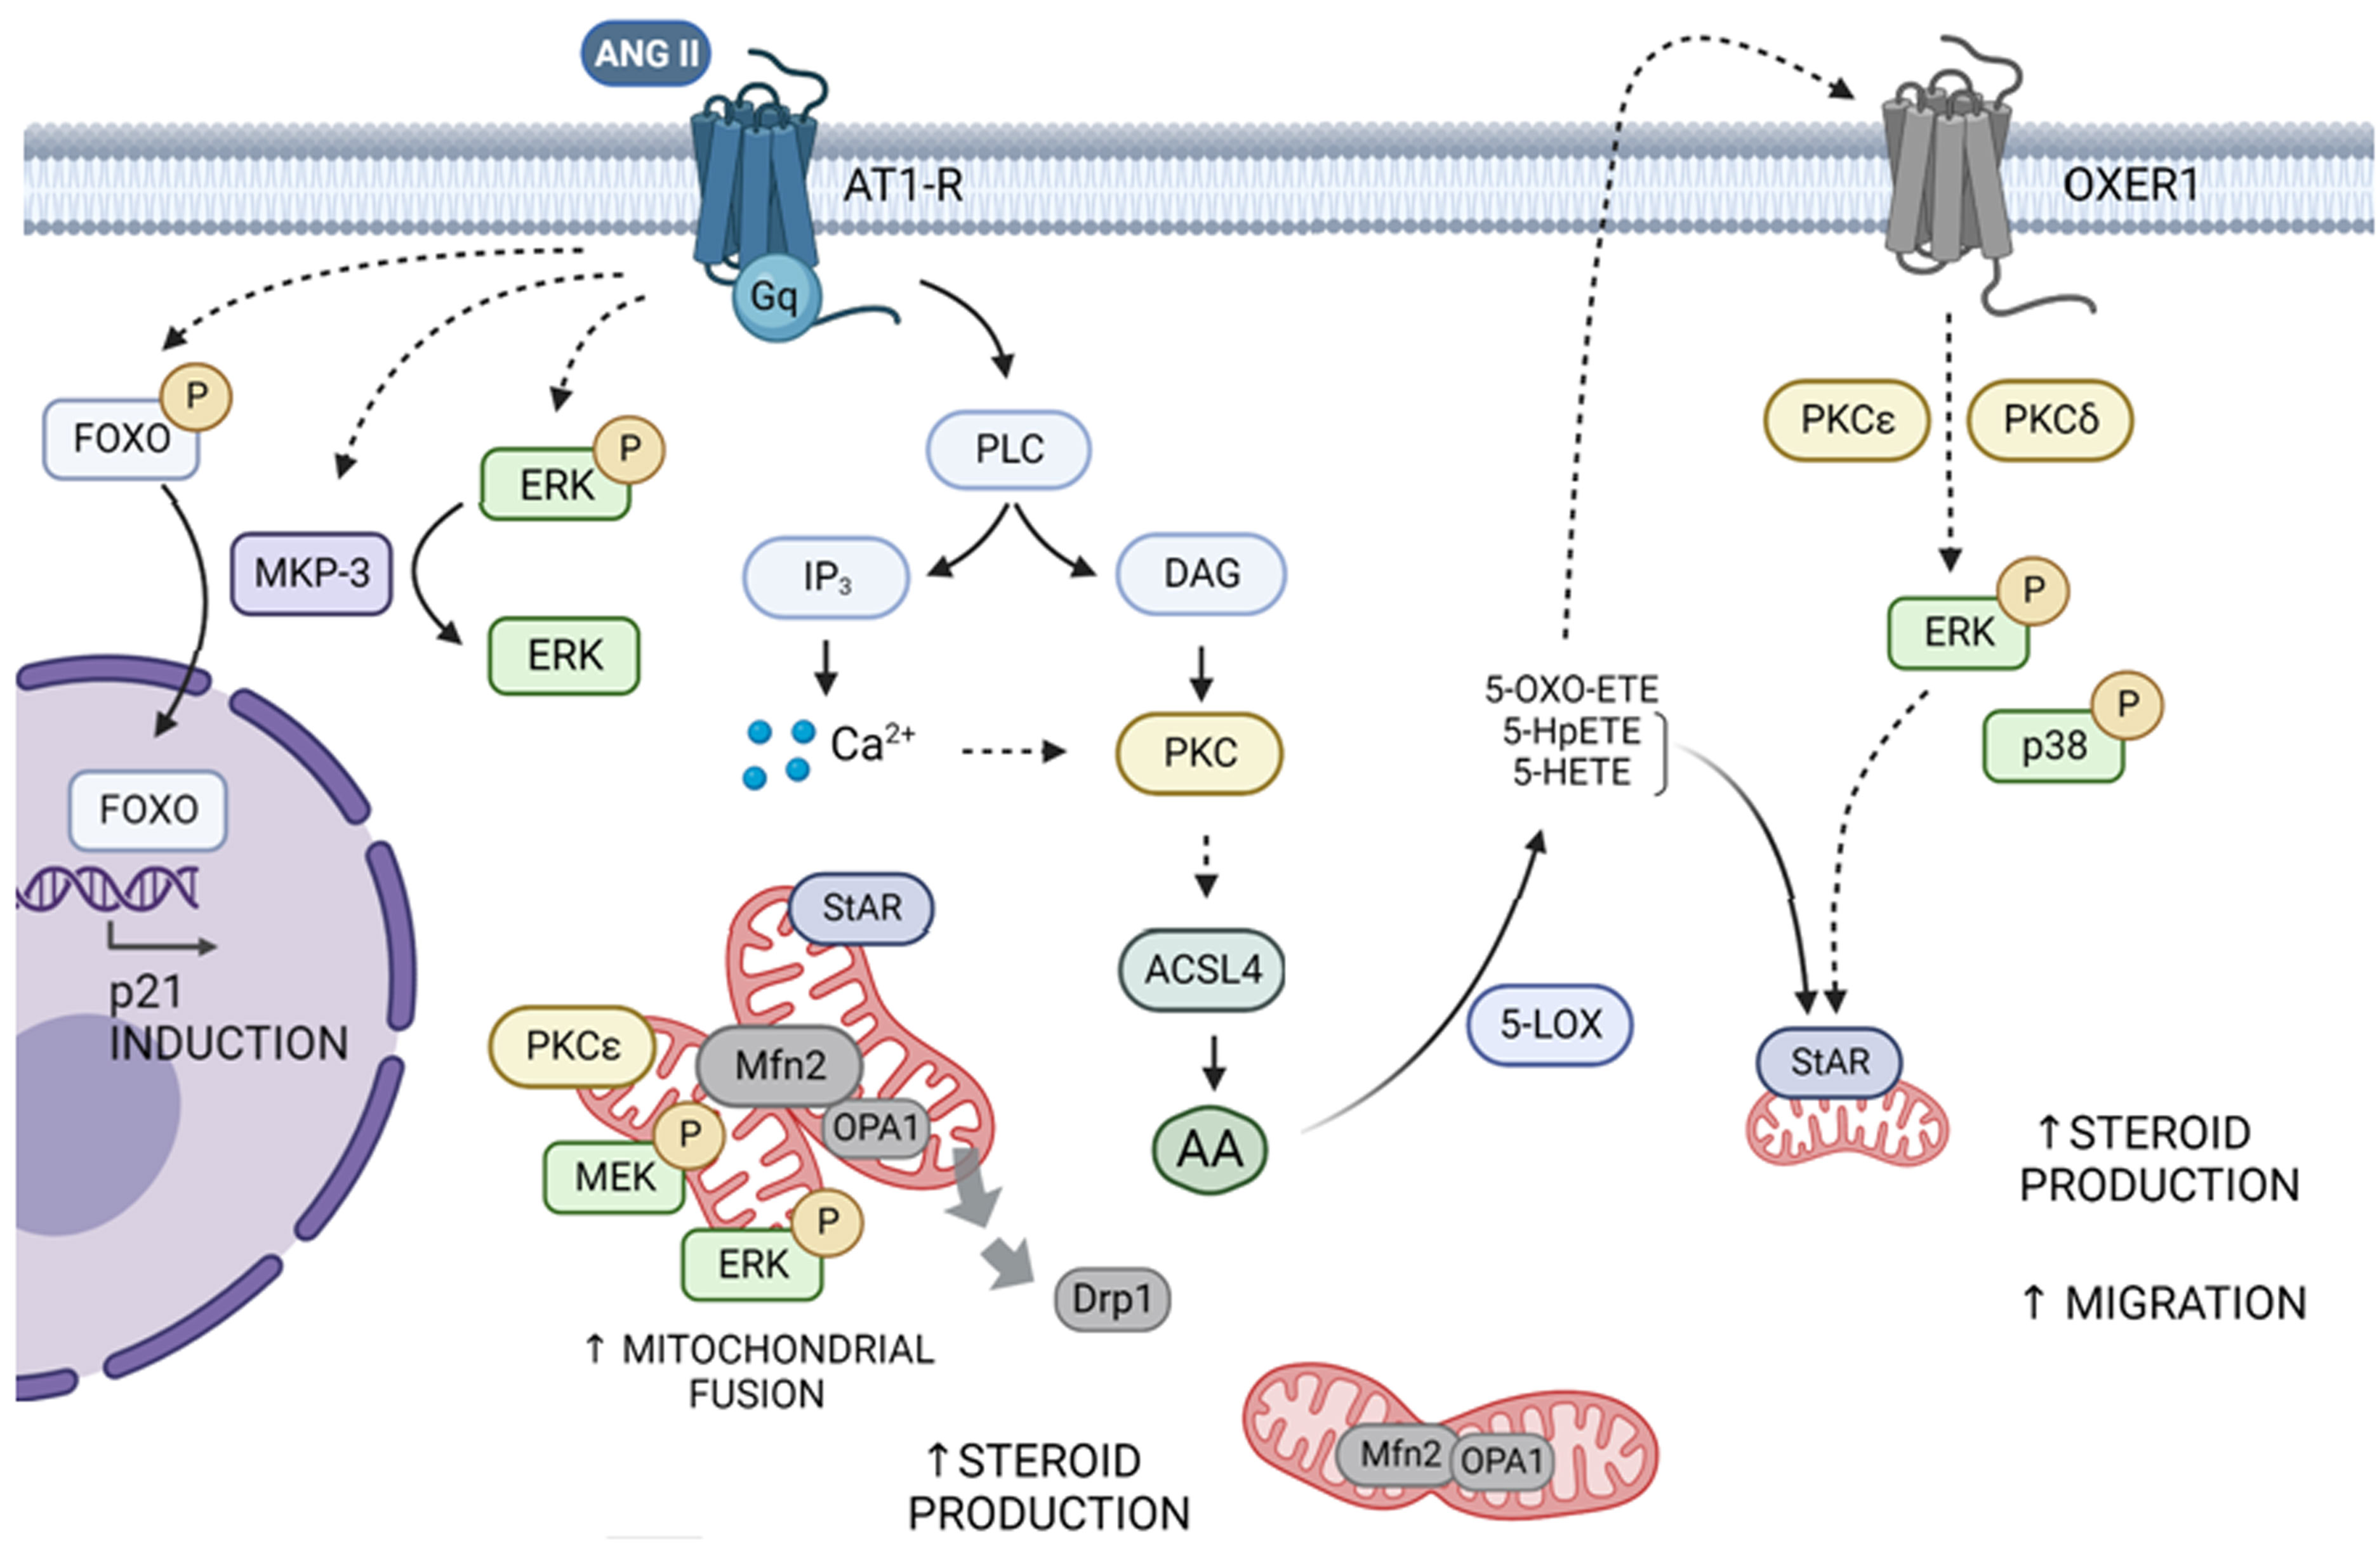
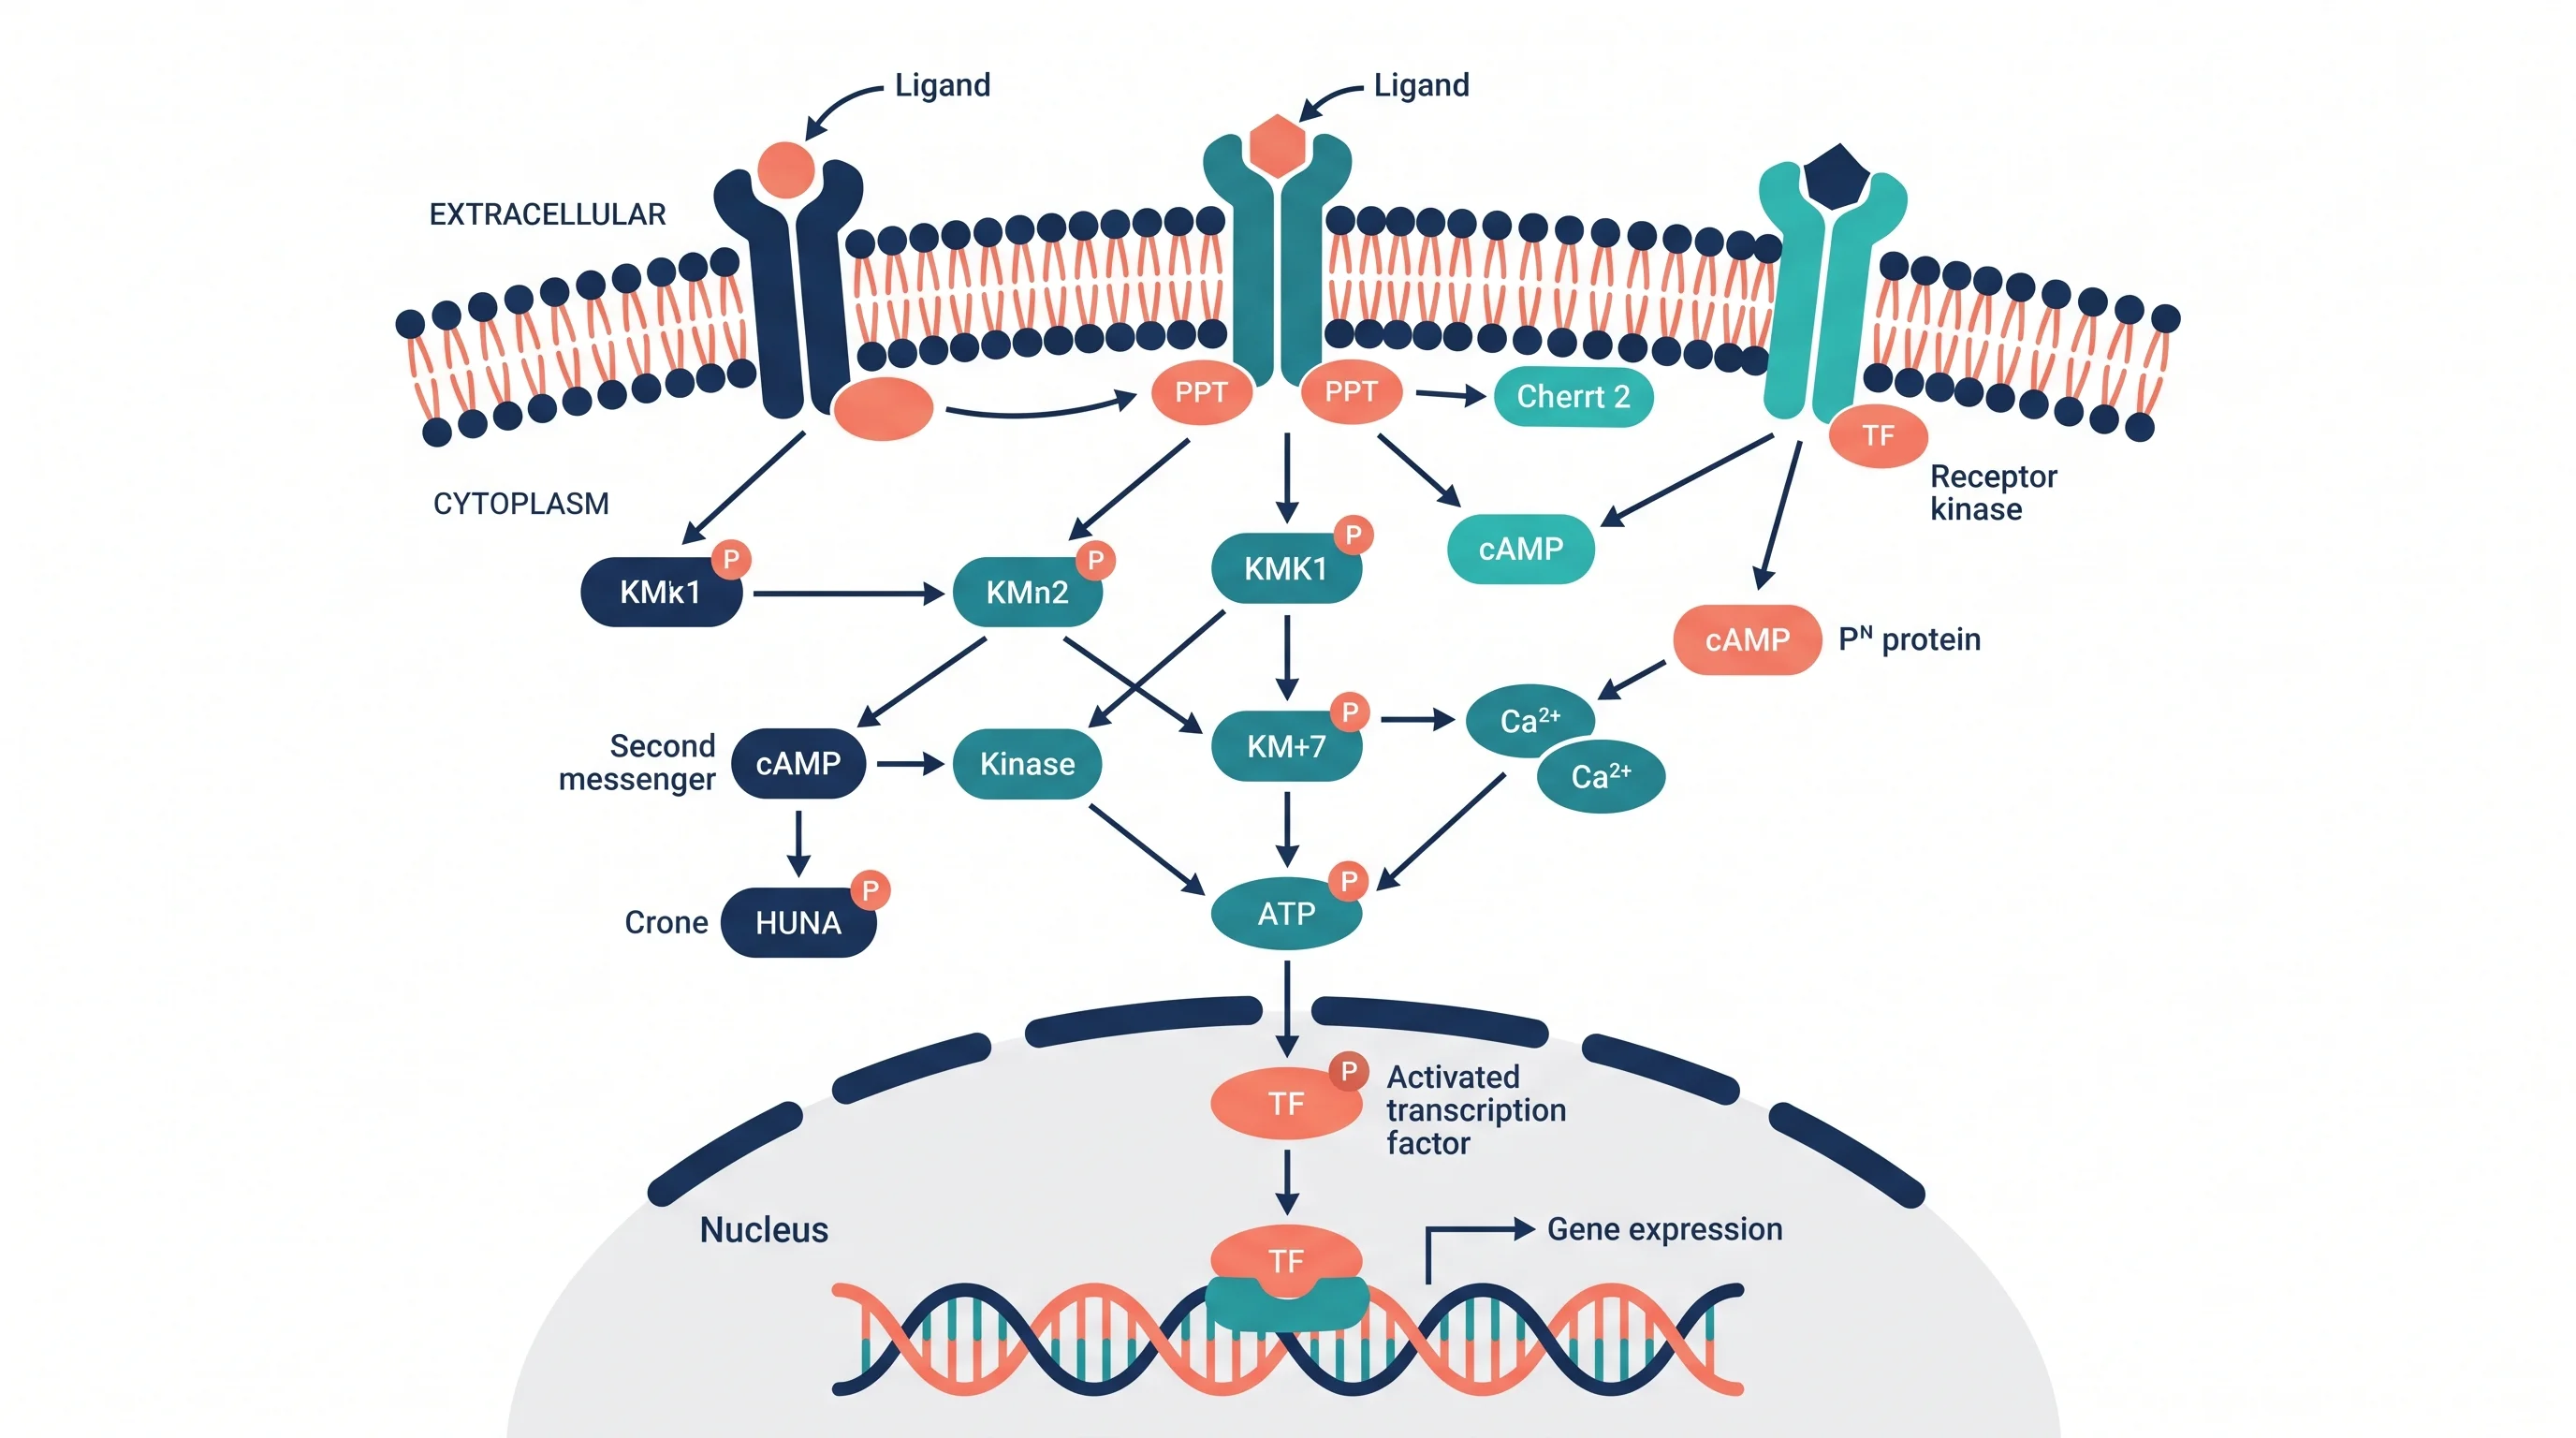
A signal transduction pathway diagram is a visual map illustrating the biochemical steps by which a cell converts an extracellular signal into a specific functional response. These diagrams track the flow of information from surface receptors through various relay molecules, such as kinases and second messengers, to final targets like DNA or metabolic enzymes.
The complexity of biological systems requires a structured method to visualize how cells perceive their environment. Whether a cell is responding to a hormone like insulin, a neurotransmitter in the brain, or a growth factor during development, the underlying mechanism is often represented through these specialized flowcharts. In 2026, as our understanding of "cross-talk" between different pathways grows more detailed, these diagrams serve as essential blueprints for researchers, students, and medical professionals.
The Purpose and Utility of Signal Transduction Diagrams
At its core, a signal transduction pathway diagram is a model of logic and sequence. Cells do not simply "react"; they process information through a series of molecular switches. The diagram serves several critical functions in modern biology:
- Simplification of Complexity: A single human cell contains thousands of different proteins. A diagram isolates the specific molecules involved in one functional chain, allowing a researcher to ignore the "background noise" of the rest of the cytoplasm.
- Predictive Modeling: By looking at the sequence of a pathway, scientists can predict what happens if a specific protein is inhibited. This is the fundamental basis for modern pharmacology and drug design.
- Identification of Feedback Loops: Biological systems are rarely linear. Diagrams help visualize where a downstream product might circle back to inhibit an upstream enzyme (negative feedback) or amplify the signal (positive feedback).
- Standardization of Knowledge: Using standardized symbols for kinases, phosphatases, and receptors allows scientists across the globe to communicate findings without language barriers.
Essential Components of a Signaling Diagram
To read or create an accurate signal transduction pathway diagram, one must understand the "vocabulary" of the components. Every pathway generally follows a linear progression from the outside of the cell to the inside.
The Signal (Ligand)
The process begins with a ligand, a signaling molecule that carries information. This could be a small molecule like adrenaline, a large protein like Growth Hormone, or even physical stimuli like light or pressure. In diagrams, the ligand is usually depicted as a distinct geometric shape approaching a receptor.
The Receptor
The receptor is the "antenna" of the cell. Most are transmembrane proteins, meaning they span the lipid bilayer. When a ligand binds to the extracellular domain of the receptor, the protein undergoes a conformational change. This change is the physical manifestation of the signal entering the cell. Major classes include G protein-coupled receptors (GPCRs), Receptor Tyrosine Kinases (RTKs), and Ion Channel receptors.
The Transducers and Second Messengers
Once the signal is inside, it must be relayed. This is the "transduction" phase.
- Protein Kinases: These enzymes add phosphate groups to other proteins (phosphorylation), usually turning them "on."
- Protein Phosphatases: These remove phosphate groups, typically turning proteins "off."
- Second Messengers: These are small, non-protein molecules like cyclic AMP (cAMP) or calcium ions ($Ca^{2+}$). Because they are small, they can diffuse rapidly throughout the cell to spread the signal quickly.
The Effector and Response
The final stage is the cellular response. This might involve an effector protein moving into the nucleus to act as a transcription factor, altering which genes are turned into proteins. Alternatively, it might involve changing the activity of a metabolic enzyme in the cytoplasm or altering the cytoskeleton to make the cell move.

Decoding the Visual Language: Symbols and Lines
A signal transduction pathway diagram uses a specific shorthand that can be confusing to the uninitiated. Understanding these symbols is paramount to interpreting the biological intent.
- Standard Arrows ($\rightarrow$): These indicate activation or the next step in a sequence. If Protein A points an arrow at Protein B, it means Protein A activates Protein B.
- T-Bar Lines ($\dashv$): These indicate inhibition. If Protein C points a T-bar at Protein D, it means Protein C stops or suppresses the activity of Protein D.
- P in a Circle (Ⓟ): This represents a phosphate group. Its placement on a protein indicates that the protein has been phosphorylated.
- Dashed Lines: Often used to represent a multi-step process that has been simplified for the sake of the diagram or a process that is hypothesized but not yet fully proven.
- Double-Headed Arrows: These suggest a reversible reaction or an equilibrium state between two forms of a molecule.
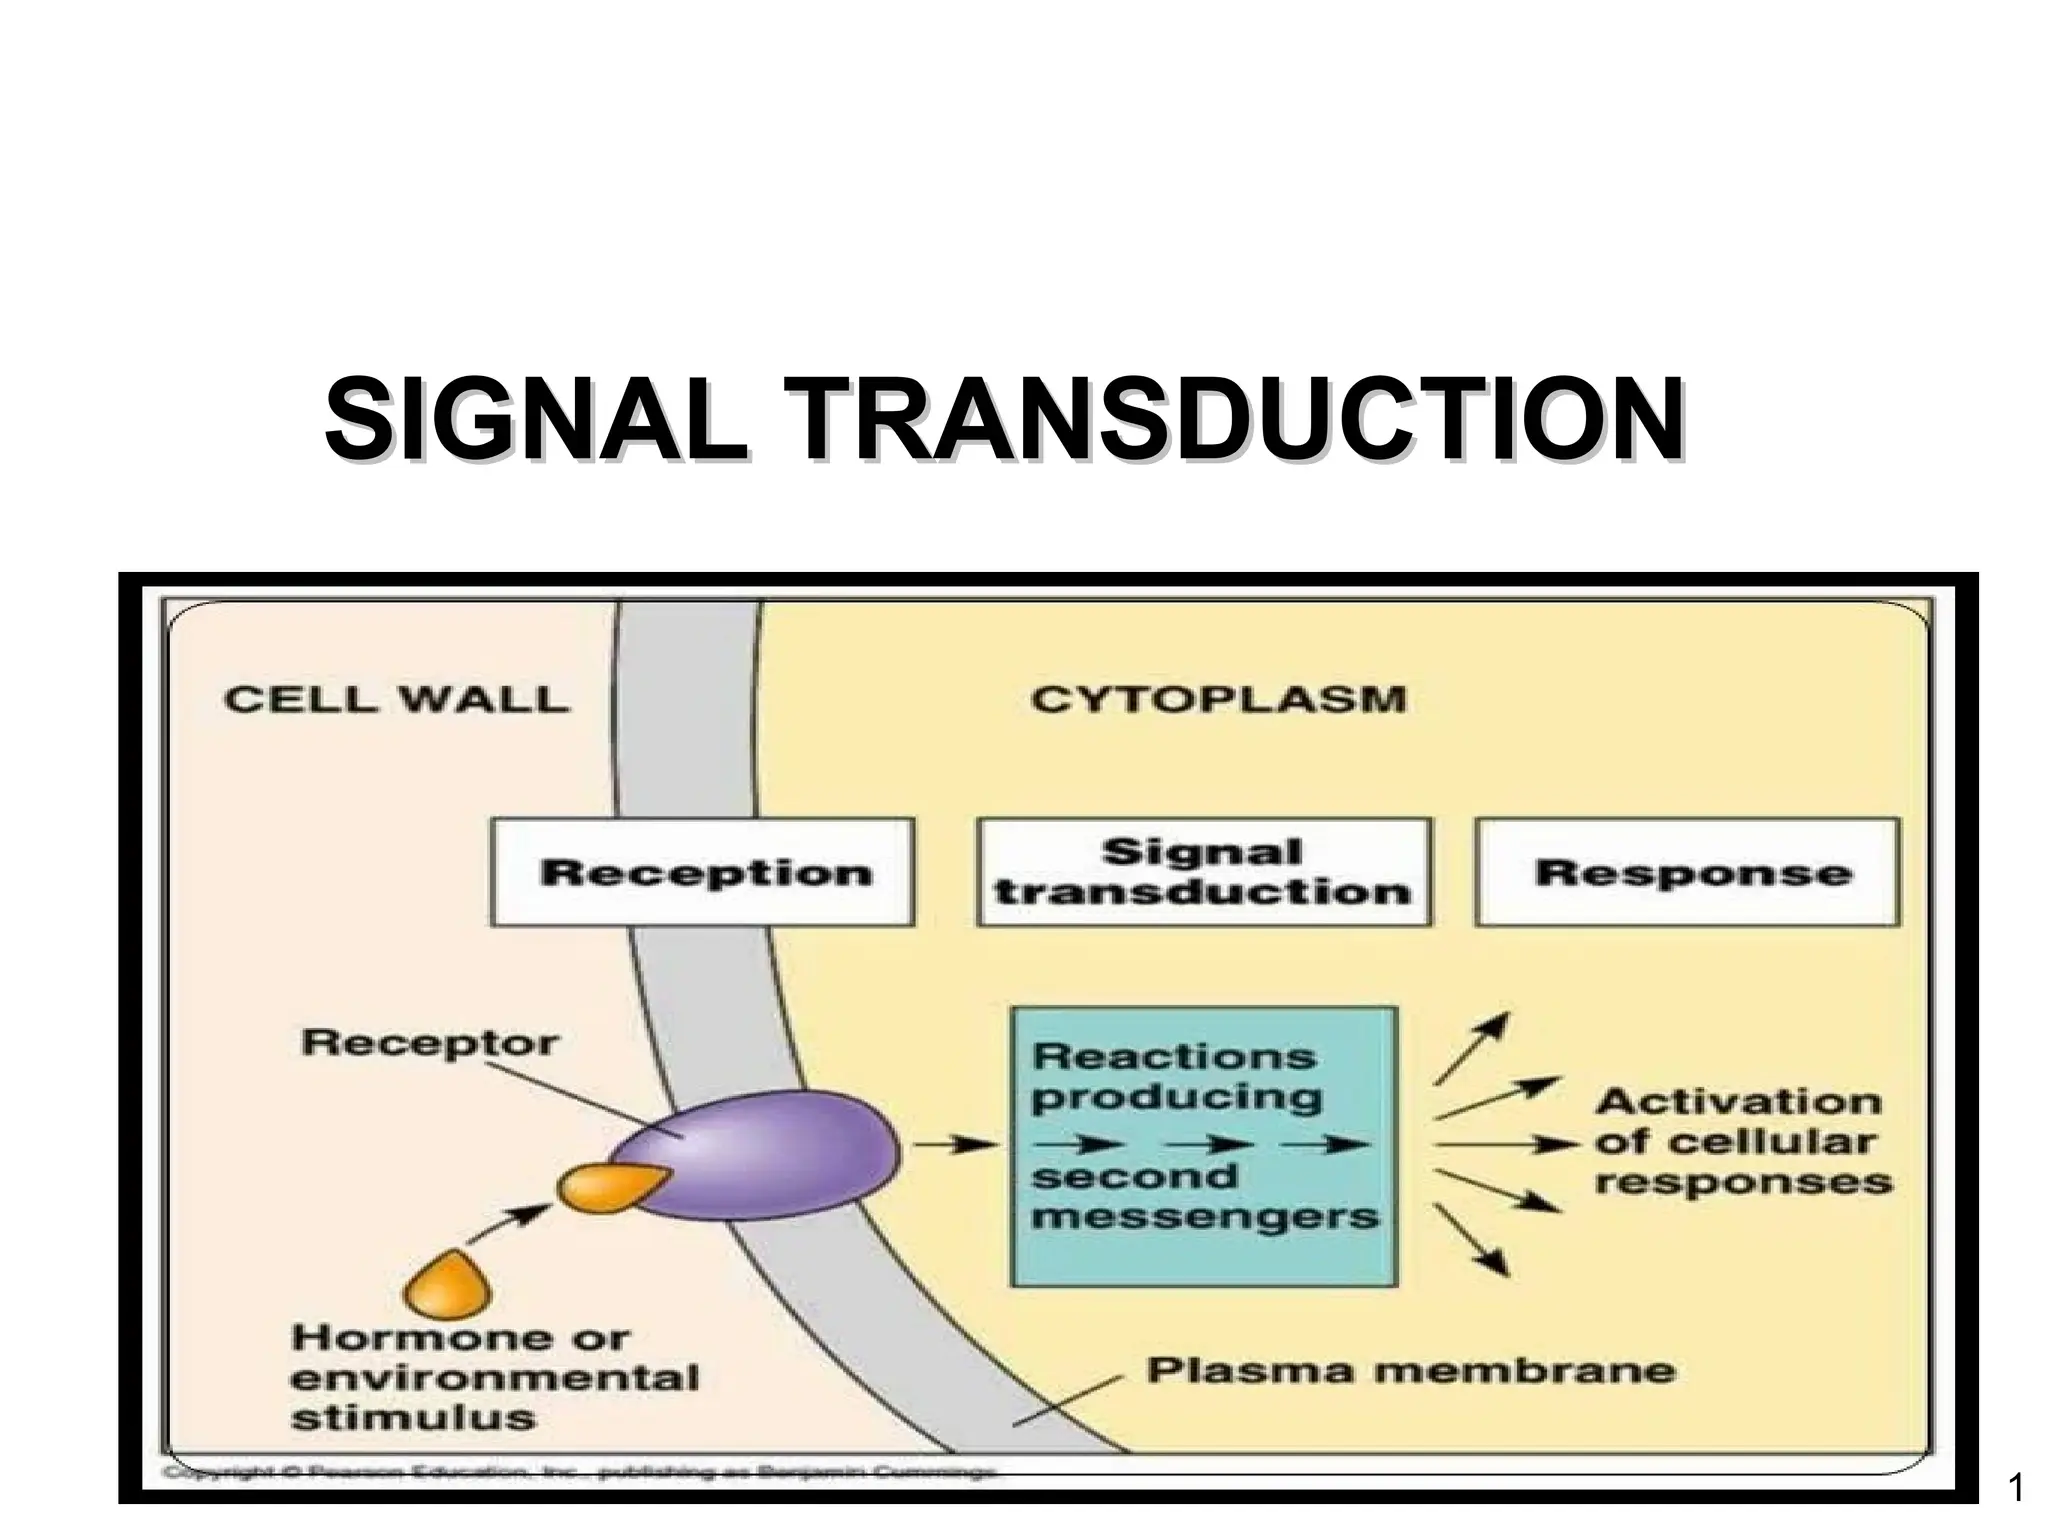
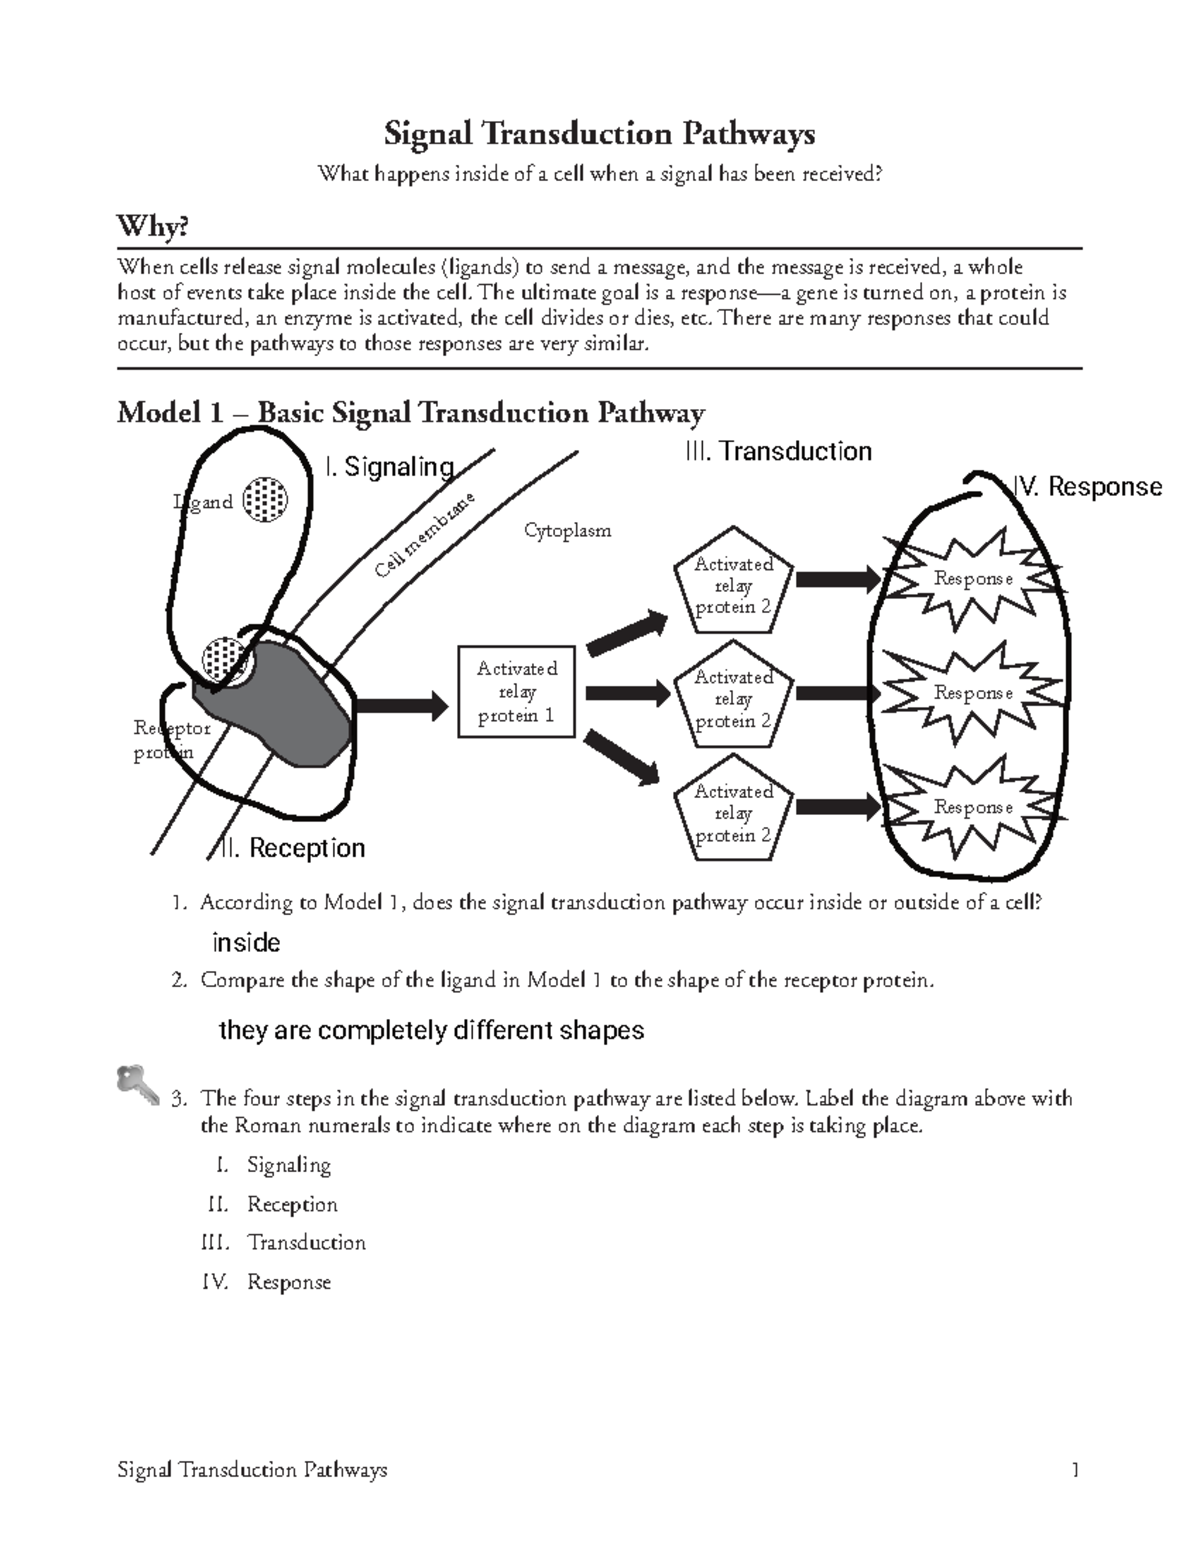
The Three Phases of Signal Transduction
Every diagram, regardless of its complexity, can be broken down into three distinct stages first formalized by researchers like Earl W. Sutherland, Jr. (who won the Nobel Prize in 1971 for his work on hormones).
1. Reception
Reception is highly specific. A ligand will only bind to a receptor with a matching shape. This specificity ensures that a signal intended for the liver does not accidentally trigger a response in the heart. In diagrams, this is often shown as a "lock and key" fit.
2. Transduction
This is the "meat" of the diagram. The goal of transduction is often amplification. A single ligand binding to a single receptor can result in the activation of thousands of downstream molecules. Think of it as a pyramid scheme: one enzyme activates ten others, each of which activates ten more. This "cascade" allows the cell to respond vigorously to even minute concentrations of a signal.
3. Response
The response is the "output" of the system. In a diagram, this is usually the terminal point. It is important to note that the same signal can lead to different responses in different cells. For example, adrenaline causes heart muscle cells to contract more rapidly but causes smooth muscle cells in the lungs to relax. The diagram for each cell type would show different terminal effectors.
Comparison of Major Signaling Pathway Types
The following table compares the most common pathways found in biological literature and textbooks as of 2026.
| Pathway Type | Primary Receptor | Common Second Messenger | Typical Response | Examples |
|---|---|---|---|---|
| GPCR Pathway | G Protein-Coupled Receptor | cAMP, $IP_3$, DAG | Metabolic changes, sensory perception | Adrenaline, Smell, Sight |
| RTK Pathway | Receptor Tyrosine Kinase | Ras, MAPK Cascade | Cell growth, division, and repair | Insulin, Growth Factors |
| JAK-STAT | Cytokine Receptor | STAT proteins | Immune response, gene transcription | Interferons, Interleukins |
| Ion Channel | Ligand-Gated Ion Channel | $Ca^{2+}$, $Na^{+}$, $K^{+}$ | Electrical signaling, muscle contraction | Neurotransmitters (ACh) |
| Steroid Path | Intracellular Receptor | N/A (Direct binding to DNA) | Long-term developmental changes | Testosterone, Estrogen |
Advanced Concepts: Cross-talk and Feedback
In the past, signal transduction pathway diagrams were drawn as simple, isolated "pipes." However, in modern systems biology, we recognize that these pathways are more like a complex web.
Cross-talk
Cross-talk occurs when components of one pathway affect another. For example, the cAMP produced in a GPCR pathway might inhibit a kinase in the RTK pathway. This allows the cell to integrate multiple inputs—such as "grow" and "conserve energy"—to make a balanced decision. On a diagram, cross-talk is represented by lines that jump between what otherwise look like independent columns.
Feedback Loops
- Negative Feedback: This is the cell’s thermostat. Once the response reaches a certain level, it sends a signal back to the start of the pathway to shut it down. This prevents over-stimulation, which can lead to diseases like cancer.
- Positive Feedback: This creates an "all-or-nothing" switch. Once the pathway is triggered, it reinforces itself until a massive response is achieved (common in processes like blood clotting or childbirth).
Tools for Creating and Accessing Pathway Diagrams
As of 2026, researchers no longer rely solely on hand-drawn sketches. High-fidelity diagrams are generated using specialized software and databases that pull from real-time proteomic data.
- KEGG (Kyoto Encyclopedia of Genes and Genomes): One of the most authoritative sources for standardized pathway maps. It links genomic information with high-level systemic functions. Visit KEGG.
- Reactome: An open-source, curated database of human biological pathways. It provides highly detailed, interactive diagrams that allow users to click on proteins to see their chemical structures and associated diseases. Explore Reactome.
- BioRender: A popular web-based tool used by scientists to create publication-quality diagrams. It provides a library of pre-drawn icons for receptors, membranes, and organelles, ensuring that diagrams are both scientifically accurate and visually appealing.
- Cell Signaling Technology (CST) Pathway Maps: A commercial resource that provides meticulously researched diagrams specifically focused on human disease and immunology.
Common Mistakes When Interpreting Diagrams
Even experienced students can misinterpret a signal transduction pathway diagram if they aren't careful.
- Assuming Linearity: Always look for branches. Very few pathways are truly a straight line from A to Z.
- Ignoring Location: Many diagrams don't explicitly show where in the cell a process is happening. Remember that some steps happen at the plasma membrane, some in the cytosol, and some inside the mitochondria or nucleus.
- Confusing Total Amount with Activity: A diagram might show "Protein X" activating "Protein Y." This doesn't necessarily mean the cell is making more of Protein Y; it usually means it is converting the existing Protein Y from an inactive state to an active one.
- Overlooking Degradation: For a signal to be meaningful, it must be temporary. Diagrams often omit the "cleanup" crews—the enzymes that break down cAMP or the proteasomes that degrade signaling proteins—to keep the visual clean.
Frequently Asked Questions
What is the most important part of a signal transduction pathway?
There is no single "most important" part, as the system is a chain. However, the receptor is critical for specificity (ensuring the right signal is received), while protein kinases are critical for the amplification and control of the message within the cell.
How do mutations affect these diagrams?
In many diseases, a protein in the diagram becomes "constitutively active." This means it stays in the "on" position regardless of whether a signal is present. For example, in many cancers, a protein called Ras (part of the RTK pathway) is mutated so it constantly signals the cell to divide, even without growth factors.
Why do some diagrams use different colors for arrows?
While not universal, many modern diagrams use green arrows for activation and red lines for inhibition. Always check the diagram’s legend, as color-coding can also represent different types of molecules (e.g., blue for proteins, orange for lipids).
Can one ligand activate more than one pathway?
Yes. This is a concept known as pleiotropy. A single hormone can bind to different types of receptors on different cells, or even different receptors on the same cell, triggering multiple distinct pathway diagrams simultaneously.
What is the difference between a first messenger and a second messenger?
The first messenger is the extracellular ligand (the "mailman" who delivers the letter to the door). The second messenger is the internal molecule (the "family member" who takes the letter from the door and runs it to the kitchen) that spreads the message throughout the interior of the cell.
Practical Recommendation for Students and Researchers
When studying a new signal transduction pathway diagram, do not attempt to memorize every protein name immediately. Instead, focus on the topology of the pathway: identify the start (receptor), the middle (the main kinase cascade), and the end (the cellular change). Once you understand the flow of information, the names of the individual components will be easier to retain because you will understand their functional role in the sequence. For those creating diagrams for publication in 2026, prioritize clarity over "completeness"—it is often better to use a simplified diagram in the main text and provide the full, "hairball" interactome as supplementary material.
Image Gallery
Select an image to open it in a new tab.



Celine Dubois
Contemporary Living and Global Arts Columnist
