Understanding the S Curve in Project Management

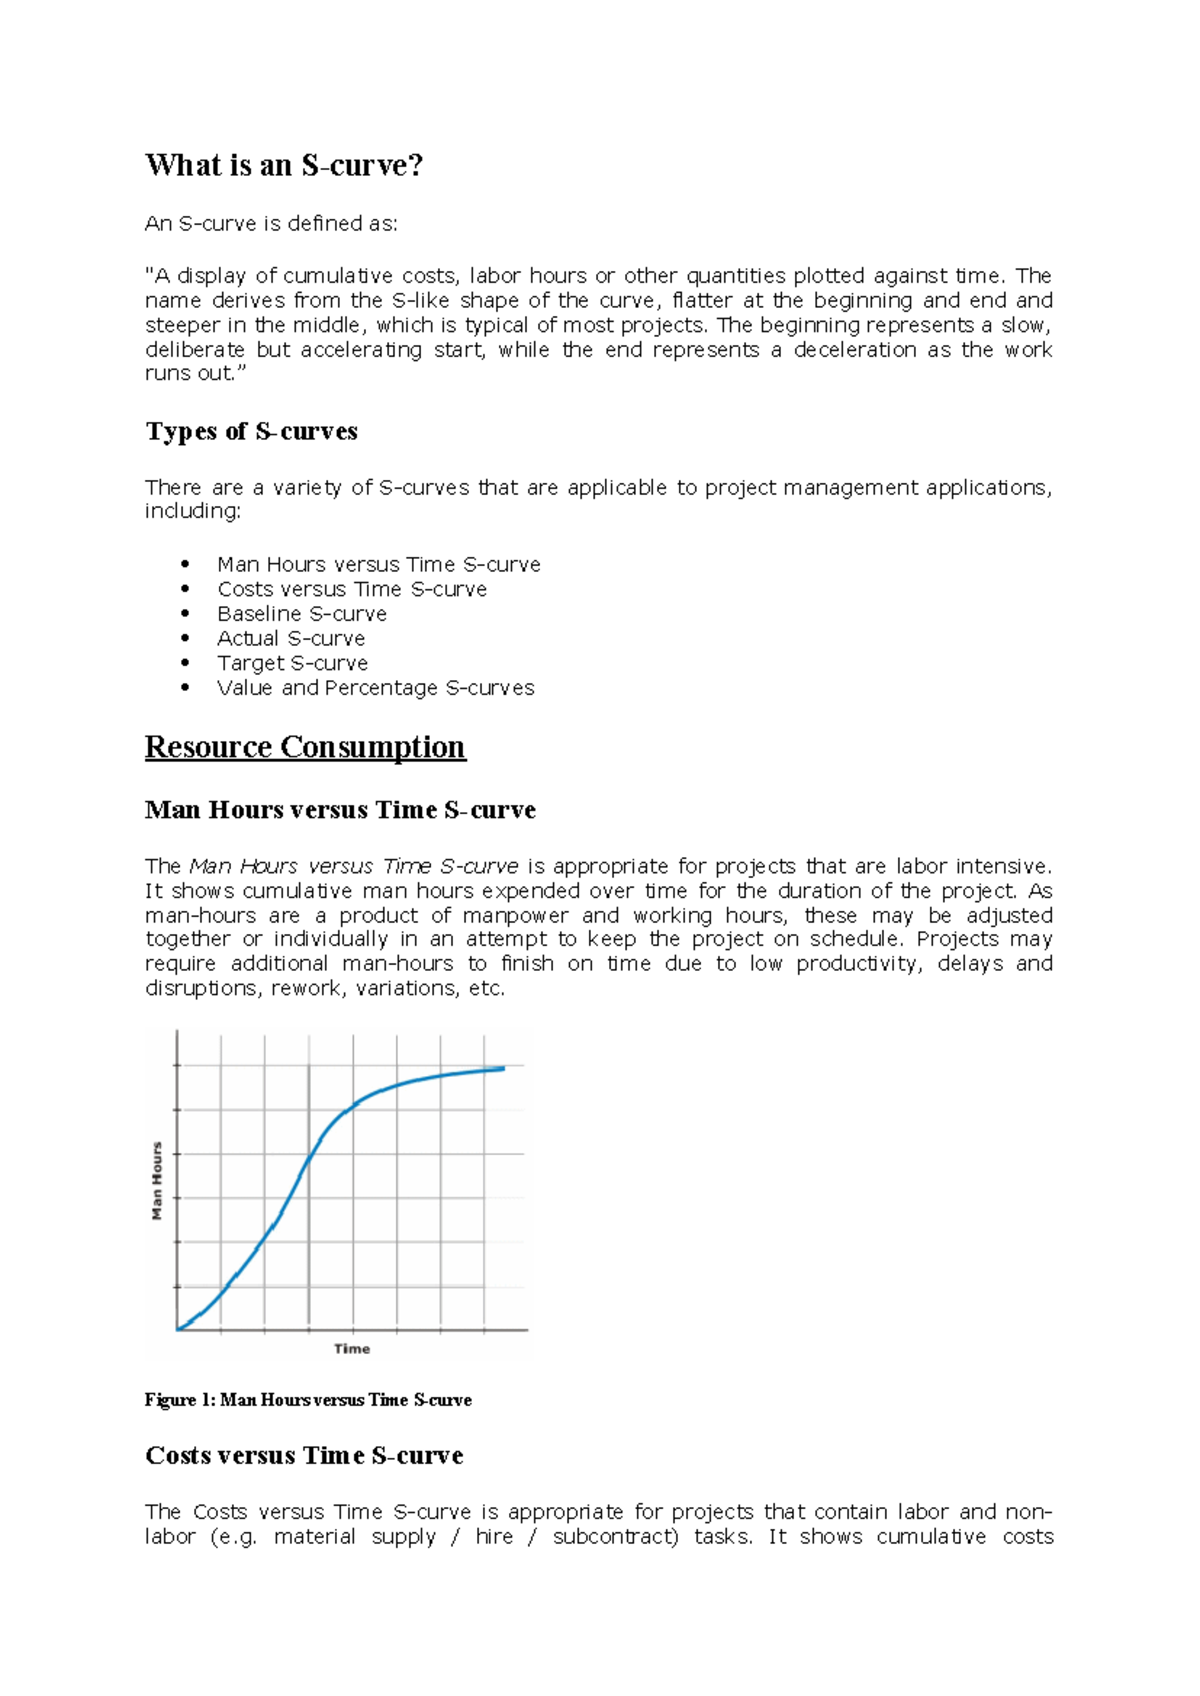
The S-curve in project management is a mathematical graph that tracks cumulative data—such as cost, man-hours, or progress—against time. It is used to visualize project growth, identify deviations from the baseline, and forecast future performance by illustrating the slow start, rapid acceleration, and eventual leveling off of project activities.
Project management in 2026 relies heavily on data visualization to navigate complex global supply chains and multi-disciplinary teams. Among the various tools available to a project manager, the S-curve remains one of the most vital. While it may appear as a simple line on a graph, it represents the heartbeat of a project’s lifecycle. By plotting cumulative work or expenditure over the duration of a project, stakeholders can immediately see whether a project is ahead of schedule, over budget, or tracking perfectly toward its objectives.
The Anatomy of an S-Curve
The term "S-curve" is derived from the characteristic shape of the graph. In most projects, progress does not occur at a linear rate. Instead, it follows a predictable pattern of mobilization, execution, and closeout.
The Initial Phase (The Tail)
At the beginning of a project, the curve starts at the origin (zero time, zero progress) and rises slowly. This shallow slope represents the "Initial Phase." During this period, the project team is focused on mobilization, planning, and procurement. Because resources are being assembled and administrative tasks dominate, the cumulative progress or expenditure is relatively low. This is often the phase where "Scope Definition" and "Stakeholder Alignment" occur, which are essential but do not typically result in high-volume physical output.
The Intermediate Phase (The Steep Slope)
As the project moves out of the planning phase and into execution, the curve begins to rise sharply. This is the "Intermediate Phase," where the bulk of the work is performed. Whether it is coding software, pouring concrete, or manufacturing components, this phase involves the highest concentration of resources and man-hours. The steepness of the slope indicates the intensity of the work; a steeper line suggests a high rate of progress and resource consumption.
The Final Phase (The Plateau)
Toward the end of the project, the curve begins to flatten out, forming the top of the "S." This "Final Phase" represents the wind-down period. Tasks during this stage include quality inspections, punch-list resolutions, testing, commissioning, and final documentation. While these tasks are critical for completion, they represent a small percentage of the overall cumulative progress compared to the massive output of the execution phase. The plateau indicates that the project is nearing 100% completion.
Why the S-Curve is Essential for Project Control
Effective project management requires more than just knowing where you are; it requires knowing where you should be. The S-curve serves as a multi-dimensional reporting tool that provides several layers of insight.
Progress Tracking and Monitoring
The primary use of an S-curve is to track actual progress against the planned baseline. By overlaying the "Actual" curve on top of the "Planned" curve, project managers can see discrepancies in real-time. If the actual curve is below the planned curve, the project is lagging. If it is above, the project is ahead of schedule. In 2026, many project management information systems (PMIS) automate this process, pulling data directly from daily site reports or software commits to update the S-curve instantly.
Cash Flow Forecasting
For financial stakeholders, the S-curve is a window into the project's liquidity requirements. A cost-based S-curve shows when the most significant expenditures will occur. Since the steepest part of the curve represents the peak of activity, it also represents the period of highest cash outflow. Organizations use this data to ensure they have sufficient funding available during the "Intermediate Phase" to avoid work stoppages due to payment delays.
Resource Allocation
By analyzing the slope of the curve, managers can predict resource requirements. A very steep S-curve suggests that a project will need a large number of specialists or equipment in a short window of time. If the organization realizes that the required resources are unavailable for that specific peak, they can "smooth" the curve by adjusting the schedule, leading to a more manageable, albeit longer, project duration.

Different Types of S-Curves
Not all S-curves measure the same thing. Depending on the goals of the report, different data points are plotted on the Y-axis.
- Baseline S-Curve: This is generated from the initial project schedule. It represents the "ideal" path to completion and serves as the benchmark for all future comparisons.
- Actual S-Curve: This tracks the work that has actually been completed. It is updated periodically (weekly or monthly) to show the current state of the project.
- Target S-Curve: In projects where the scope changes significantly, a target S-curve may be created to reflect the updated goals without losing the context of the original baseline.
- Man-Hour S-Curve: Used primarily in labor-intensive industries like construction or shipbuilding, this tracks the cumulative labor hours spent. It is essential for monitoring productivity.
- Cost S-Curve: This tracks cumulative expenditure. It is used for budgeting and is often a key component of Earned Value Management (EVM).
The Concept of the "Banana Curve"
One of the more advanced applications of the S-curve is the creation of a "Banana Curve." This is formed by plotting two different planned S-curves: the Early Start curve and the Late Start curve.
- Early Start Curve: This assumes every task in the project begins as early as possible according to the schedule's logic.
- Late Start Curve: This assumes every task is delayed as much as possible without pushing back the project’s final completion date (using up all available "float").
The area between these two curves creates a banana-shaped envelope. As long as the Actual S-Curve stays within this envelope, the project is technically on track to finish on time. If the actual curve slips below the Late Start line, the project's end date is officially at risk. This visualization is incredibly powerful for 2026 project managers because it provides a "buffer zone" that accounts for natural fluctuations in project momentum without triggering unnecessary alarms.
Data Comparison: Planned vs. Actual Performance
To illustrate how these curves function in a real-world scenario, consider the following data for a 10-month infrastructure project with a budget of $1,000,000.
| Month | Planned Cumulative % | Actual Cumulative % | Planned Cumulative Cost | Actual Cumulative Cost |
|---|---|---|---|---|
| 1 | 5% | 4% | $50,000 | $45,000 |
| 2 | 12% | 10% | $120,000 | $110,000 |
| 3 | 25% | 22% | $250,000 | $235,000 |
| 4 | 45% | 40% | $450,000 | $440,000 |
| 5 | 65% | 58% | $650,000 | $610,000 |
| 6 | 80% | 75% | $800,000 | $780,000 |
| 7 | 90% | 88% | $900,000 | $890,000 |
| 8 | 95% | 94% | $950,000 | $960,000 |
| 9 | 98% | 98% | $980,000 | $990,000 |
| 10 | 100% | 100% | $1,000,000 | $1,010,000 |
In this example, the project was slightly behind schedule throughout the execution phase (Months 3–6) as evidenced by the lower "Actual Cumulative %." However, the team managed to catch up by Month 9. Interestingly, by Month 8, the "Actual Cumulative Cost" exceeded the "Planned Cumulative Cost," indicating that while the project was catching up on time, it was doing so at a higher cost—possibly due to overtime or expedited shipping of materials.
Interpreting S-Curve Variations
The shape of the S-curve can reveal a lot about the health and management style of a project.
Front-End Loading
A curve that rises very sharply at the beginning is "front-loaded." This usually occurs when a project manager allocates significant resources early to mitigate risks or to take advantage of favorable weather/market conditions. While this can reduce late-stage stress, it requires high initial capital.
Back-End Loading
Conversely, a curve that stays flat for too long and then spikes at the end is "back-loaded." This is often a red flag. It suggests that the project team is procrastinating or that there are major bottlenecks in the planning phase. Back-loaded projects are highly susceptible to "burnout" and quality issues, as the final 20% of the work is compressed into a tiny timeframe.
The Linear Curve
If an S-curve appears as a straight diagonal line, it indicates a constant rate of progress. This is rare in complex projects. A linear curve usually suggests that the project is a series of repetitive, independent tasks with no mobilization or closeout requirements. If a complex project shows a linear baseline, it may indicate a lack of detailed planning.
Integrating S-Curves with Earned Value Management (EVM)
The S-curve is the foundational visual element of Earned Value Management (EVM), a methodology that integrates scope, schedule, and resources. Within an EVM framework, three distinct S-curves are monitored:
- Planned Value (PV): The S-curve of the work intended to be done.
- Actual Cost (AC): The S-curve of the money actually spent.
- Earned Value (EV): The S-curve representing the value of the work actually performed.
By comparing these three lines, managers can calculate critical indices:
- Schedule Variance (SV): EV - PV. A negative value means the project is behind schedule.
- Cost Variance (CV): EV - AC. A negative value means the project is over budget.
In 2026, EVM and S-curves are often integrated into AI-driven dashboards. These systems use historical S-curve data from thousands of past projects to predict where the current "Actual" curve will likely end up, allowing for "Predictive Project Accounting."
Common Pitfalls in S-Curve Analysis
While S-curves are powerful, they are only as good as the data fed into them.
- Inaccurate Progress Reporting: If the "Actual Progress" is based on subjective estimates (e.g., "I think we are 50% done") rather than objective milestones, the S-curve becomes a fiction.
- Ignoring the Critical Path: An S-curve shows cumulative progress across the entire project. A project might look 80% complete and "on track" according to the S-curve, but if the remaining 20% contains a delayed critical path item, the project will still finish late.
- Static Baselines: If the project scope changes but the baseline S-curve is not updated, the comparison becomes meaningless. Managing "Baseline Drifts" is a key responsibility for project controllers.
Practical Steps to Create an S-Curve
To create a functional S-curve for a project in 2026, follow these steps:
- Develop a Robust Schedule: Use a Work Breakdown Structure (WBS) to identify all tasks.
- Allocate Resources/Costs: Assign a dollar value or man-hour count to every task in the schedule.
- Determine Timing: Identify when each task starts and finishes.
- Calculate Periodic Values: For each time period (e.g., each month), sum the value of the work planned to be completed.
- Calculate Cumulative Values: Add the current period’s value to the sum of all previous periods.
- Plot the Data: Use a line graph with Time on the X-axis and Cumulative Value on the Y-axis.
- Update Regularly: As the project progresses, input actual completion data to generate the second line for comparison.
Frequently Asked Questions
Can the S-curve be used in Agile project management?
Yes, though it is often adapted. In Agile, a "Release Burnup Chart" is essentially a variation of an S-curve. It tracks cumulative story points completed against the total scope. While Agile projects are more iterative, the cumulative nature of the work over several sprints still tends to follow an S-shaped pattern as the team finds its velocity and then winds down for a release.
What should I do if my Actual S-curve is consistently above the Planned curve?
While this sounds like a positive (you are ahead of schedule), it requires investigation. It may mean the team is performing exceptionally well, or it could mean that the original baseline was too conservative. Alternatively, it might indicate that the team is skipping quality checks or safety protocols to move faster, which could lead to a sharp correction (and a "plateau" that lasts longer than expected) later.
Why is it called an S-curve if it doesn't always look like an 'S'?
The "S" shape is the theoretical ideal for a project with a distinct beginning, middle, and end. In practice, the curves can be skewed. A project with very fast mobilization might look more like a "J." However, because the mathematical principle of cumulative growth usually involves a slow start and an eventual limit, the "S-curve" remains the standard industry term.
Is an S-curve sufficient for managing a large project?
No. An S-curve is a high-level monitoring tool. It must be used in conjunction with a detailed Gantt chart (to monitor the critical path), a Risk Register, and a Resource Histogram. The S-curve tells you that there is a problem; the Gantt chart and other tools help you find where the problem is.
Recommendations for 2026 Project Leaders
To maximize the utility of S-curves in the current project environment, leaders should prioritize automated data integration. Relying on manual spreadsheet updates in 2026 is a recipe for lagging indicators. Ensure your project management software is linked directly to time-tracking systems and procurement databases.
Furthermore, always utilize the Banana Curve methodology. In an era of volatile markets and supply chain unpredictability, having a single "Planned" line is often unrealistic. By establishing an envelope of Early and Late starts, you provide your team with the flexibility to manage day-to-day variances without losing sight of the ultimate deadline. Finally, ensure that all stakeholders—not just the project controls team—understand how to read the curve. When everyone from the site foreman to the CEO understands that a flattening slope means a loss of momentum, the S-curve becomes a unifying language for project success.
Image Gallery
Select an image to open it in a new tab.

Celine Dubois
Contemporary Living and Global Arts Columnist
