How Open Source Application Monitoring Reshapes Observability

Open source application monitoring reshapes observability by shifting control from proprietary vendors to the engineering community through standardized data collection and vendor-neutral protocols. By utilizing frameworks like OpenTelemetry, organizations achieve deeper system transparency, eliminate vendor lock-in, and significantly reduce the "observability tax" associated with scaling modern cloud-native environments.
Observability has evolved from a luxury for high-scale tech giants into a fundamental requirement for any organization running distributed systems. In 2026, the landscape of Application Performance Monitoring (APM) is no longer defined by the proprietary "black box" agents of the past. Instead, it is being fundamentally reconstructed by open source initiatives that prioritize interoperability, data sovereignty, and cost-efficiency.
This shift is not merely a change in tooling; it represents a philosophical transition in how software reliability is managed. When engineers can inspect the code that monitors their own applications, the barrier between the "observer" and the "observed" dissolves, leading to more resilient architectures and faster incident response times.
The Transition from Monitoring to Holistic Observability
To understand how open source is reshaping the industry, one must first distinguish between traditional monitoring and modern observability. Traditional monitoring is often reactive, relying on predefined dashboards to tell you when something is wrong based on known failure modes. Observability, conversely, is the ability to understand the internal state of a system by looking at the data it produces, allowing engineers to answer questions they didn't know they needed to ask.
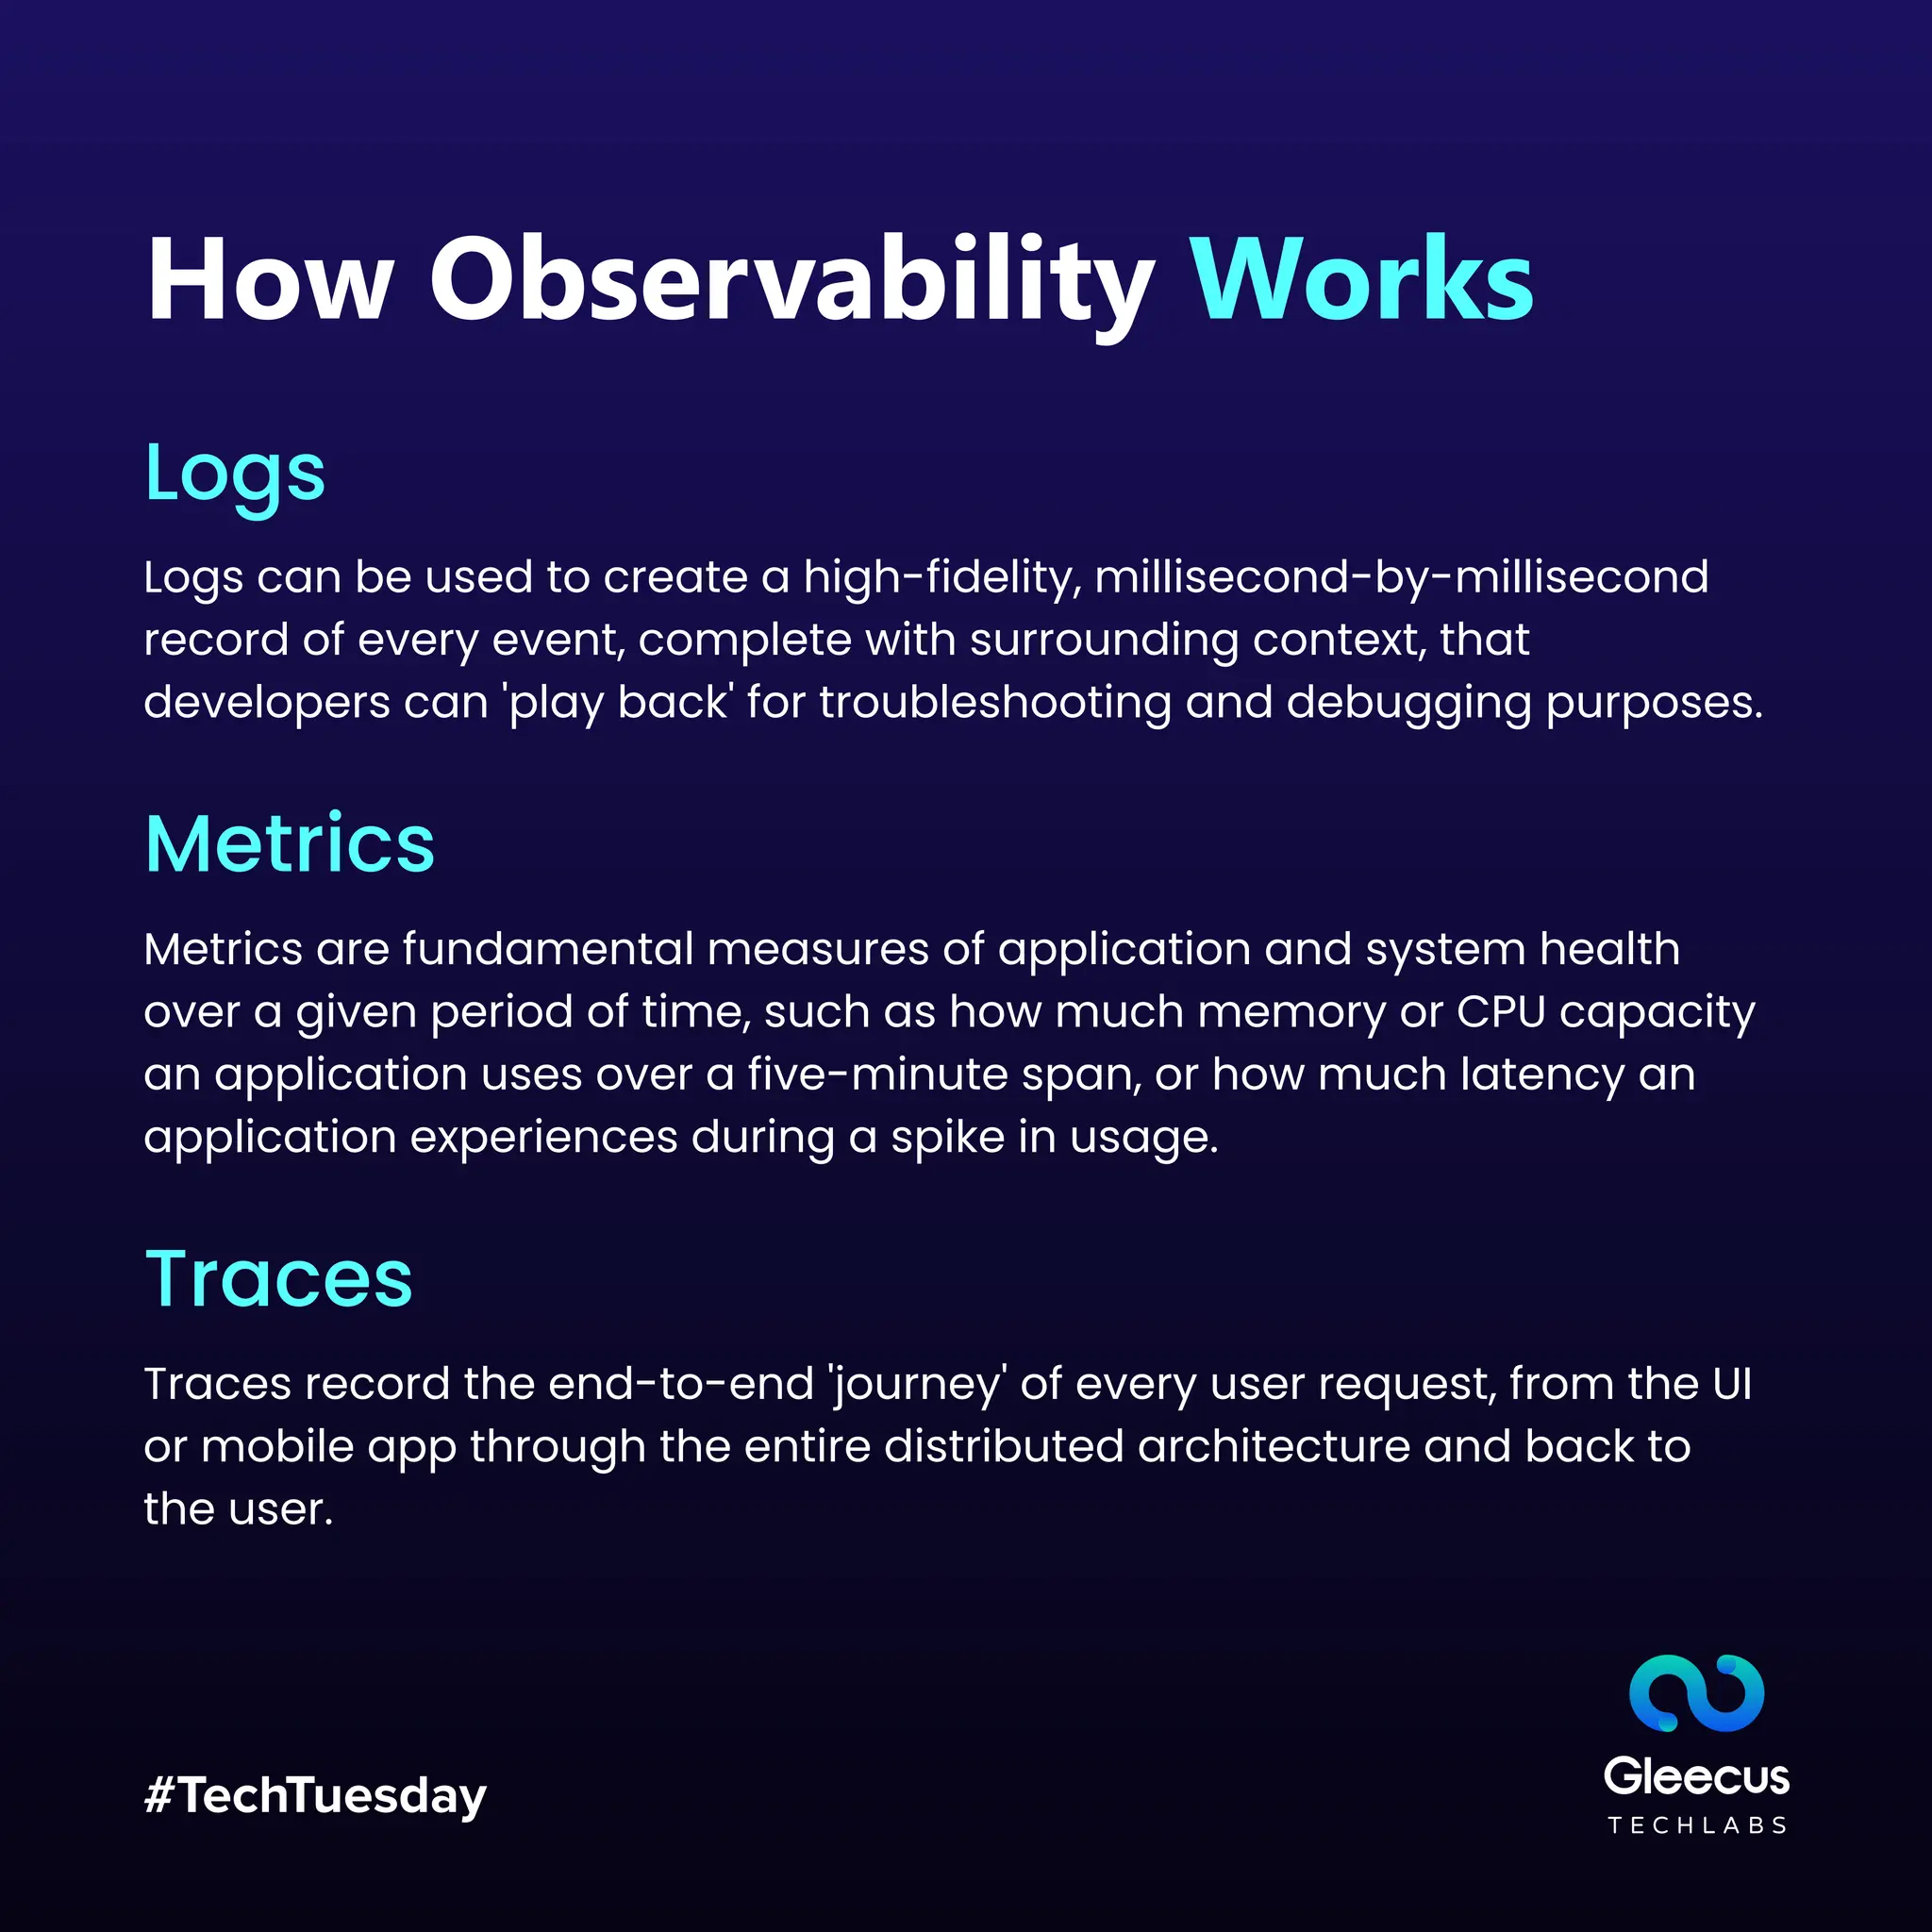
Open source projects have been at the forefront of this transition. While proprietary tools historically focused on "easy" metrics like CPU and memory usage, open source projects like Prometheus and Jaeger introduced the industry to high-cardinality data and distributed tracing. By 2026, these concepts have matured into a cohesive ecosystem where metrics, logs, and traces (often referred to as the "three pillars") are integrated into a single pane of glass.
The reshaping of observability via open source is characterized by three primary drivers:
- Standardization: The industry-wide adoption of the OpenTelemetry (OTel) project.
- Decoupling: Separating the data collection layer from the storage and visualization layer.
- Democratization: Making advanced debugging capabilities accessible to smaller teams without massive licensing budgets.
OpenTelemetry: The Lingua Franca of 2026
The most significant catalyst in this transformation is OpenTelemetry. Managed by the Cloud Native Computing Foundation (CNCF), OpenTelemetry provides a standardized set of APIs, SDKs, and tools to ingest, transform, and send telemetry data to any supported backend.
Before the dominance of OTel, switching observability providers was a logistical nightmare. Each vendor required its own proprietary agent to be installed on every server and embedded in every microservice. This created "vendor lock-in," where the cost of migrating data and retraining teams outweighed the benefits of a better tool.
Open source has reshaped this by creating a "plugin-and-play" architecture. Engineers now instrument their code once using OpenTelemetry's vendor-neutral libraries. If an organization decides to move from a self-hosted Prometheus instance to a commercial SaaS provider, they simply update the configuration of their OpenTelemetry Collector rather than rewriting their application code. This flexibility has forced proprietary vendors to compete on the quality of their analytics and UI rather than the "stickiness" of their agents.
The Role of the OpenTelemetry Collector
The Collector acts as a vendor-agnostic proxy that can receive, process, and export telemetry data. In 2026, it is common to see highly complex "observability pipelines" built entirely on open source components. These pipelines allow teams to:
- Filter sensitive data: Remove PII (Personally Identifiable Information) before it ever leaves the private network.
- Sample traces: Instead of paying to store 100% of traces, teams can use tail-based sampling to only keep traces that contain errors or high latency.
- Convert formats: Translate legacy Zipkin or Jaeger spans into the OTLP (OpenTelemetry Protocol) standard.

Breaking the "Observability Tax"
For years, organizations faced a scaling problem: as their microservices grew, their observability bills grew exponentially. Many SaaS providers charge based on data volume or the number of "hosts" being monitored. In a world of ephemeral containers and serverless functions, these pricing models became unsustainable.
Open source reshapes this economic reality by providing high-performance alternatives for data storage and visualization.
- Metrics: Prometheus and its long-term storage counterparts like Thanos and Grafana Mimir allow for massive scale at the cost of infrastructure, not per-metric licensing.
- Logs: The transition from the ELK stack (Elasticsearch, Logstash, Kibana) to more resource-efficient tools like Grafana Loki has reduced logging costs by up to 80% for many enterprises. Loki’s "index the metadata, not the full text" approach is particularly well-suited for the high-volume logging requirements of 2026.
- Visualizations: Grafana remains the undisputed standard for dashboarding, capable of pulling data from hundreds of different sources simultaneously.
By using these open source tools, companies can choose where to spend their money. They might use open source for "boring" high-volume data (like standard infrastructure metrics) and reserve their budget for high-value proprietary analytics for their most critical customer-facing transactions.
The Rise of eBPF-Powered Observability
One of the most technically profound ways open source is reshaping observability is through eBPF (Extended Berkeley Packet Filter). This technology allows programs to run in the Linux kernel without changing kernel source code or loading modules.
In the context of application monitoring, eBPF enables "zero-code" instrumentation. Traditionally, to get deep visibility into an application, you had to add a library to the code and redeploy it. With open source projects like Cilium, Pixie, and Groundcover, observability agents can sit at the kernel level and observe every network call, function execution, and system error across the entire node.
This has several transformative effects:
- Low Overhead: Because the monitoring happens in the kernel, it is significantly more efficient than sidecar proxies or heavy language-specific agents.
- Universal Coverage: It doesn't matter if an application is written in Go, Rust, Java, or a legacy language; eBPF sees it all.
- Security Integration: Observability is merging with security (often called "Observability-Driven Security"). eBPF allows teams to monitor for unexpected system calls or network connections that might indicate a breach, all within the same toolset used for performance monitoring.
Comparative Analysis: Open Source vs. Proprietary Observability
| Feature | Open Source (e.g., OTel + Prometheus + Grafana) | Proprietary (SaaS-Only Solutions) |
|---|---|---|
| Data Ownership | Full control; data stays on your infrastructure. | Data resides in the vendor's cloud. |
| Vendor Lock-in | Low; easily swap backends using OTLP. | High; proprietary agents are hard to remove. |
| Innovation Speed | Rapid; driven by thousands of global contributors. | Dependent on the vendor's roadmap. |
| Cost Structure | Infrastructure + Engineering time. | Licensing fees + Data ingestion/storage fees. |
| Instrumentation | Standardized (OpenTelemetry). | Often requires proprietary SDKs. |
| Customization | Infinite; code can be modified as needed. | Limited to provided APIs and features. |
Implementation Challenges and Solutions
While open source offers immense power, it is not a "free" solution. Reshaping an organization's observability strategy requires a shift in engineering culture.
Complexity and Maintenance
The "DIY" nature of open source means your team is responsible for uptime, patching, and scaling the observability stack itself. In 2026, many organizations solve this by using Managed Open Source. This is a hybrid approach where you use standard open source protocols (like OTel and Prometheus) but pay a provider to host the heavy storage backends. This provides the best of both worlds: no vendor lock-in at the application level, but no operational headache at the infrastructure level.
The Learning Curve
OpenTelemetry is a vast project with a steep learning curve. Organizations must invest in training their "Platform Engineering" teams to manage these pipelines effectively. The focus shifts from "how do I use this tool" to "how do I manage our telemetry data as a product."
Data Governance
With great power comes great responsibility. Open source tools give you access to more data than ever before, but without proper governance, this can lead to "data lakes" becoming "data swamps." Successful teams implement Attribute-Based Access Control (ABAC) and strict tagging standards to ensure that telemetry data remains searchable and useful.
FAQs
What is the primary difference between APM and Observability?
APM (Application Performance Monitoring) is a subset of observability focused specifically on the health and performance of application code. Observability is a broader concept that includes the entire system—infrastructure, network, external dependencies, and application code—providing the context needed to debug complex, distributed "unknown unknowns."
Why is OpenTelemetry considered the standard in 2026?
OpenTelemetry achieved "critical mass" because it was backed by every major cloud provider (AWS, Azure, GCP) and hundreds of software vendors. It provides a single, unified specification for telemetry, which ended the fragmentation that previously forced developers to choose between competing, incompatible standards.
Can open source tools handle the same scale as proprietary ones?
Yes. Projects like Grafana Mimir and VictoriaMetrics are designed specifically for "web-scale" environments, capable of handling hundreds of millions of active series. Many of the world's largest technology companies run their entire monitoring infrastructure on these open source foundations.
Does using open source monitoring improve application security?
Indirectly, yes. Open source observability provides deeper transparency into system behavior. By using eBPF-based tools, teams can see exactly which processes are communicating with each other, making it much easier to identify anomalous behavior that could indicate a security threat or a misconfiguration.
Is it cheaper to run open source monitoring?
It depends on the scale and the team's expertise. While you save on licensing fees, you incur costs for cloud storage, compute, and the engineering hours required to maintain the system. For small startups, a SaaS tool might be cheaper; for large enterprises with high data volumes, open source almost always results in significant long-term savings.
Strategic Recommendations for 2026
To leverage the reshaping of observability through open source, organizations should adopt a phased approach:
- Adopt OpenTelemetry Now: Stop using proprietary agents. Even if you continue using a SaaS backend, instrument your applications with OTel SDKs. This ensures your data is portable and future-proof.
- Implement an Observability Pipeline: Use an OpenTelemetry Collector to sit between your applications and your storage backends. This gives you the power to route, filter, and sample data based on business needs and budget.
- Explore eBPF for Infrastructure Visibility: If you are running Kubernetes, look into eBPF-based tools for network and security observability. The insights gained at the kernel level are often far more accurate and less intrusive than traditional logging methods.
- Invest in Platform Engineering: Treat observability as an internal product. Assign a dedicated team to manage the telemetry lifecycle, ensuring that developers have the tools they need to debug their own services without becoming experts in the underlying monitoring infrastructure.
By embracing the open source revolution, companies move away from being passive consumers of monitoring tools to active participants in a global ecosystem of reliability engineering.
Image Gallery
Select an image to open it in a new tab.


Celine Dubois
Contemporary Living and Global Arts Columnist
