Fibonacci Retracements Explained: A Guide to Technical Market Analysis

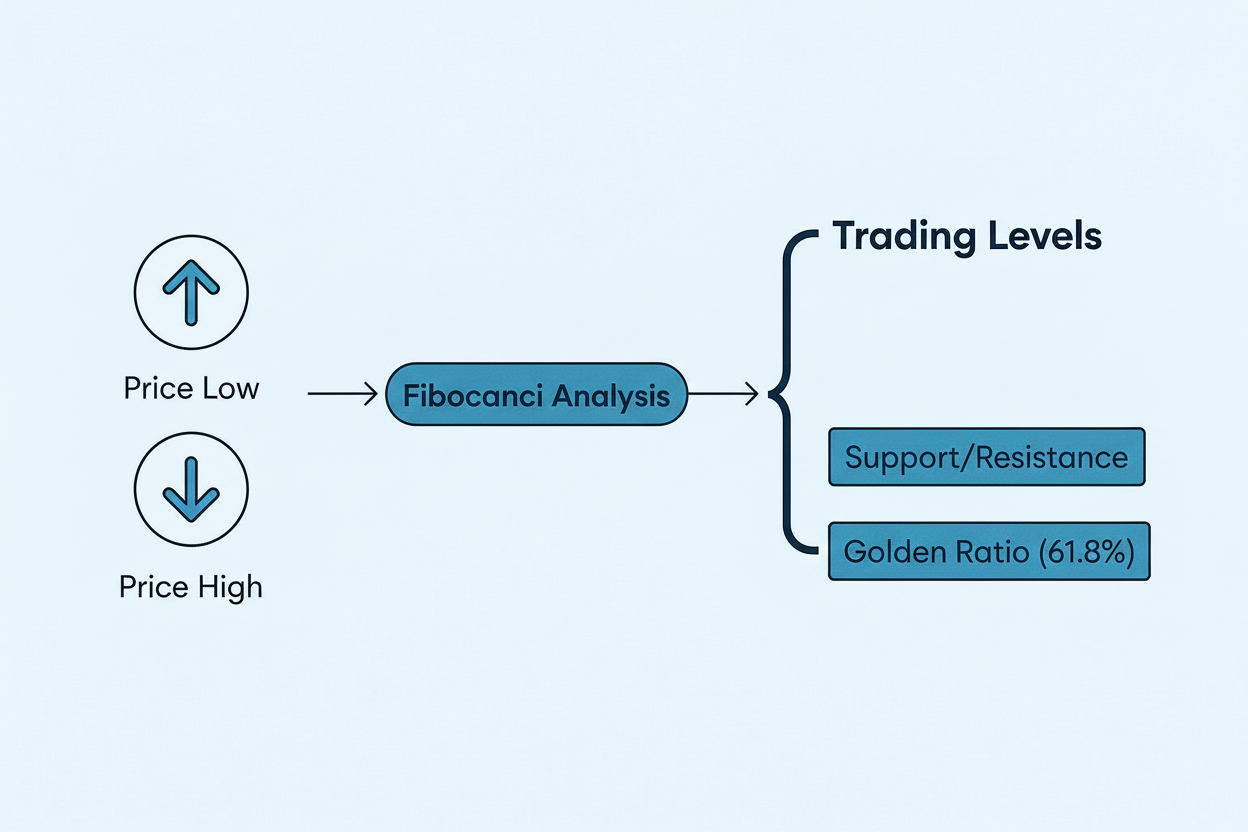
Fibonacci retracements are a technical analysis tool used by traders to identify potential support and resistance levels during market trends. By plotting horizontal lines at specific ratios derived from the Fibonacci sequence—most notably 38.2%, 50%, and 61.8%—investors attempt to predict where price pullbacks may conclude before the dominant trend resumes.
The Mathematical Foundation of Fibonacci Retracements
The tool is named after Leonardo of Pisa, known as Fibonacci, a 13th-century mathematician who introduced the Fibonacci sequence to Western mathematics. This sequence starts with 0 and 1, where each subsequent number is the sum of the two preceding numbers (0, 1, 1, 2, 3, 5, 8, 13, 21, 34, 55, 89, 144, and so on).
In technical analysis, the significance of these numbers lies in the ratios between them. As the sequence progresses, the ratio of any number to the one succeeding it approaches 0.618, known as the "Golden Ratio" or Phi. Conversely, the ratio of a number to the one two places ahead approaches 0.382. While 50% is not technically a Fibonacci ratio, it is widely utilized in Dow Theory and market analysis as a key retracement marker. These percentages act as a mathematical framework that many market participants believe reflects human collective psychology, leading to self-fulfilling prophecies of support and resistance.
How to Properly Apply Fibonacci Retracements
To use the tool, you must first identify a clear trend. The Fibonacci retracement tool is not designed for sideways or range-bound markets; it is a trend-following instrument.
- Identify the Swing High and Swing Low: In an uptrend, locate the lowest point (swing low) and the highest point (swing high) of the current price move. In a downtrend, locate the highest point and the lowest point.
- Draw the Tool: Connect these two points using your trading platform’s drawing tool. The platform will automatically calculate the horizontal lines based on the vertical distance between these two points.
- Analyze the Zones: The lines generated are the potential areas where the price may pause or reverse. In a strong uptrend, for instance, a trader looks for the price to drop into the "Golden Pocket"—typically the area between the 50% and 61.8% retracement levels—before potentially bouncing higher.
Key Retracement Levels and Their Market Significance
Understanding what happens at each level is crucial for effective risk management. Each level serves as a hypothetical "zone of interest" rather than a precise price point.
- 23.6% Level: This is considered a shallow retracement. It often occurs in very strong trends where the market is impatient to continue the move. It is less reliable for entry but indicates significant momentum.
- 38.2% Level: A common retracement point in trends that are healthy and sustainable. If the price holds here, it suggests the trend remains robust.
- 50% Level: Though not a Fibonacci number, the 50% retracement is essential. It represents the midpoint of the previous move. If a trend cannot hold the halfway mark, the probability of a full trend reversal increases significantly.
- 61.8% Level: Often called the "Golden Ratio," this is arguably the most watched level by institutional traders. A successful bounce from this level is seen as a strong confirmation of the original trend.
- 78.6% Level: This level is used as a final line of defense. If the price breaks below this point, the likelihood of a complete retracement to the original starting point (0% or 100%) becomes very high.
Table: Fibonacci Retracement Levels and Market Sentiment
| Retracement Level | Market Sentiment Significance | Trading Implication |
|---|---|---|
| 23.6% | Strong momentum; slight pause | Hold current position; trend is very strong |
| 38.2% | Standard correction; trend remains intact | Watch for consolidation; potential add-on |
| 50.0% | Equilibrium reached; key psychological level | Evaluate trend validity; watch for support |
| 61.8% | Major area of interest; institutional buying | High probability of reversal; prime entry zone |
| 78.6% | Final support before full reversal | Risk of trend failure; stop-loss proximity |
Common Mistakes and Strategic Limitations
A common pitfall for new traders is relying exclusively on Fibonacci retracements. The tool is a supplementary indicator, not a standalone trading system. It must be used in conjunction with other confirming indicators such as volume analysis, moving averages, or candlestick patterns.
Another frequent error is drawing the tool over irrelevant timeframes. Fibonacci levels are most effective when applied to clear, recognizable swing highs and lows on higher timeframes (such as the daily or weekly charts), where the noise of day trading is minimized. Furthermore, traders often treat these levels as absolute barriers. In reality, market price often "wicks" through these lines, triggering stop-losses before moving in the intended direction. Consequently, it is better to view these as zones rather than thin lines.
Incorporating Confluence for Better Accuracy
Confluence occurs when two or more technical indicators provide the same signal at the same price level. For instance, if the 61.8% Fibonacci retracement level coincides exactly with a previous support level or a 200-day moving average, the probability of that level holding is statistically higher.
Advanced traders often combine Fibonacci retracements with Fibonacci extensions to establish profit targets. While retracements look backward to find support, extensions look forward to estimate where the price might travel once it breaks beyond previous highs or lows. By layering these tools, a trader can develop a comprehensive map of the market's potential trajectory.
Frequently Asked Questions
Does the Fibonacci retracement tool work in every market? It is most effective in liquid markets such as major currency pairs, high-volume indices, and popular equities. Because the tool relies on the participation of a large number of traders to become a "self-fulfilling prophecy," it may be less reliable in low-volume or highly illiquid assets where single large orders can override technical patterns.
What is the best timeframe to use for Fibonacci analysis? There is no single "best" timeframe. However, institutional traders often prioritize daily, weekly, and monthly charts. Using these higher timeframes helps filter out market "noise," providing a more reliable foundation for long-term trend analysis.
Why does the 50% level get included if it is not a Fibonacci number? The 50% level is included due to its historical importance in price theory, particularly Dow Theory, which posits that a healthy market correction typically retraces half of the previous move. Even if not mathematically derived from the Fibonacci sequence, it is treated with equal importance by automated trading algorithms and human traders.
How do I handle "fakeouts" at Fibonacci levels? Fakeouts occur when price briefly pierces a level before returning to the trend. To mitigate this risk, traders often place stop-loss orders slightly beyond the next Fibonacci level, rather than right on the level itself, allowing for minor volatility.
Can I use Fibonacci retracements for short-selling? Yes. The process is the mirror image of a long position. You would plot the tool from the swing high down to the swing low during a downtrend. The resulting levels act as resistance, where traders look for potential entry points to enter short positions.
Practical Recommendation
To begin, practice identifying clear, non-overlapping swing highs and lows on historical charts of major assets. Do not initiate live trades based on Fibonacci retracements alone. Instead, identify a "zone of confluence" where a Fibonacci level aligns with a clear horizontal support or resistance level or a significant moving average. Backtest this approach to observe how price reacts in your specific market before risking capital.

Image Gallery
Select an image to open it in a new tab.


Simon Caldwell
Enterprise Technology and Systems Editor
