What Tools Do Meteorologists Use?

Meteorologists use a sophisticated suite of instruments ranging from ground-based weather stations and Doppler radar networks to high-altitude radiosondes, environmental satellites, and advanced supercomputing systems to observe, analyze, and predict Earth's atmospheric conditions.
Introduction to Modern Meteorological Instrumentation
The science of meteorology relies on the continuous collection and synthesis of vast amounts of atmospheric data. Whether tracking a localized severe thunderstorm or modeling a global climate shift, modern meteorologists cannot rely on intuition or simple observation alone. They deploy a multidisciplinary array of specialized tools designed to measure physical properties such as temperature, pressure, humidity, wind velocity, precipitation type, and atmospheric composition.
Understanding what tools meteorologists use requires looking at how data flows from the point of observation to the computer model and finally to the forecaster's screen. This technological ecosystem bridges classical physics, electronics, aerospace engineering, and computational science. By breaking down these instruments into distinct categories—surface observation, upper-air measurement, remote sensing, and computational analysis—we can explore the backbone of modern weather forecasting and severe weather warning systems.
Surface-Based Observation Systems
Surface observations form the baseline of all meteorological analysis. These instruments sit directly in the environment where human activity takes place, capturing real-time changes in local weather conditions.
Automated Weather Stations (AWS)
Automated Surface Observing Systems (ASOS) and Automated Weather Observing Systems (AWOS)—such as those operated jointly by the National Weather Service (NWS), the Federal Aviation Administration (FAA), and the Department of Defense in the United States—serve as the primary source of surface data. An automated weather station integrates several sensors into a single node:
- Thermometers: Measure ambient air temperature and dew point, typically housed in a ventilated, radiation-shielded enclosure to prevent solar heating skewing the results.
- Barometers: Utilize electronic or aneroid barometers to measure atmospheric pressure changes, which indicate approaching high- or low-pressure systems.
- Anemometers and Wind Vanes: Cup or propeller anemometers measure wind speed, while wind vanes track wind direction. Sonic anemometers are increasingly used for high-precision, moving-part-free measurements.
- Rain Gauges: Tipping-bucket gauges measure liquid precipitation by funneling water into a rocking mechanism that counts each millimeter or hundredth of an inch.
- Hygrometers: Measure relative humidity, often utilizing capacitive sensors that change electrical capacitance as they absorb moisture from the air.
Specialized Surface Sensors
Beyond standard weather stations, specialized surface instruments monitor complex environmental dynamics. Ceilometers use laser pulses to determine cloud height and vertical visibility, which is critical for aviation safety. Present-weather sensors use optical forward-scatter technology to distinguish between rain, snow, drizzle, and fog automatically. Soil moisture probes and solar radiation sensors (pyranometers) provide vital agricultural and hydrological data.

Upper-Air Sounding and Atmospheric Profiling
Surface weather represents only the bottom boundary layer of the atmosphere. To understand how weather systems develop, strengthen, or dissipate, meteorologists must examine the vertical column of the atmosphere—known as the upper air.
- Upper-Air Atmosphere (Troposphere / Stratosphere)
- Radiosonde Data Transmitted via Radio Waves
- Weather Balloon / Balloon-Borne Instrument Package
- Launched twice daily globally
- Surface Launch Site
- Launched twice daily globally
- Weather Balloon / Balloon-Borne Instrument Package
- Radiosonde Data Transmitted via Radio Waves
Radiosondes and Weather Balloons
The radiosonde is a small, disposable instrument package suspended below a large weather balloon filled with hydrogen or helium. As the balloon ascends through the troposphere and into the stratosphere—often reaching altitudes exceeding 35,000 meters (115,000 feet)—the radiosonde measures:
- Vertical temperature profiles
- Atmospheric pressure decreases with height
- Humidity gradients
- Wind speed and direction via GPS tracking
Meteorological agencies worldwide launch weather balloons simultaneously twice a day, at 00:00 and 12:00 Coordinated Universal Time (UTC), feeding critical data into global numerical weather prediction models.
Dropsonde Technology
While radiosondes ascend from the ground, dropsondes are deployed downward. Reconnaissance aircraft, such as the United States Air Force Reserve 53rd Weather Reconnaissance Squadron ("Hurricane Hunters"), drop these cylindrical instrument packages directly into active tropical cyclones, severe winter storms, and remote oceanic regions. As the dropsonde parachutes to the surface, it transmits high-resolution vertical profiles of pressure, temperature, humidity, and wind velocity back to the aircraft.
Remote Sensing: Radar and Satellites
Remote sensing allows meteorologists to observe atmospheric phenomena from a distance, covering vast geographic areas that surface stations and balloons cannot reach.
Doppler Weather Radar
Radar (Radio Detection and Ranging) is the cornerstone of short-term forecasting and severe weather warning operations. Systems such as the United States WSR-88D (Weather Surveillance Radar-1988 Doppler) emit pulses of microwave energy into the atmosphere. When these pulses strike precipitation particles (such as rain, snow, hail, or sleet), the energy bounces back as an echo.
- Reflectivity: Measures the intensity of the precipitation echo, helping forecasters gauge storm intensity and rainfall rates.
- Doppler Velocity: Measures the frequency shift of the returning signal caused by the motion of precipitation particles toward or away from the radar. This allows meteorologists to detect wind shear, rotation within supercell thunderstorms, and the formation of tornadoes before they touch down.
- Dual-Polarization Technology: Emits both horizontal and vertical pulses, allowing radar systems to determine the shape, size, and variety of precipitation particles, distinguishing heavy rain from hail or debris balls lofted by a tornado.
Meteorological Satellites
Weather satellites operate from two primary orbits, providing a planetary-scale perspective:
- Geostationary Satellites (GOES): Orbit Earth at an altitude of approximately 35,786 kilometers (22,236 miles) above the equator, matching Earth's rotational speed. This allows them to hover continuously over a fixed geographic region, providing high-frequency imagery (every 1 to 5 minutes) of cloud development, storm tracking, and moisture transport.
- Polar-Orbiting Satellites (POES): Circle Earth at much lower altitudes in north-south orbits, passing near the poles. As Earth rotates underneath them, these satellites image the entire globe twice daily, providing high-resolution atmospheric sounding data, sea surface temperatures, and polar ice coverage.
Comparison of Core Meteorological Data Sources
The following table summarizes the primary tools meteorologists use, their operational range, and their primary data outputs.
| Instrument Category | Primary Tool Examples | Typical Deployment / Range | Core Data Output |
|---|---|---|---|
| Surface Observation | ASOS, AWOS, Weather Stations | Localized ground sites, airports | Temperature, pressure, wind, rain accumulation |
| Upper-Air Profiling | Radiosondes, Dropsondes | Vertical column up to 35km+ altitude | Vertical temperature, humidity, and wind gradients |
| Remote Sensing (Active) | Doppler Radar (WSR-88D) | Up to 250+ kilometers radius | Precipitation intensity, storm rotation, wind velocity |
| Remote Sensing (Passive) | Geostationary & Polar Satellites | Regional to global orbital coverage | Cloud imagery, water vapor, surface temperatures |
| Computational Analysis | Supercomputers, Numerical Models | Centralized meteorological facilities | Atmospheric simulations, probabilistic forecasts |
Supercomputers and Numerical Weather Prediction
All the observational data gathered by ground stations, balloons, radar, and satellites is useless without a way to process it. Modern meteorology is fundamentally computational.
Numerical Weather Prediction (NWP) Models
Forecasters input billions of observations into complex mathematical equations based on fluid dynamics, thermodynamics, and radiative transfer. These equations describe how the atmosphere behaves, how heat moves, and how fluids flow. Because these equations are nonlinear and exceptionally complex, they require immense computing power to solve.
Major forecasting centers—such as the National Centers for Environmental Prediction (NCEP) in the United States, the European Centre for Medium-Range Weather Forecasts (ECMWF), and the UK Met Office—run global models like the Global Forecast System (GFS) and the Integrated Forecasting System (IFS).
Ensemble Forecasting
To account for the chaotic nature of the atmosphere and uncertainties in initial data collection, meteorologists run ensemble forecasts. Instead of running a model once, supercomputers run dozens of simulations simultaneously, each with slightly perturbed initial conditions or varied physics parameters. If all ensemble members project the same storm path, confidence is high. If the members diverge wildly, forecasters know that the forecast carries high uncertainty, prompting them to communicate probabilistic outcomes rather than definitive certainties.
Visualization and Forecaster Workstations
Once supercomputers crunch model data and observations, human meteorologists interpret the outputs using specialized meteorological workstations.
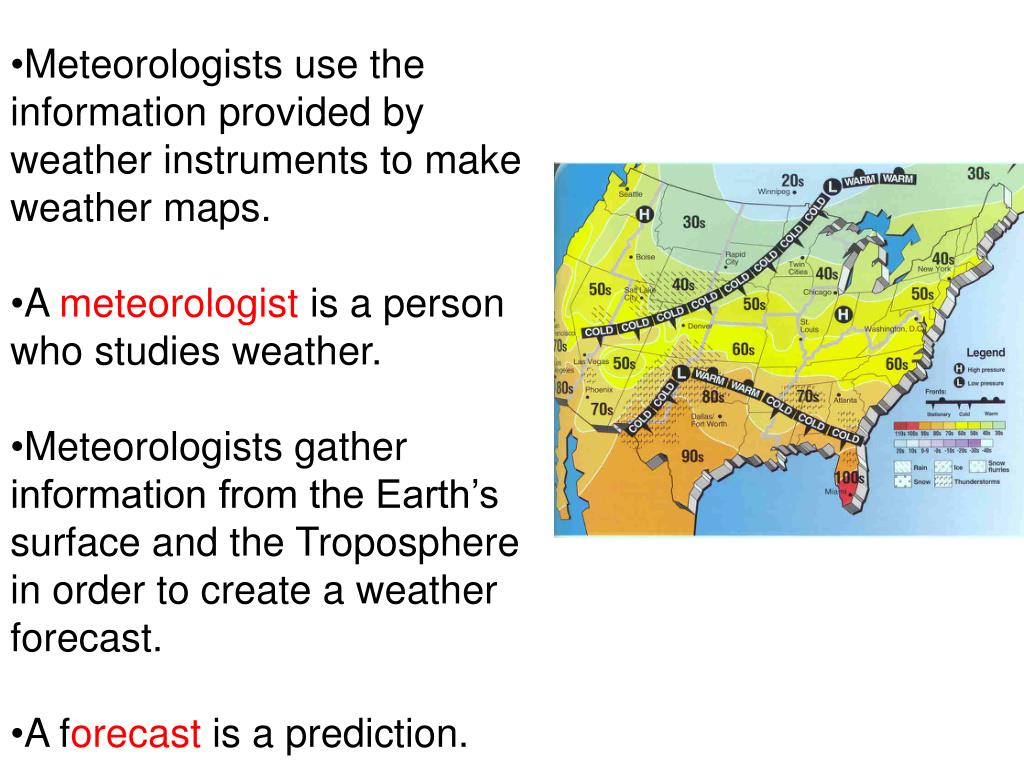
Software suites such as AWIPS (Advanced Weather Interactive Processing System), utilized by the National Weather Service, allow forecasters to overlay disparate data streams in real time. A forecaster can view Doppler radar reflectivity over a map of surface station wind vectors, overlay satellite water vapor channels, and slice through model cross-sections to analyze instability indices, jet stream positions, and atmospheric moisture convergence. These workstations enable forecasters to issue timely tornado warnings, flash flood advisories, and aviation alerts.
Common Challenges and Limitations in Meteorological Tools
Despite rapid technological advancements, meteorological tools face operational limitations that can impact forecast accuracy:
- Data Deserts: Oceans, deserts, and high mountain ranges lack dense surface station networks and require heavy reliance on satellite remote sensing and dropsondes.
- Radar Beam Blockage: Mountainous terrain can block or distort radar beams, creating "radar blind spots" in valleys.
- Model Parameterization: Processes smaller than a model's grid resolution—such as individual cloud microphysics or convective updrafts—must be approximated (parameterized), introducing potential errors into numerical forecasts.
- Severe Weather Timing: Rapidly developing microbursts or sudden flash floods can evolve faster than radar scanning cycles or model update frequencies allow.
Frequently Asked Questions
How do meteorologists measure upper-air conditions without physical stations?
Meteorologists launch weather balloons carrying radiosondes twice daily across hundreds of global sites. For remote oceans and storm interiors, aircraft deploy dropsondes that collect vertical atmospheric data as they parachute down to the surface.
What is the difference between weather radar and weather satellites?
Weather radar is an active ground-based instrument that emits microwave pulses to detect precipitation, storm structure, and rotation within a regional radius. Weather satellites are passive or active orbital platforms that view Earth from space to track large-scale cloud patterns, moisture, and global weather systems.
Why do weather forecasts differ between various computer models?
Different models use distinct mathematical algorithms, physics approximations, and initial datasets. For instance, the European model (ECMWF) and the American model (GFS) process data differently, which can result in divergent predictions for complex storm tracks.
How do supercomputers help predict the weather?
Supercomputers ingest billions of global observations and solve complex fluid dynamics and thermodynamic equations. By calculating how the atmosphere will evolve over time, they generate numerical weather prediction models that project future conditions.
Can meteorologists predict weather perfectly with these tools?
No. The atmosphere is a chaotic fluid system governed by non-linear dynamics. While modern tools have dramatically increased forecast accuracy and severe weather lead times, inherent atmospheric chaos limits the absolute predictability of weather beyond roughly two weeks.
Next Actions for Weather Enthusiasts and Students
If you want to explore meteorology tools firsthand, several accessible paths exist. Amateur weather enthusiasts can install personal Automated Weather Stations (AWS) connected to networks like the Citizen Weather Observer Program (CWOP) or Weather Underground. Students and professionals can access live, raw meteorological data, sounding plots, and model outputs freely through portals like the National Weather Service (weather.gov) or tropical tracking platforms like the National Hurricane Center.
Image Gallery
Select an image to open it in a new tab.

Celine Dubois
Contemporary Living and Global Arts Columnist
