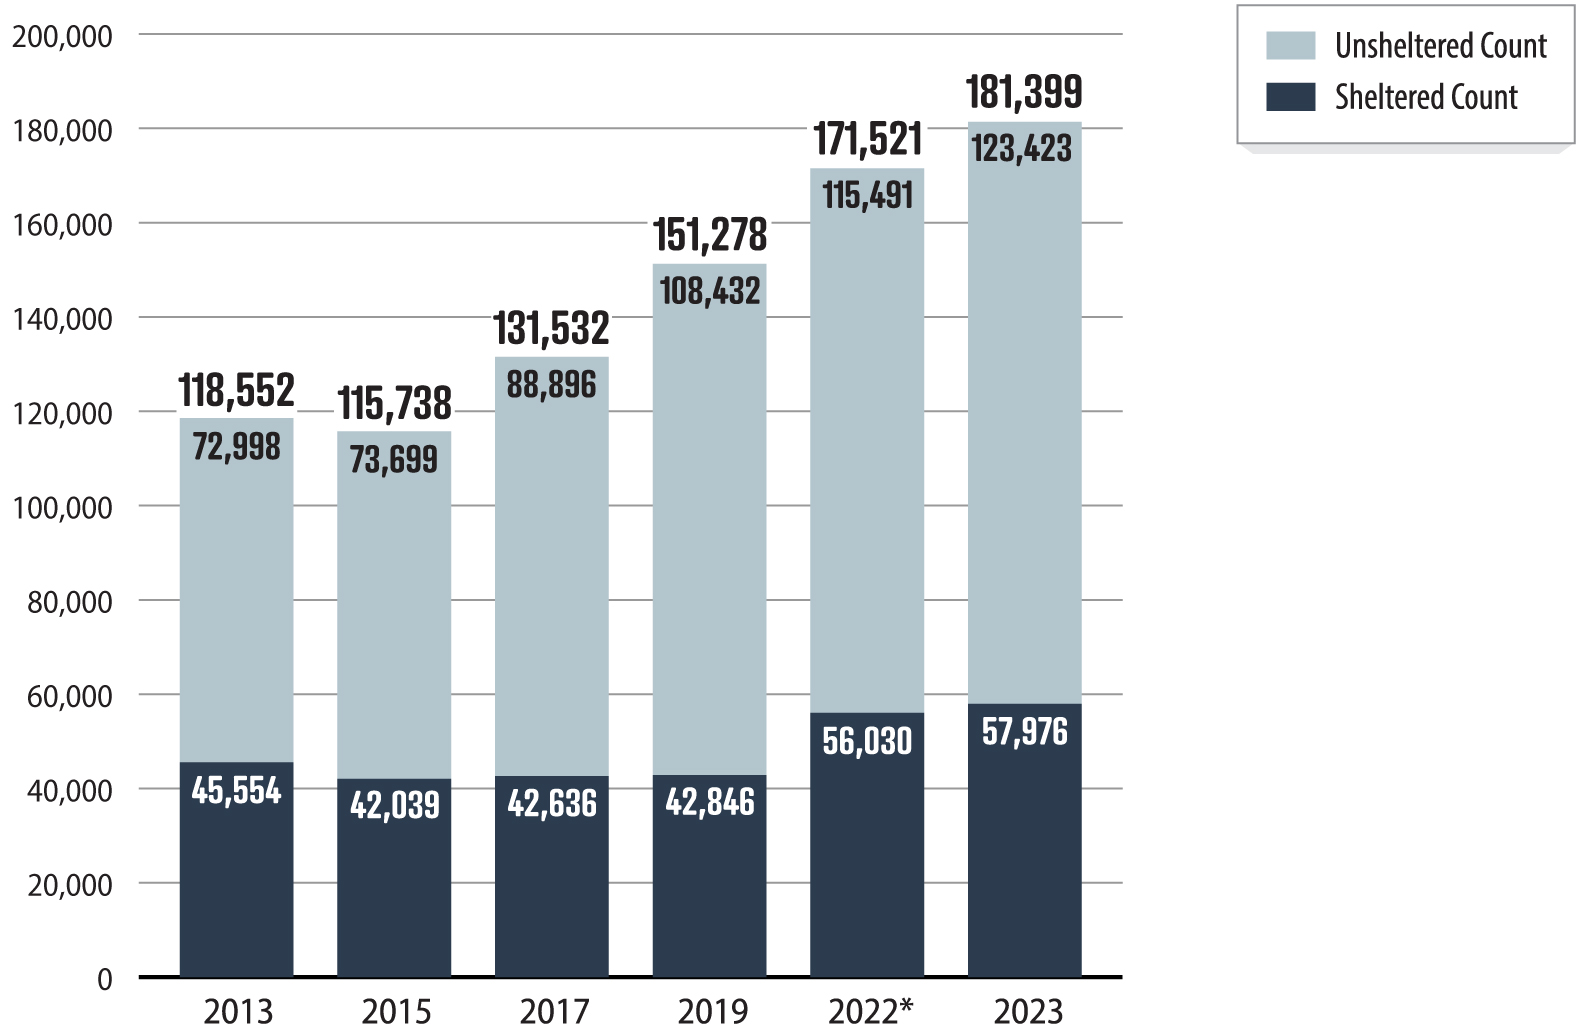
According to official federal counts from the U.S. Department of Housing and Urban Development, between 653,000 and 770,000 people experience homelessness on any given night in the United States. Over the course of a full year, service provider data estimates that more than 1.5 million individuals experience temporary or long-term unhoused conditions nationwide.
Understanding Federal Homelessness Data: PIT Count vs. Annual Estimates
To accurately evaluate how many unhoused people reside in the United States, it is essential to distinguish between a single-night snapshot and annual service population counts. Federal agencies and social researchers utilize different reporting metrics depending on whether they are measuring immediate shelter capacity, long-term trends, or public school student displacement.
The primary benchmark for federal funding and housing policy is the Point-in-Time (PIT) count, mandated by the U.S. Department of Housing and Urban Development (HUD). The PIT count is a physical survey conducted by local agencies across the country during the last ten days of January each year. Local administrative networks, known as Continuums of Care (CoCs), coordinate thousands of volunteers and outreach workers to tally every individual staying in emergency shelters, transitional housing programs, or unsheltered locations such as cars, encampments, and abandoned buildings.
While the PIT count provides an indispensable annual baseline, it captures only a snapshot of a single night. Because people cycle into and out of housing insecurity throughout the year, the total number of individuals who experience homelessness over 12 months is significantly higher. Administrative data collected through the Homeless Management Information System (HMIS) and analyzed in HUD’s Annual Homeless Assessment Report (AHAR) Part 2 shows that roughly 1.2 to 1.5 million people use emergency shelter or transitional housing facilities over the course of a calendar year.
Furthermore, the U.S. Department of Education maintains a broader definition of homelessness under the McKinney-Vento Homeless Assistance Act. For public education monitoring, homelessness includes children and youth who lack a fixed, regular, and adequate nighttime residence, including families forced to live "doubled up" with friends or relatives due to economic hardship. Under this broader definition, public school districts report more than 1.2 million unhoused students annually.
Total Annual Housing Insecurity Continuum:
- HUD Point-in-Time (PIT) Snapshot (~653,000 - 770,000)
- Sheltered (Shelters/Transitional)
- Unsheltered (Streets/Vehicles)
- Single-night January census
- Education & Annual Service Data (1.2M - 1.5M+ People)
- Annual shelter system users
- Doubled-up / Couch-surfing
- McKinney-Vento school data
Demographic Breakdown of the Unhoused Population
Homelessness in the United States affects diverse demographic groups, each facing distinct economic, social, and structural challenges. Analyzing these subgroups allows policy makers and local organizations to tailor intervention strategies, such as supportive housing for individuals with severe disabilities or rental subsidies for working families.
Individuals vs. Families with Children
Single adults represent the largest proportion of the unhoused population. Approximately 68% to 70% of unhoused people counted during annual PIT surveys are single individuals. The remaining 30% to 32% consist of people in families with children.
Family homelessness is predominantly sheltered. More than 85% of unhoused families reside in emergency shelters or transitional housing facilities, driven partly by municipal family shelter mandates and child welfare interventions. In contrast, single individuals experience unsheltered homelessness at far higher rates, with nearly half residing in locations not intended for human habitation.
Chronically Homeless Individuals
HUD defines chronic homelessness as applying to an unhoused individual with a disabling condition—such as a severe mental illness, chronic physical illness, or substance use disorder—who has been continuously unhoused for at least 12 months, or who has experienced at least four separate episodes of homelessness over the past three years totaling 12 months.
Chronically homeless individuals represent roughly 30% of the total unhoused individual population. Although smaller in total numbers compared to situationally unhoused individuals, this population requires intensive resources, including Permanent Supportive Housing (PSH) that pairs subsidized lease agreements with medical and social case management.
Veterans Experiencing Homelessness
Targeted federal investments, joint programs between HUD and the Department of Veterans Affairs (such as the HUD-VASH voucher initiative), and community-level coordinates have yielded significant reductions in veteran homelessness over the past decade. Currently, between 35,000 and 37,000 military veterans experience homelessness on any given night. Despite overall progress, veterans remain overrepresented within the unhoused population relative to their share of the general U.S. adult demographic.
Unaccompanied Youth and Young Adults
Unaccompanied youth—defined as individuals under the age of 25 who are not accompanied by a parent or guardian—account for approximately 34,000 to 40,000 unhoused persons in annual snapshot counts. A significant portion of this population consists of youth aging out of foster care systems, LGBTQ+ youth fleeing unsupportive households, and young adults experiencing sudden domestic disruption.
Racial and Ethnic Disparities
Racial inequities are prominent in U.S. homelessness data. Systemic disparities in housing access, generational wealth accumulation, criminal justice outcomes, and health coverage contribute to disproportionate representation among racial minorities:
- Black/African American: Represents approximately 37% to 40% of the unhoused population, despite accounting for roughly 13.6% of the general U.S. population.
- Hispanic/Latino: Represents approximately 24% to 28% of the unhoused population, showing notable increases in recent years due to severe housing affordability pressures in high-cost states like California, Florida, and Texas.
- Indigenous and Native American: Native Americans, Alaska Natives, and Native Hawaiians experience the highest rates of homelessness per capita of any racial group, frequently compounded by severe housing shortages on tribal lands and urban reservation boundaries.

National Snapshot: Homelessness Demographics and Housing Status
The table below synthesizes demographic and operational distributions based on recent nationwide HUD Exchange Homelessness Data reports and federal statistical summaries.
| Demographic Category / Subgroup | Estimated Single-Night Count | Share of Total Unhoused Population | Primary Setting & Key Structural Characteristics |
|---|---|---|---|
| Total Unhoused Population (PIT Snapshot) | 653,104 – 770,000+ | 100% | Snapshot across all Continuums of Care (CoCs) nationwide |
| Sheltered Population | 390,000 – 435,000 | ~60% – 63% | Emergency shelters, safe havens, and transitional housing |
| Unsheltered Population | 260,000 – 335,000 | ~37% – 40% | Vehicles, tents, parks, sidewalk encampments, abandoned buildings |
| Single Individuals | 460,000 – 520,000 | ~68% – 70% | High unsheltered rate; higher prevalence of chronic disability |
| People in Families with Children | 190,000 – 250,000 | ~30% – 32% | Overwhelmingly sheltered (>85%); tied to acute rent burden |
| Chronically Homeless Individuals | 140,000 – 175,000 | ~22% – 25% | Disabling conditions with long-term or repeated unhoused episodes |
| Military Veterans | 35,000 – 37,500 | ~5% – 6% | Beneficiaries of targeted HUD-VASH vouchers; predominantly male |
| Unaccompanied Youth (<25) | 34,000 – 40,000 | ~5% | Overrepresented by foster youth and LGBTQ+ young adults |
Geographic Distribution Across States and Major Cities
Homelessness in America is geographically concentrated, heavily influenced by state-level housing supply, regional income inequality, local safety net investments, and weather patterns.
Regional Rates of Unsheltered vs. Sheltered Homelessness:
- Western States (e.g., CA, OR, WA)
- High proportion UNSHELTERED (>60-70%)
- Severe affordable housing deficits
- Mild winter climates in coastal zones
- Eastern States (e.g., NY, MA)
- High proportion SHELTERED (>80-90%)
- Municipal right-to-shelter legal rules
- Extreme winter weather protection
High-Concentration States
Five states account for more than half of the entire unhoused population in the United States:
- California: Contains the largest unhoused population in the country, exceeding 180,000 individuals. California also exhibits the highest unsheltered rate, with over 65% of its unhoused population living outside of formal shelter structures due to structural housing deficits and high land costs.
- New York: Registers over 100,000 unhoused individuals. In contrast to California, New York shelters more than 85% of its unhoused population, primarily due to New York City’s legal "right-to-shelter" mandate established by court consent decrees.
- Florida: Reports between 27,000 and 31,000 unhoused residents, with significant unsheltered populations across coastal metro areas.
- Washington: Accounts for roughly 28,000 unhoused individuals, driven by rapid housing cost increases across the Puget Sound region.
- Texas: Registers approximately 27,000 unhoused people. Despite population growth, major cities like Houston have mitigated unhoused population growth through aggressive encampment conversion and Housing First re-housing pipelines.
Urban vs. Rural Homelessness
While major metropolitan areas (such as Los Angeles, New York City, Seattle, San Jose, and Chicago) house the vast majority of unhoused individuals in absolute numbers, homelessness is a severe issue in rural communities as well. Rural unhoused populations are often less visible because individuals are more likely to double up in overcrowded structures, inhabit substandard trailers without utilities, or encamp on public forest lands. Rural areas also face severe shortages of emergency shelter infrastructure, social services, and public transportation.
Primary Drivers of Homelessness in America
Economic research demonstrates that regional housing market conditions are the single primary predictor of local homelessness rates. While personal challenges—such as physical illness, job loss, domestic violence, or behavioral health disorders—act as individual vulnerability factors, macro-level housing metrics dictate how many people enter homelessness overall.
| Economic & Supply Factors | Systemic Policy Shifts | Personal & Healthcare Vulnerability |
|---|---|---|
| • Severe supply deficits• Rent-to-income spikes• Low-wage stagnation | • Expiration of emergency rental assistance• Zoning/land use limits | • Behavioral health gaps• Medical bankruptcy• Domestic abuse dislocation |
Housing Supply and Affordability Deficits
The primary cause of expanding homelessness in the United States is a severe shortage of affordable and available homes. The National Low Income Housing Coalition calculates that the U.S. has a deficit of over 7 million affordable rental homes for extremely low-income renters (those earning at or below the poverty guideline or 30% of their area median income).
When housing supply fails to keep pace with demand, rents escalate rapidly. Economic studies show that in high-cost metro areas, every median rent increase of $100 per month correlates with a measurable 9% to 15% increase in local homelessness rates. When low-wage households spend more than 50% of their gross income on rent, a single unexpected medical bill or automotive repair can trigger eviction and housing loss.
Expiration of Temporary Safety Nets
The expiration of pandemic-era emergency measures—including emergency rental assistance allocations, enhanced child tax credits, and court-ordered eviction moratoria—placed severe financial strain on low-income households. As these temporary protections ended, eviction filings returned to or surpassed pre-2020 levels across major metropolitan court systems, accelerating inflows into municipal shelter systems.
Systemic Health and Social Drivers
Personal crises interact with affordable housing shortages to create acute housing loss:
- Behavioral Health Gaps: Mental illness and substance use disorders do not inherently cause homelessness on a national scale (states with high rates of addiction often have low homelessness if housing is cheap). However, within high-cost housing markets, individuals with untreated behavioral health conditions are the most vulnerable to displacement.
- Inadequate Re-entry and Support Systems: Institutional discharges—such as individuals leaving state correctional facilities, psychiatric hospitals, or foster care without structured housing placement plans—frequently lead directly to emergency shelters or unsheltered conditions.
Methodology Limitations: How Homelessness Data is Gathered
Understanding how federal agencies collect homelessness metrics helps explain why official counts are often viewed as conservative baseline figures rather than absolute totals.
| Unsheltered Count Constraints | Definition Discrepancies |
|---|---|
| • Conducted in freezing January weather• Limited access to remote terrain• Avoidance due to safety concerns | • HUD excludes "doubled-up" households• School districts include doubled-up• Underestimates rural housing stress |
Street Count Constraints
The annual Point-in-Time street count relies on visual identification and voluntary survey participation during a single cold night in January. This approach presents several logistical hurdles:
- Invisibility: Unhoused individuals often sleep in concealed locations, such as forested land, abandoned structures, or moving vehicles, to maintain personal safety and avoid law enforcement sweeps.
- Weather Disruptions: Severe winter weather during late January can alter movement patterns, causing unhoused individuals to disperse into inaccessible locations, leading to undercounting.
- Volunteer Variances: Survey accuracy varies widely across different Continuums of Care depending on volunteer staffing levels, local geography, and mapping technology.
Differences in Federal Definitions
The debate over the total unhoused population frequently stems from conflicting federal statutory definitions.
The statutory definition used by HUD under the HEARTH Act focuses strictly on literal homelessness: individuals residing in emergency shelters or places unfit for human habitation. Conversely, definitions used by the Department of Education, the Health Resources and Services Administration (HRSA), and the Substance Abuse and Mental Health Services Administration (SAMHSA) include individuals who are temporarily staying with others ("doubled up") due to economic necessity, as well as those staying in motels paid for out-of-pocket.
If doubled-up households are included in national assessments, the estimated population of housing-insecure Americans expands from under 800,000 to over 3.7 million individuals nationwide.
Proven Solutions and Federal Policy Approaches
Addressing homelessness at scale requires evidence-based housing interventions combined with targeted support services. Federal, state, and local strategies rely on several established frameworks:
The Housing First Model
The Housing First approach operates on the principle that basic shelter is a fundamental prerequisite for personal stability. Under Housing First, individuals are assisted in securing permanent housing without initial preconditions, such as mandatory sobriety or employment requirements. Once stable housing is secured, supportive social services, addiction treatment, and psychiatric care are offered voluntarily.
Decades of research from the United States Interagency Council on Homelessness demonstrate that Housing First programs achieve higher long-term housing retention rates compared to traditional staircase models that require treatment compliance prior to permanent housing placement.
Permanent Supportive Housing (PSH)
Permanent Supportive Housing combines long-term rental assistance with comprehensive case management services. PSH is designed specifically for chronically homeless individuals with severe physical or psychiatric disabilities. By stabilizing individuals in supportive housing, municipalities reduce emergency room visits, hospital admissions, and incarceration costs.
Rapid Re-Housing (RRH)
Rapid Re-Housing provides short- to medium-term rental subsidies and supportive services to individuals and families experiencing situational homelessness. RRH aims to help households quickly exit shelters, return to independent living, and stabilize financially before subsidies taper off.
Zoning Reform and Affordable Housing Construction
Long-term resolution of national homelessness statistics requires structural housing reform. Cities across the U.S. are revising zoning codes to eliminate single-family zoning restrictions, lower parking minimums, streamline permit approvals, and expand funding for low-income housing tax credits (LIHTC) to increase overall housing supply.
Frequently Asked Questions
What is the official government source for homelessness statistics?
The official government baseline is the Annual Homeless Assessment Report (AHAR), published annually by the U.S. Department of Housing and Urban Development (HUD). HUD compiles single-night Point-in-Time (PIT) counts and annual shelter management data submitted by regional Continuums of Care (CoCs) across the country.
Why do estimates of homelessness vary so widely between different reports?
Estimates vary because federal agencies operate under different statutory definitions. HUD counts individuals experiencing "literal homelessness" (those in shelters or sleeping outdoors). In contrast, the Department of Education counts unhoused public school students, including families living "doubled up" with friends or relatives due to severe economic hardship.
Which U.S. state has the largest unhoused population?
California has the largest unhoused population, accounting for more than 180,000 unhoused residents, or roughly 28% of the national Point-in-Time total. California also has the highest percentage of unsheltered unhoused people in the nation.
How many military veterans are homeless in the United States?
According to annual PIT data, between 35,000 and 37,500 military veterans experience homelessness on any given night. Targeted federal housing voucher programs, such as HUD-VASH, have reduced veteran homelessness significantly over the past decade.
What is the difference between situational and chronic homelessness?
Situational (or transitional) homelessness occurs when a household experiences a brief housing loss due to an immediate crisis, such as a job loss, eviction, or medical bill, and usually resolves within a few weeks or months. Chronic homelessness applies to individuals with a disabling condition who have been continuously unhoused for at least a year, or who have experienced at least four episodes of homelessness over three years totaling 12 months.
Navigating Housing Support and Community Action
Understanding the scope of homelessness in America highlights the critical need for coordinated local and national responses. If you or someone you know is experiencing housing instability or homelessness:
- Access Local Resources via 211: Call or visit 211.org to connect with local emergency shelter, rent relief, food assistance, and housing navigation services across the United States.
- Contact Local Continuums of Care (CoCs): Locate your regional CoC through the HUD Exchange portal to access coordinated entry systems for Permanent Supportive Housing and Rapid Re-Housing programs.
- Veterans Housing Assistance: Unhoused veterans can contact the National Call Center for Homeless Veterans at 1-877-4AID-VET (1-877-424-3838) for immediate access to VA housing vouchers and healthcare resources.
- Support Affordable Housing Policies: Engaging in local municipal planning meetings to advocate for zoning flexibility, affordable housing bonds, and tenant protection policies helps address the root structural causes of housing loss in your community.
Image Gallery
Select an image to open it in a new tab.
Mateo Castillo
Decentralized Finance and E-Payments Strategist
