The NPV function in Microsoft Excel calculates the Net Present Value of an investment by using a discount rate and a series of future cash flows. By discounting these future payments and income to their current value, the function allows investors to determine if a project or asset is likely to generate a return exceeding the cost of capital.
Understanding Net Present Value (NPV)
Net Present Value is a foundational metric in corporate finance and personal investment strategy. It represents the difference between the present value of cash inflows and the present value of cash outflows over a defined period. In any financial context, money available today is worth more than the same amount in the future due to its potential earning capacity, a concept known as the time value of money.
When you use the NPV function, you are effectively asking Excel to adjust future, uncertain cash flows into "today’s dollars." If the resulting NPV is positive, the project is theoretically profitable because it earns more than the required rate of return (the discount rate). If the result is negative, the project fails to meet the cost of capital, suggesting a loss in value.
Prerequisites for Using the NPV Function
Before opening Excel, you must have two critical inputs ready:
- The Discount Rate: This is the required rate of return or the cost of capital. For businesses, this is often the Weighted Average Cost of Capital (WACC). For individuals, it might be the interest rate of a high-yield savings account or a benchmark market index.
- The Cash Flow Series: You must have a consistent series of expected future cash flows. These must occur at equal intervals, such as monthly, quarterly, or annually. If your intervals are irregular, the NPV function will yield incorrect results, as it assumes constant periodicity.
Syntax of the NPV Function
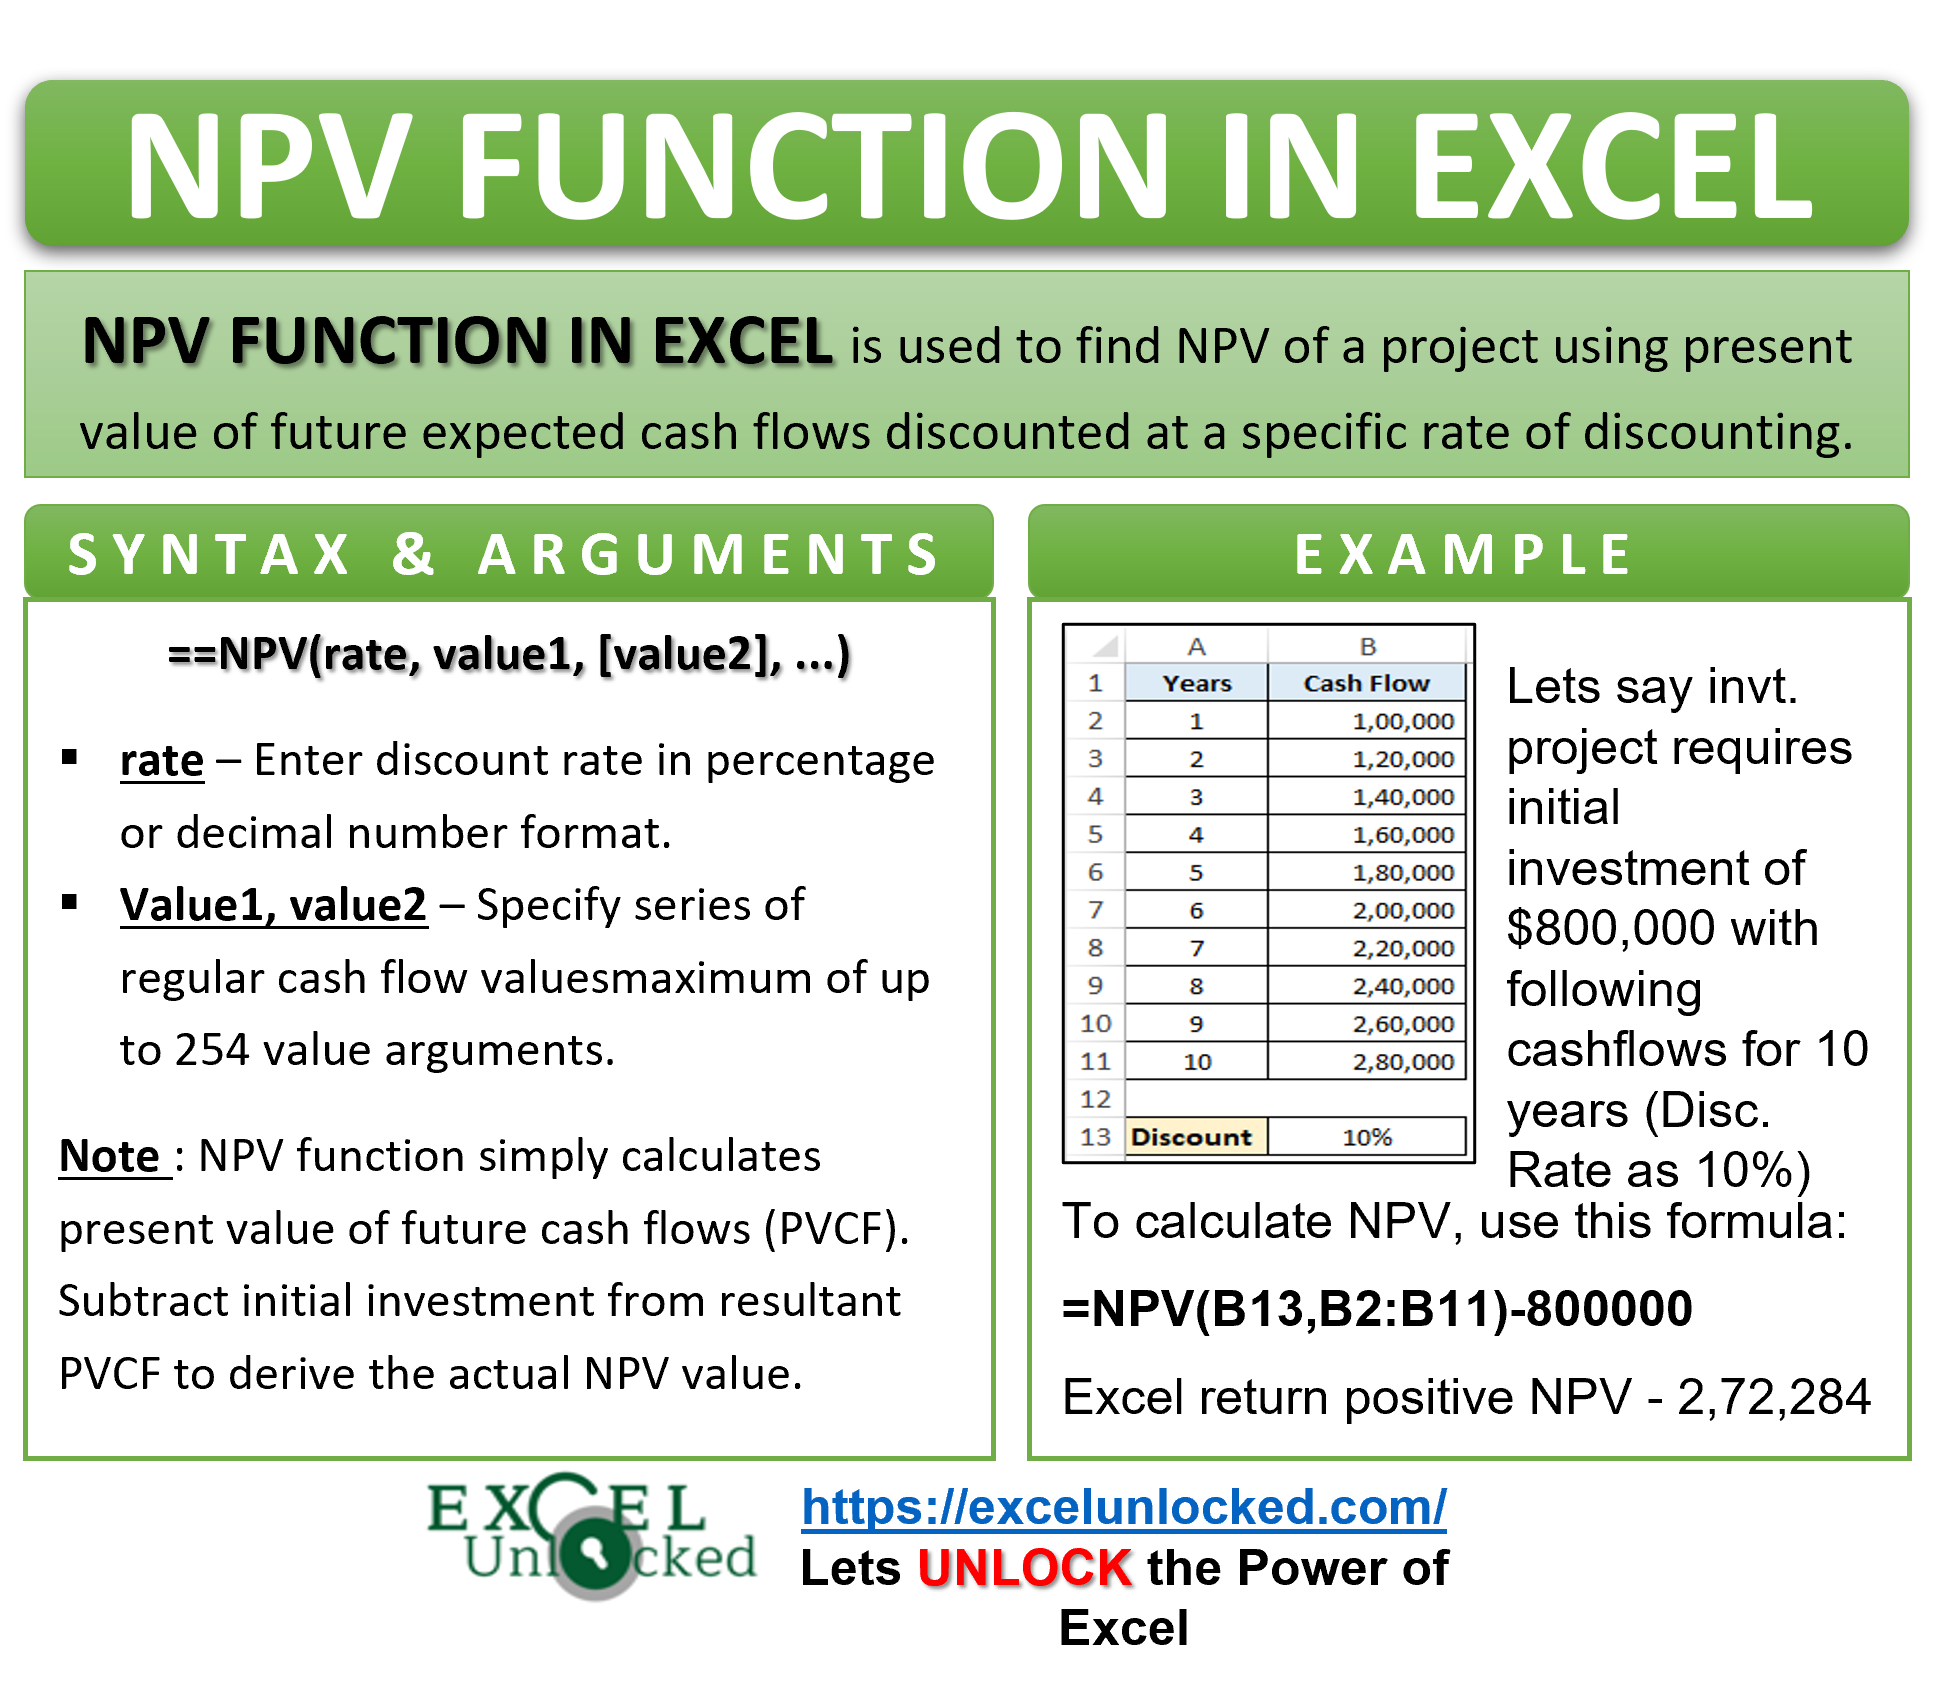
Excel provides a straightforward structure for the NPV calculation. The syntax is:
=NPV(rate, value1, [value2], ...)
- rate: The discount rate over one period. This must be a decimal or a percentage (e.g., 0.05 or 5%).
- value1: The first cash flow, which represents the end of the first period.
- value2, ...: These are optional subsequent cash flows, representing the ends of periods two, three, and beyond.
Important Distinction: The "Year Zero" Trap
A common mistake among Excel users is including the initial investment (the cash outlay at time zero) within the NPV function range. The standard Excel NPV function assumes that the first cash flow occurs at the end of the first period. If you include your initial investment (e.g., -$10,000) as the first value in the range, Excel will incorrectly discount that initial payment.
Correct Procedure:
- Calculate the NPV of the future cash flows using the function.
- Add the initial investment (which is typically a negative number) to the result of the NPV function outside of the formula.
Step-by-Step Implementation
To calculate the NPV correctly, follow these structured steps:
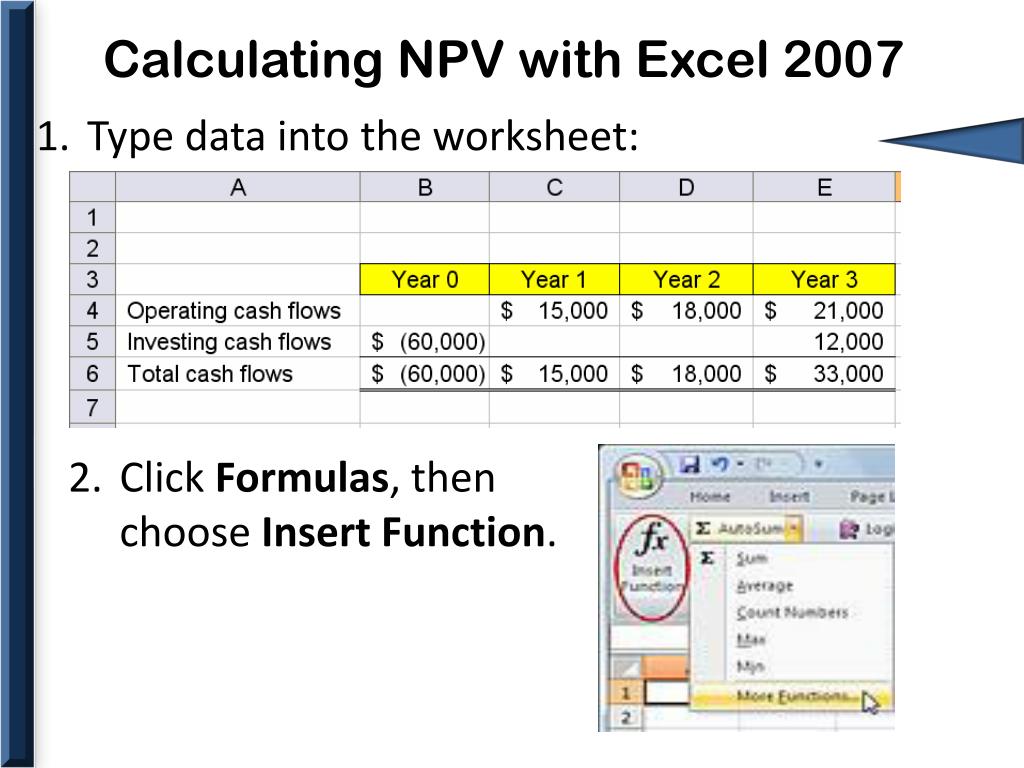
1. Organize Your Data
Create a column where each row represents a specific time period. Cell A1 might be labeled "Year," and B1 "Cash Flow." Input your initial investment at Year 0. Input subsequent cash flows in Years 1 through 5.
2. Define the Discount Rate
Place your discount rate in a dedicated cell (e.g., D1). Using a cell reference rather than hardcoding the number into the formula makes it easier to perform sensitivity analysis later.
3. Write the Formula
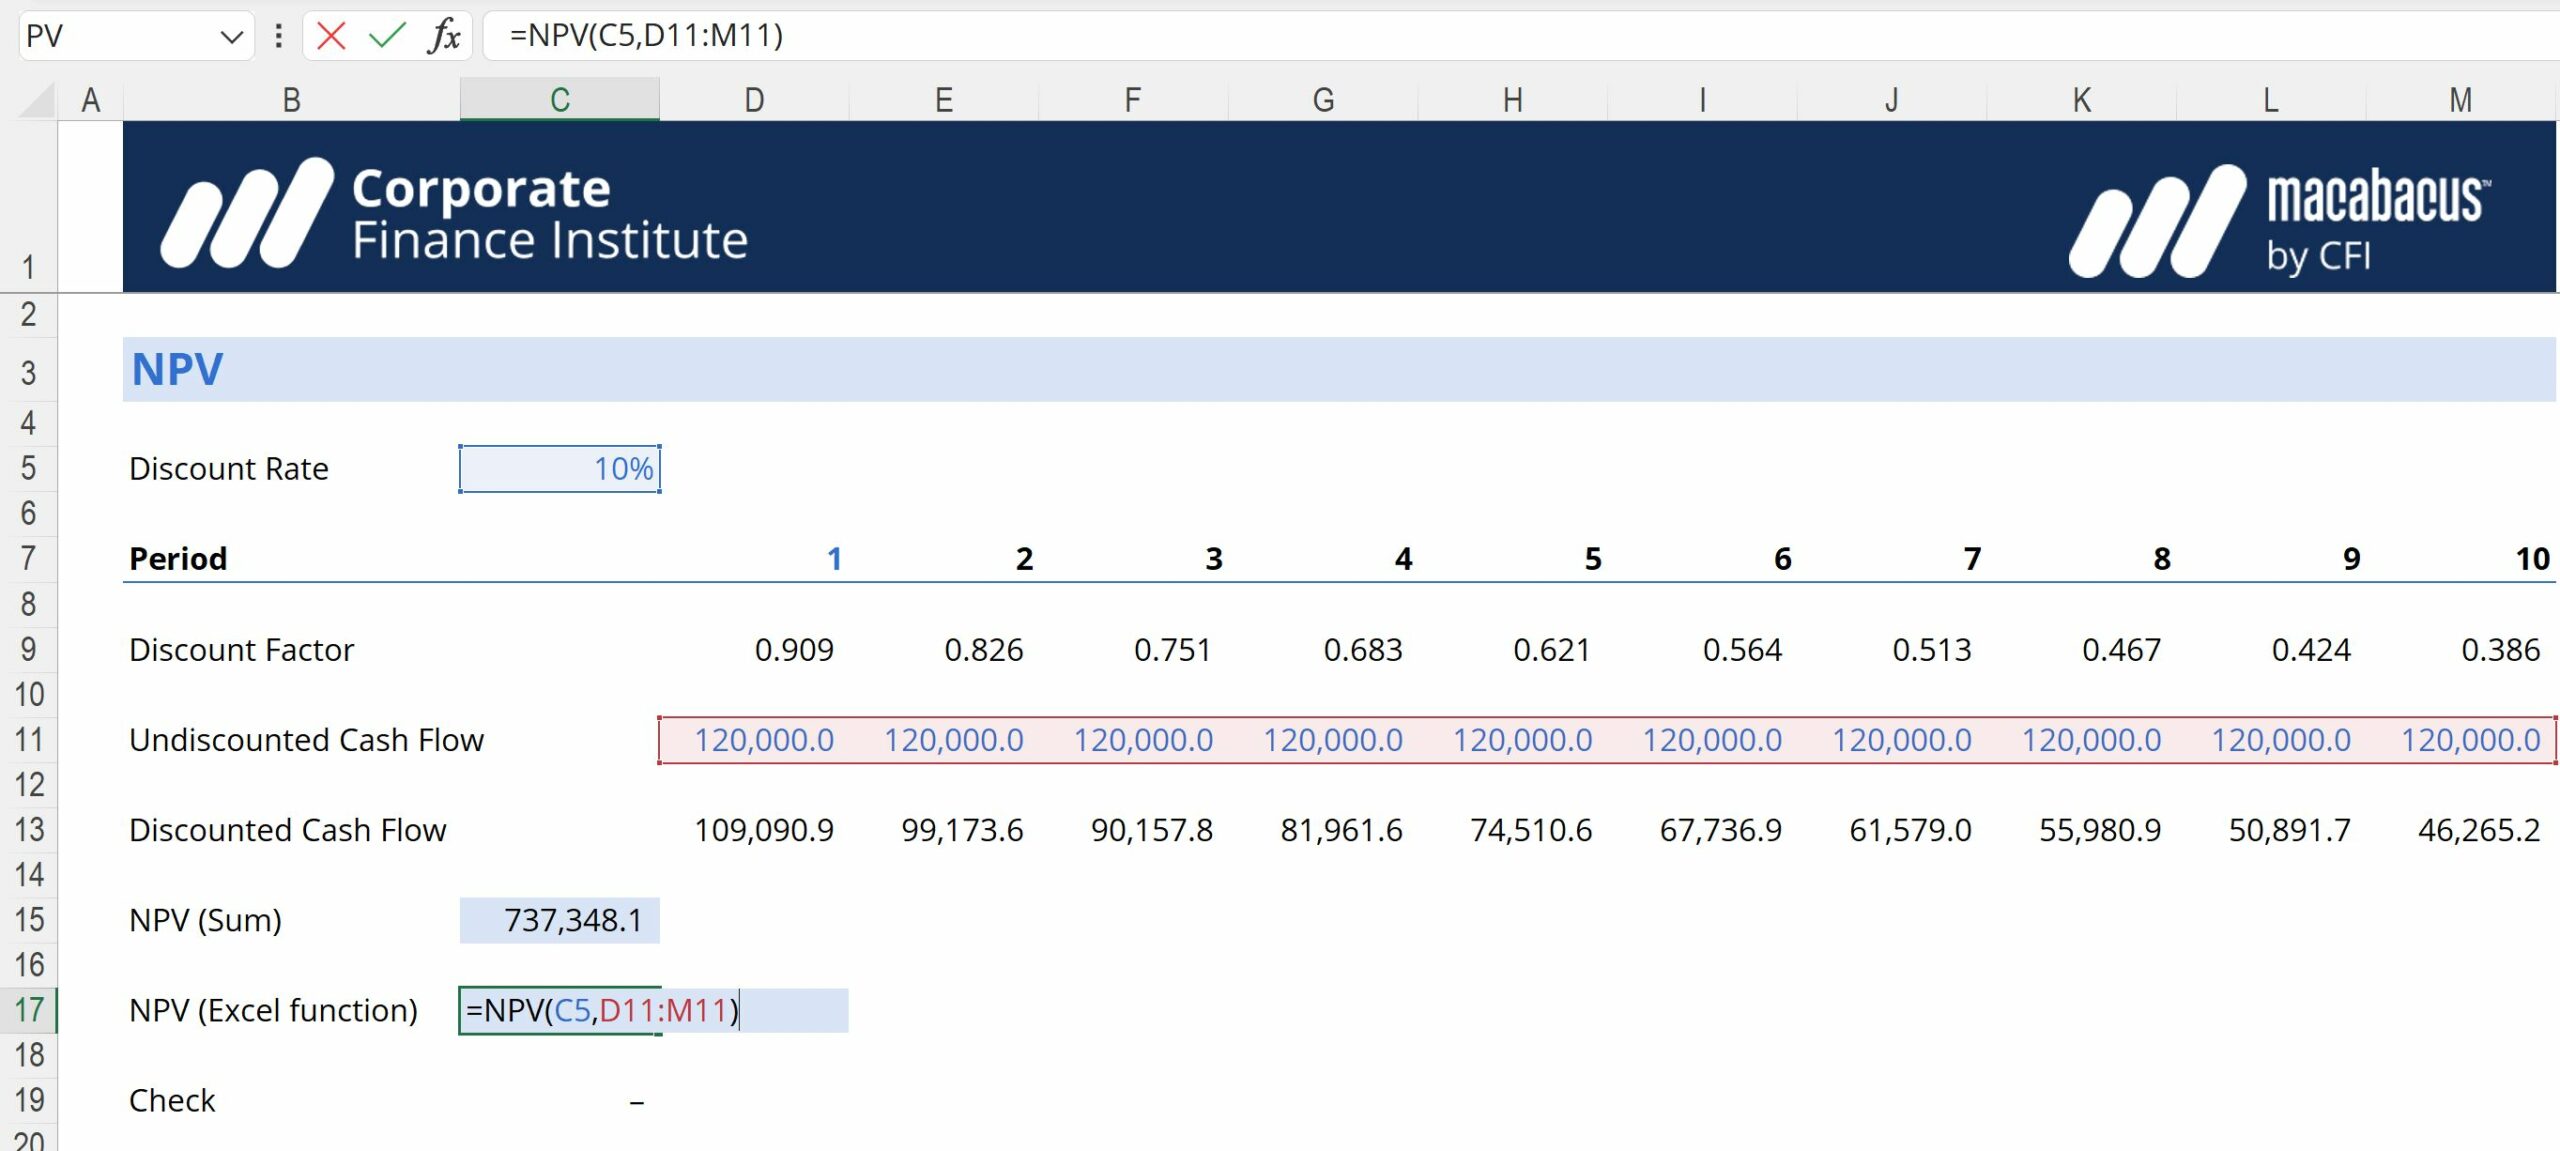
In your designated result cell, type =NPV(D1, B3:B7). Ensure that the range B3:B7 strictly contains the cash flows for periods 1 through 5. Do not include the investment from Year 0 (cell B2) in this range.
4. Adjust for Initial Investment
Take the result from the previous step and add the initial investment. Your final formula should look like: =NPV(D1, B3:B7) + B2. Because the investment is a negative value, the "add" operation will correctly subtract the initial cost from the present value of the future inflows.
Comparative Metrics for Financial Decision-Making
While NPV is a powerful tool, it should not be the sole determinant of an investment's viability. Financial analysts often pair NPV with other metrics to gain a comprehensive view of risk and profitability.
| Metric | Purpose | Sensitivity to Discount Rate |
|---|---|---|
| NPV | Measures absolute dollar value gain | High |
| IRR | Calculates the annualized return percentage | High |
| Payback Period | Measures time required to recover costs | Low |
| Profitability Index | Measures the ratio of benefit to cost | Moderate |
The Internal Rate of Return (IRR) is particularly useful because it identifies the break-even discount rate. If the IRR is higher than your cost of capital, the NPV will be positive. However, NPV remains the preferred metric for choosing between mutually exclusive projects because it provides a direct measure of value creation in currency terms, whereas IRR can be misleading if cash flow signs change multiple times throughout the project.
Troubleshooting Common Issues
The "Irregular Cash Flow" Problem
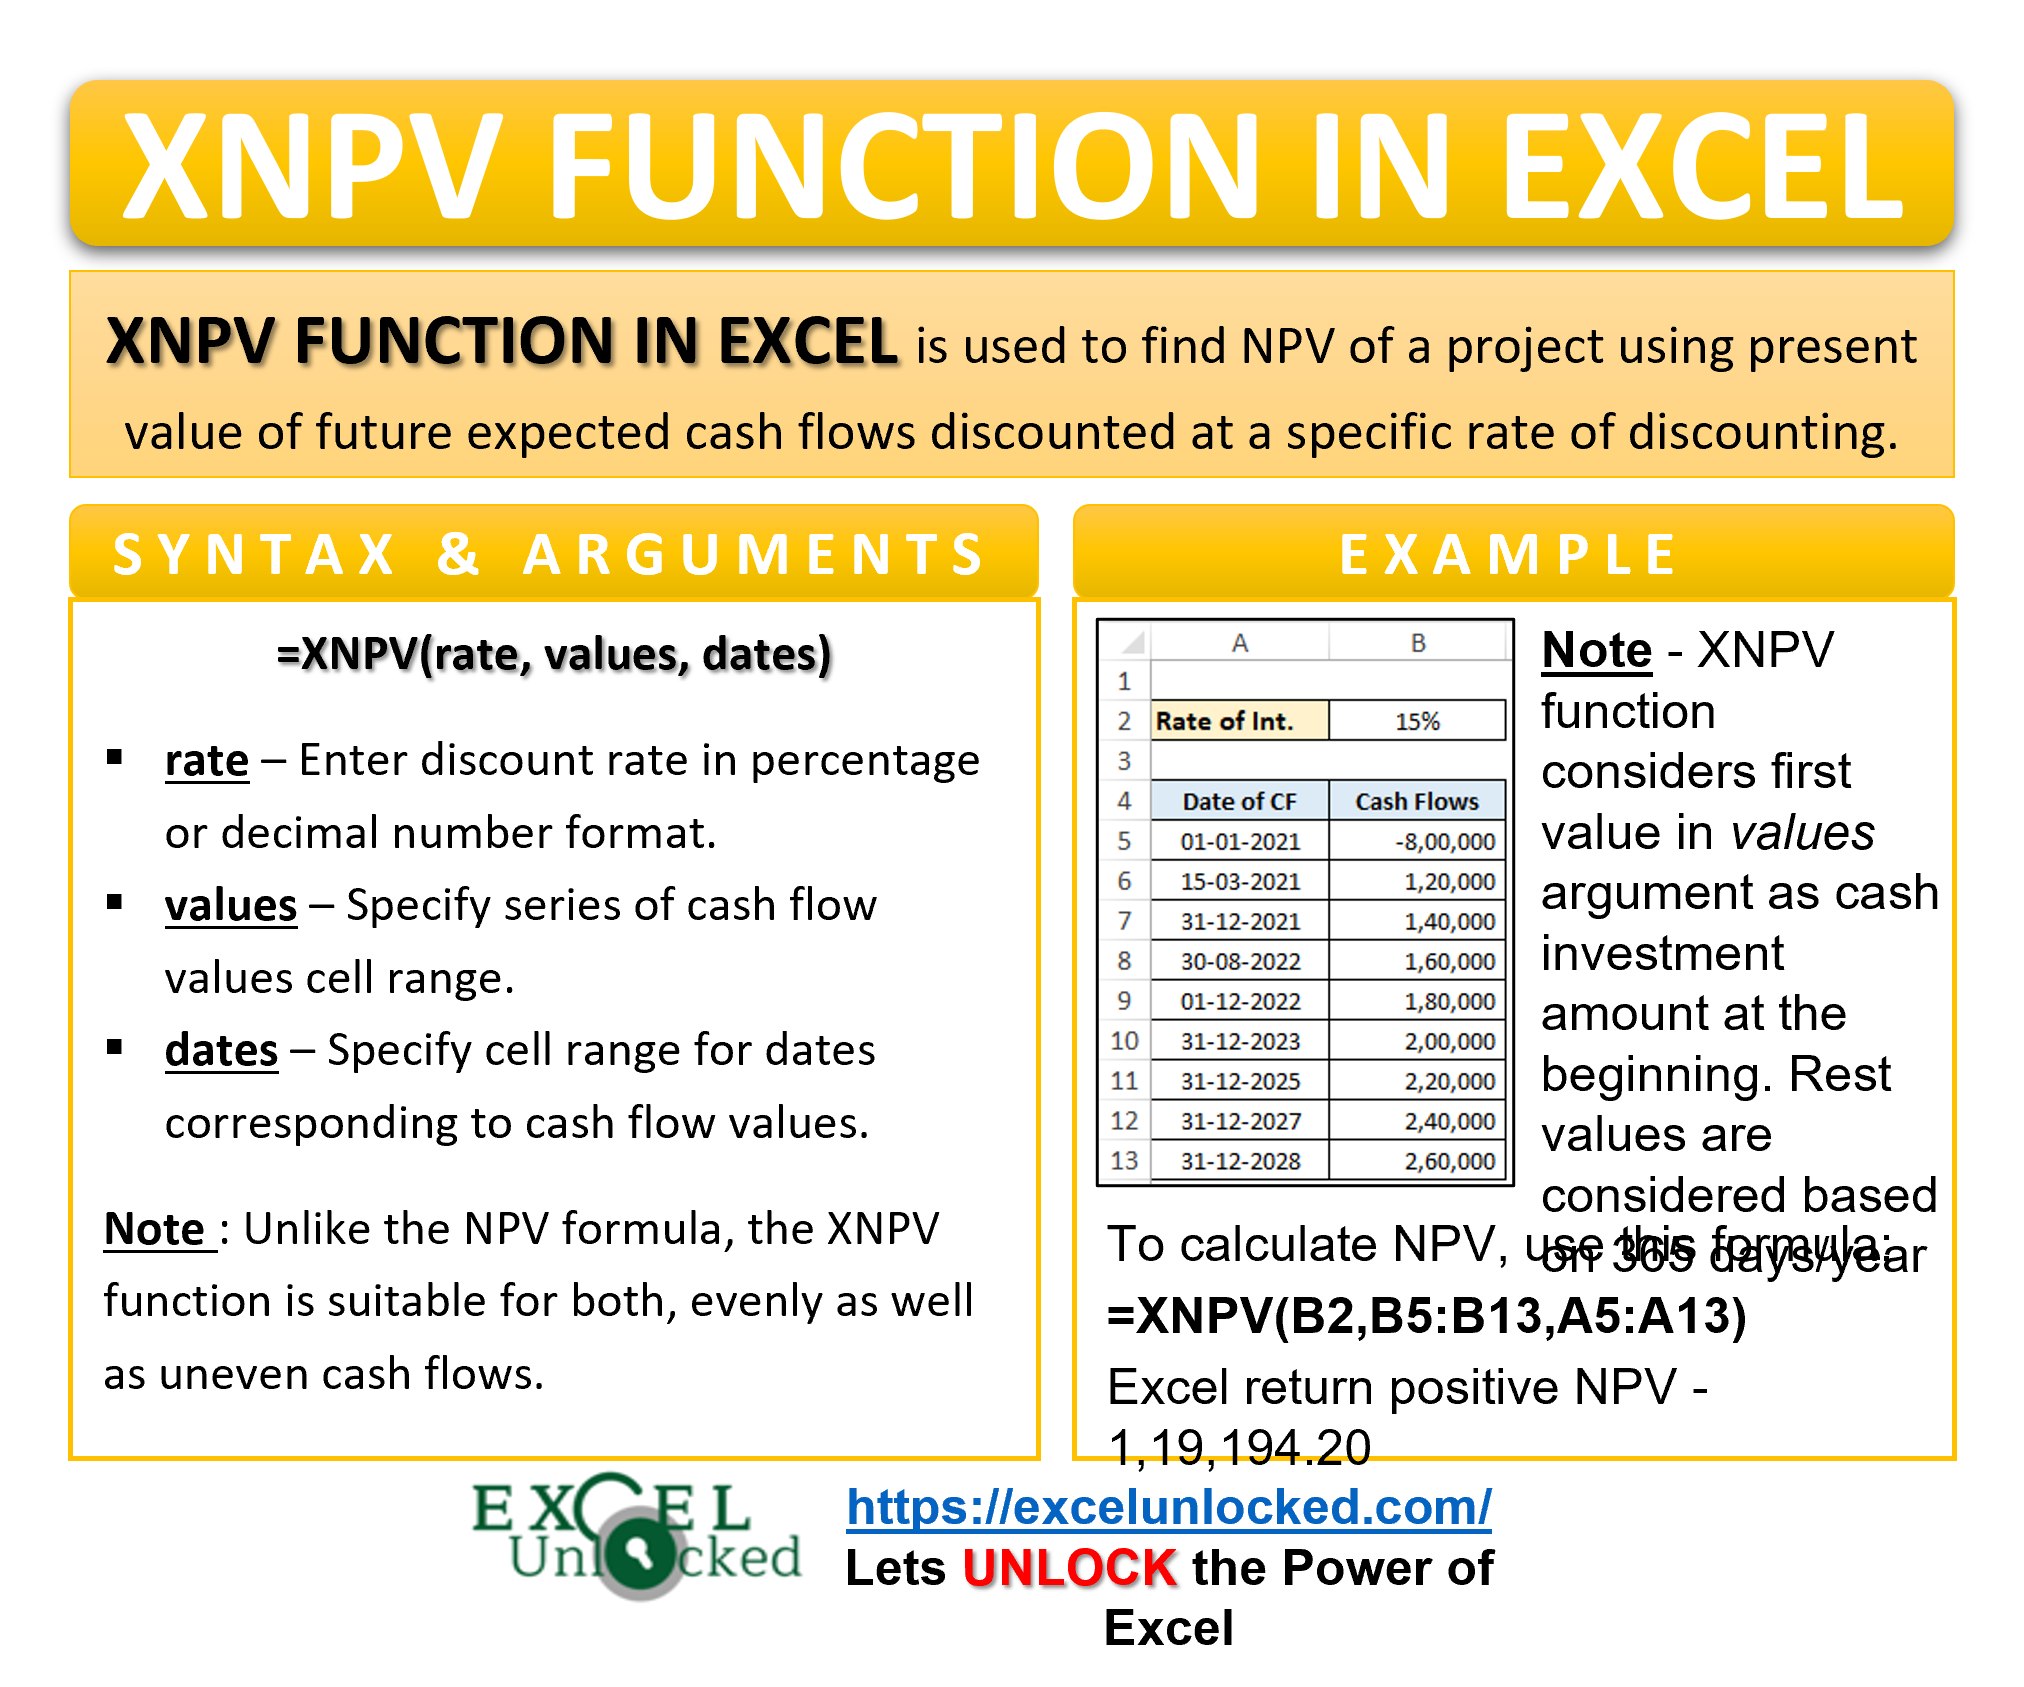
If your project does not have cash flows at perfect, equal intervals, the NPV function will be inaccurate. In such cases, use the XNPV function instead. XNPV requires both the cash flows and their corresponding specific dates, allowing Excel to calculate the precise time elapsed between payments.
Negative Results
Do not assume that a negative NPV immediately implies a mistake in your spreadsheet. If the inputs are correct, a negative NPV is a valid mathematical output indicating that the project is not economically viable under the chosen discount rate. If you expected a positive result, re-examine your discount rate; perhaps your cost of capital is too high, or your cash flow projections are overly conservative.
Formatting Errors
Ensure that your discount rate cell is formatted as a percentage or a decimal. If you type "5" into a cell and reference it as a rate, Excel may interpret it as 500%. Always verify the decimal value of your rate to ensure the math aligns with your projections.
Advanced Considerations and Limitations
Sensitivity Analysis
The reliability of your NPV calculation depends entirely on the accuracy of your discount rate and cash flow estimates. Because these inputs are projections, perform sensitivity analysis. Change the discount rate by 1% or 2% increments to see how sensitive the project’s value is to interest rate fluctuations. In 2026, with shifting interest rate environments, this practice is essential for corporate and personal capital allocation.
Handling Inflation
When calculating NPV, ensure that your cash flow projections and your discount rate are internally consistent regarding inflation. If your cash flows are "nominal" (including expected inflation), your discount rate must also be a nominal rate. If your cash flows are "real" (constant dollars), your discount rate must be a real rate. Mixing these will lead to flawed decision-making.
Terminal Value
For long-term projects, the cash flows often extend beyond the period you are modeling. To account for the ongoing value of an asset, analysts often calculate a "Terminal Value"—the present value of all future cash flows beyond the forecast period—and add this to the final cash flow in the NPV calculation.
Frequently Asked Questions
Why does my NPV result differ from the IRR?
NPV measures the total value added in currency, while IRR provides the project’s annual rate of return. They look at the same data from different mathematical perspectives. You might see a high IRR but a low NPV if the project scale is very small.
How do I handle monthly cash flows in NPV?
If your cash flows are monthly, your discount rate must also be monthly. Divide your annual interest rate by 12 to get the periodic rate required for the function.
Is NPV suitable for personal budget planning?
Yes, NPV can help individuals decide between spending on a home improvement project or investing in an asset. However, keep in mind that personal financial decisions often involve non-monetary utility that NPV cannot quantify.
Does the NPV function work with blank cells?
Excel’s NPV function treats empty cells as zero values, which can skew your results. If a period has no cash flow, explicitly enter a zero, but ensure you do not leave cells blank within the range, as this may lead to misinterpretations of the period count.
Can I use NPV for projects with infinite life?
The standard NPV function cannot handle an infinite series. For such cases, you must estimate the value of the project at a specific terminal date and treat that figure as a final "lump sum" cash flow in the last period.
Recommendation for Next Action
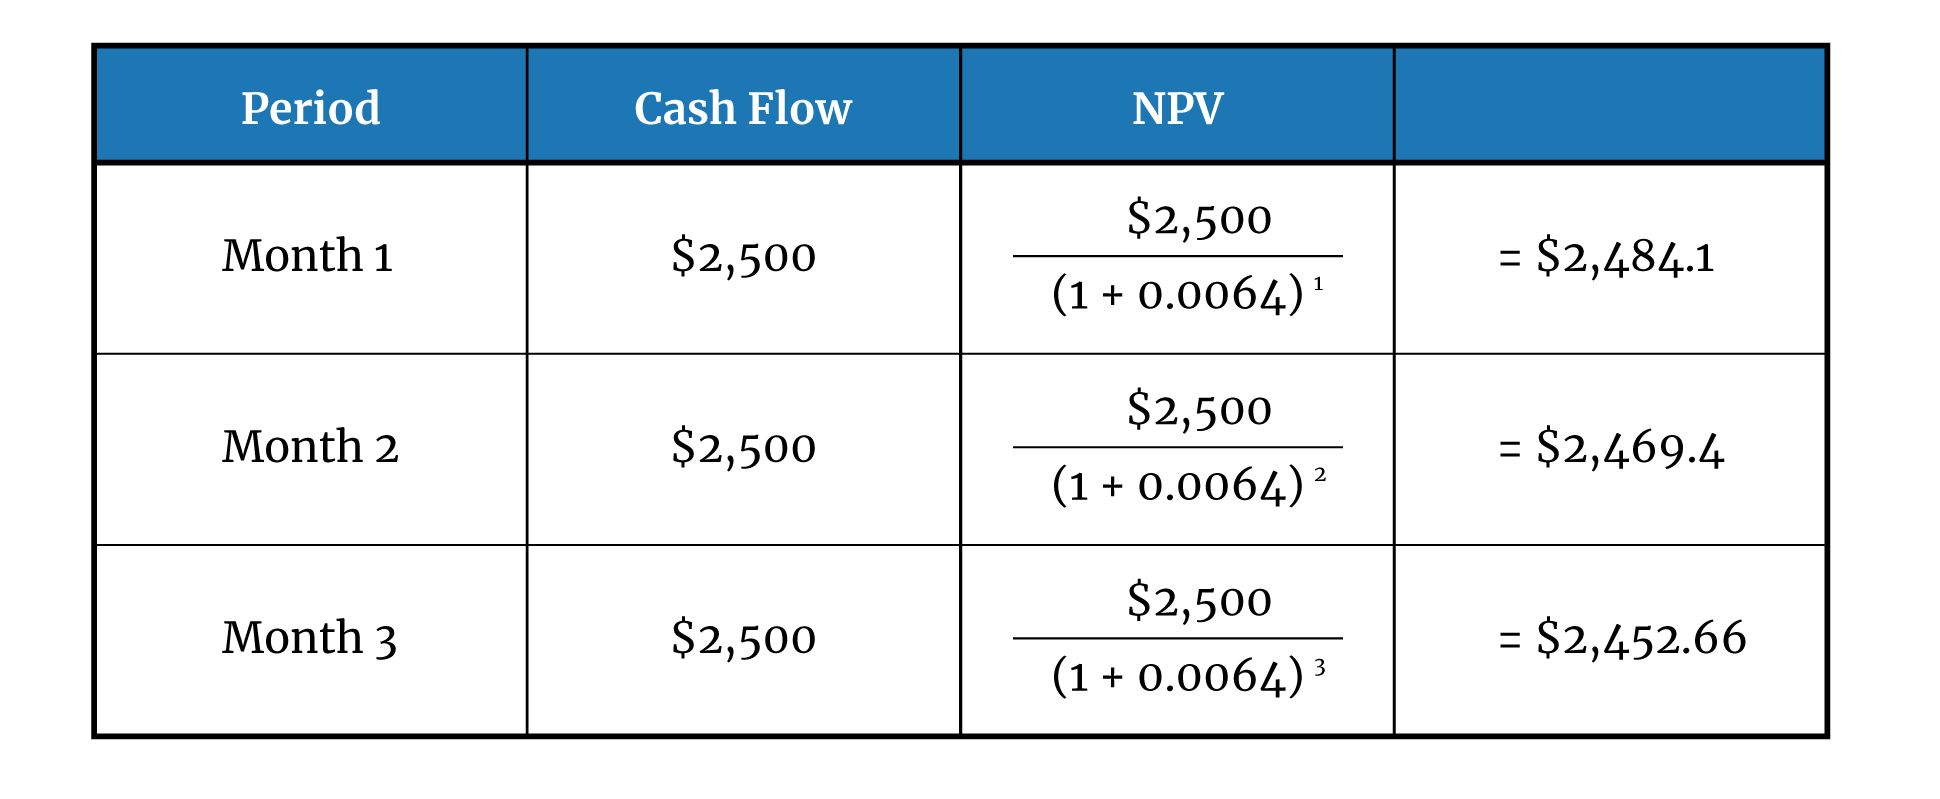
To master this function, start by auditing a simple three-year investment scenario. Create a spreadsheet with three distinct cash flows, calculate the NPV, and then manually discount each year’s cash flow using the formula PV = FV / (1 + r)^n to verify that your manual result matches the result provided by Excel’s NPV function. Once you are comfortable with the verification process, use the XNPV function for any future projects involving irregular dates to ensure your financial modeling remains precise and professional.
Image Gallery
Select an image to open it in a new tab.



Mateo Castillo
Decentralized Finance and E-Payments Strategist
