Choosing the right performance testing tool for a desktop application requires a strategic alignment between your software architecture, the specific technology stack used for the UI, and your end-goal metrics. Unlike web applications, which rely heavily on protocol-level traffic (HTTP/S), desktop applications often interact with local system resources, proprietary binary protocols, or complex UI frameworks that necessitate specialized instrumentation and automation strategies to measure latency, resource consumption, and stress capacity accurately.
Understanding the Desktop Performance Landscape
Desktop applications differ significantly from their browser-based counterparts. A desktop application running on Windows, macOS, or Linux interacts directly with the operating system’s kernel, graphics drivers, and local file system. When performance testing, you are not just checking server response times; you are evaluating how the application manages local CPU cycles, RAM allocation, thread contention, and UI rendering speed.
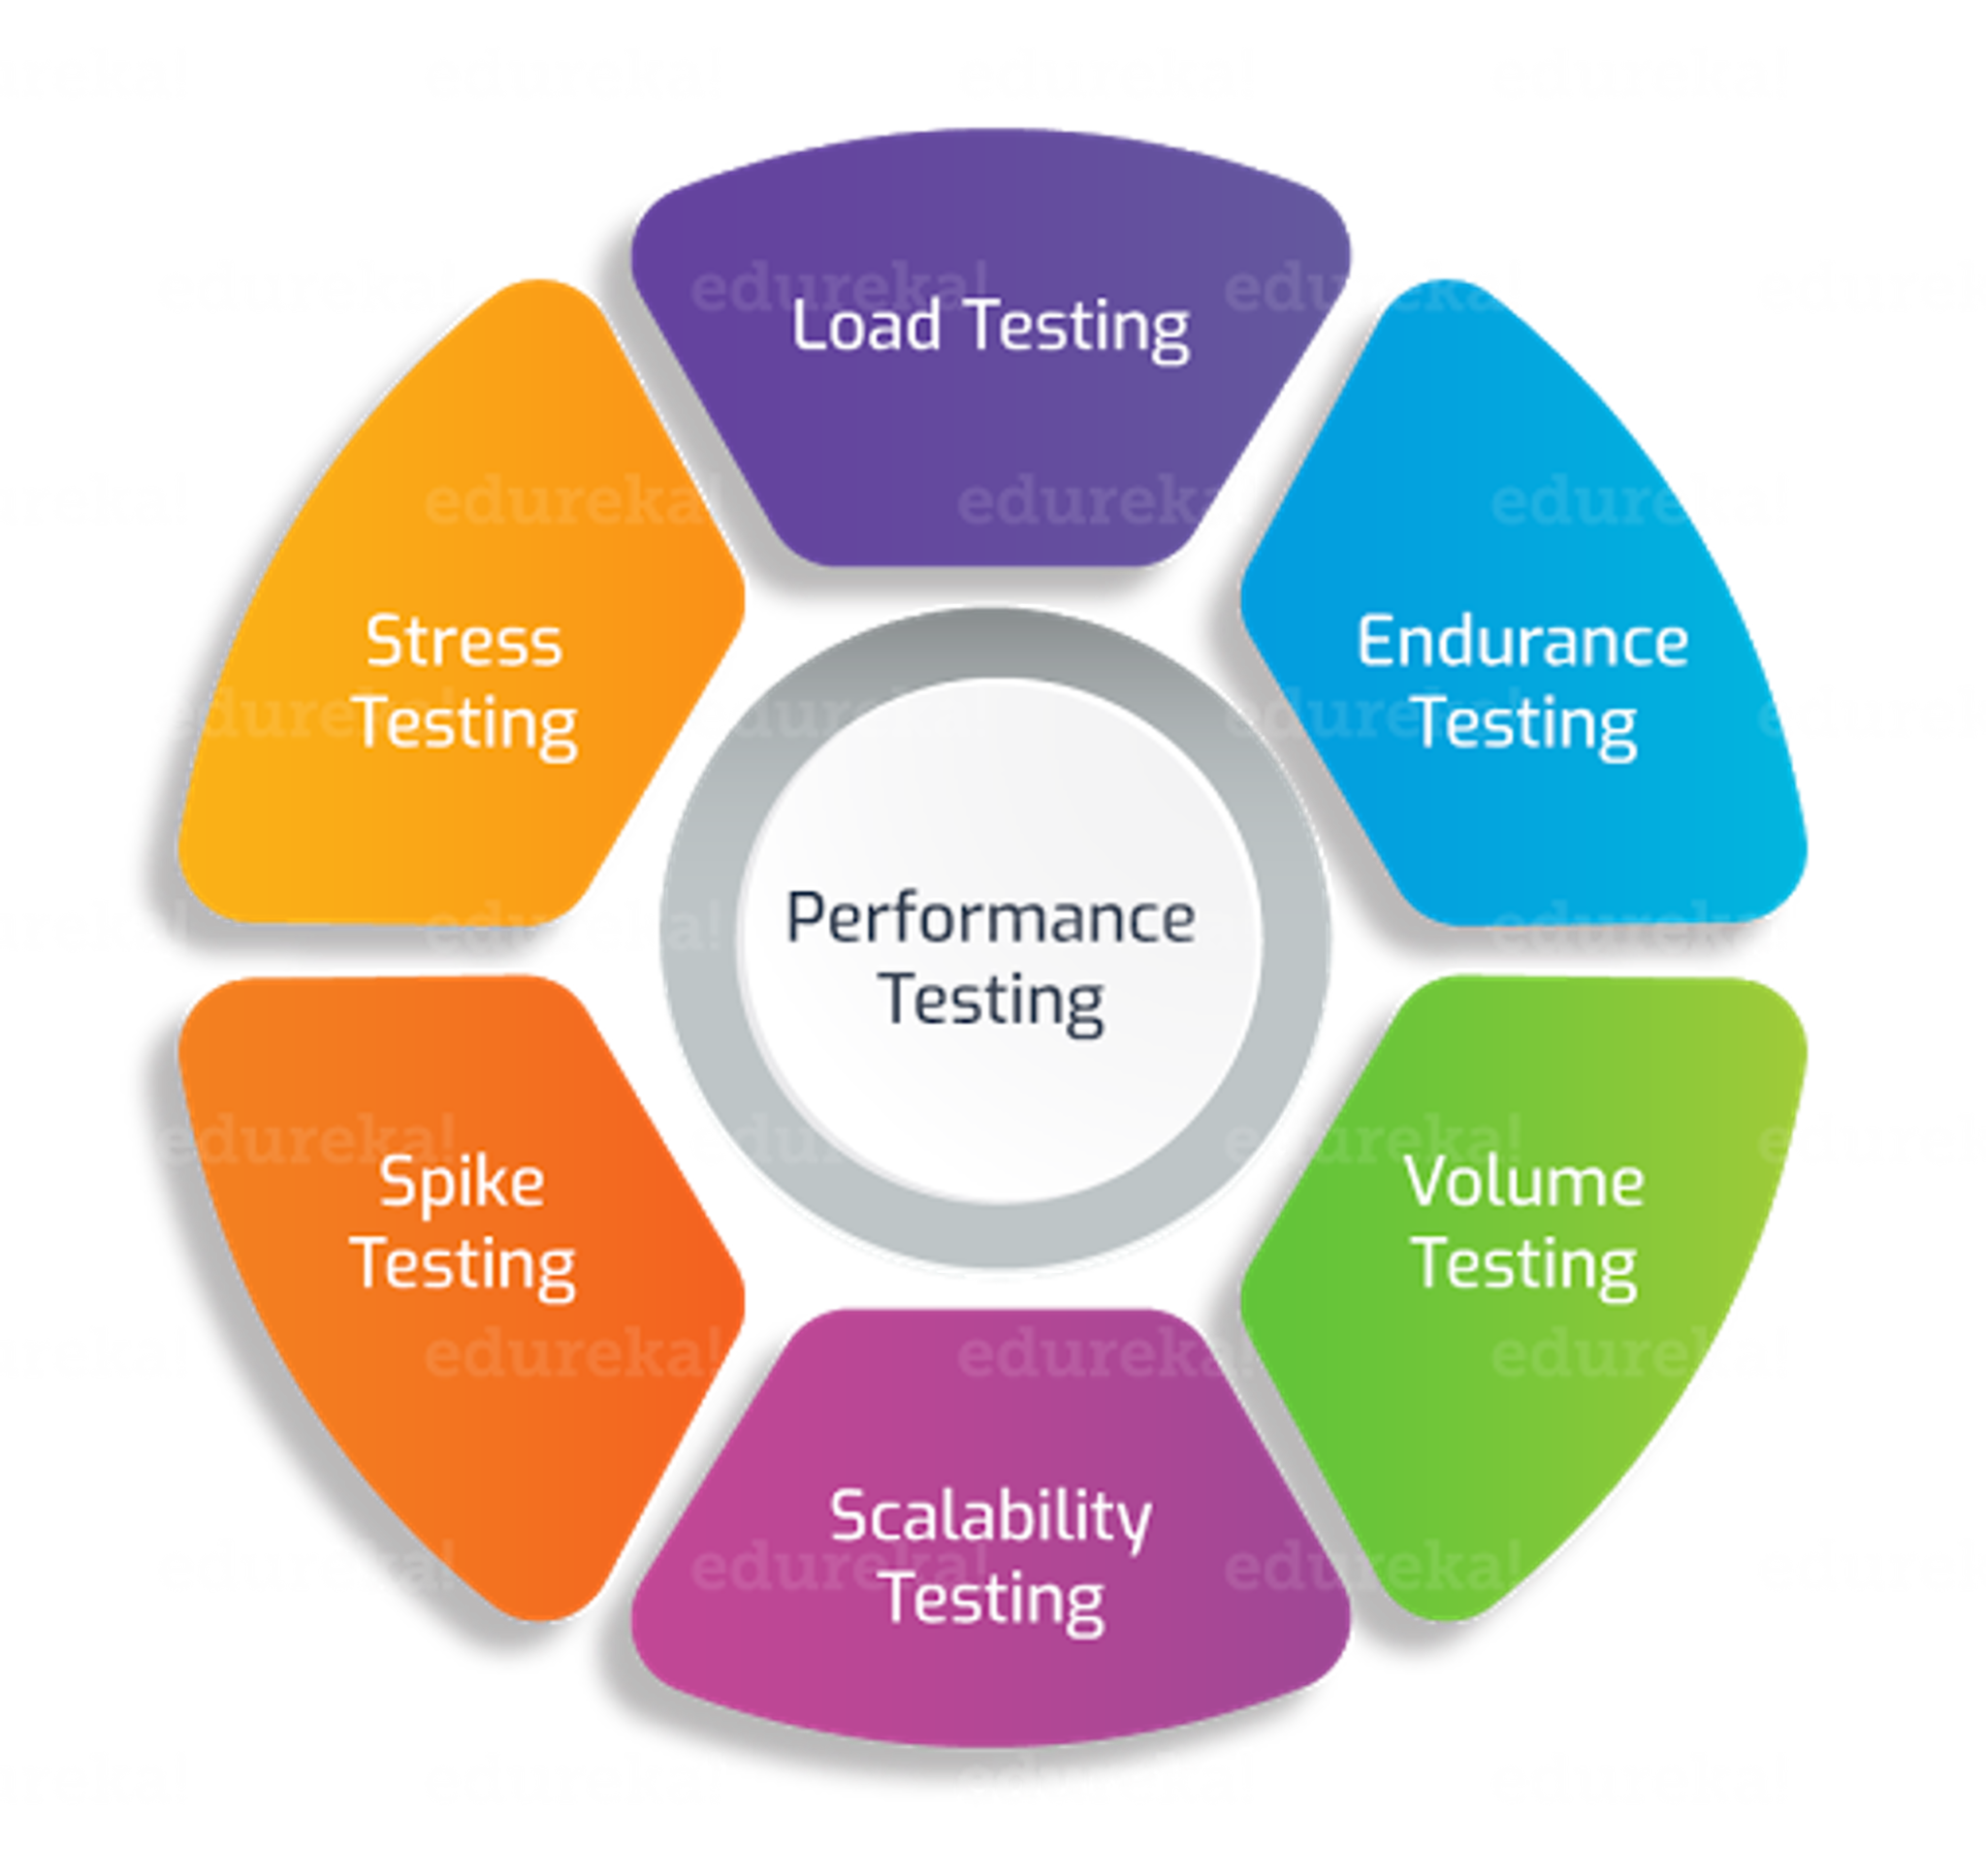
Performance testing for desktop environments generally falls into two categories:
- Load Testing: Simulating multiple users or data-intensive workflows to ensure the application remains stable under pressure.
- Resource Profiling: Monitoring the application’s "footprint" on a single machine to identify memory leaks, inefficient garbage collection, or CPU spikes.
To pick the right tool, you must first define whether you are optimizing for a single-user workstation experience or a multi-user environment where the desktop app acts as a client to a centralized server.
Key Technical Prerequisites
Before evaluating individual tools, you must audit your application’s architecture. A tool capable of testing a WPF (Windows Presentation Foundation) application using .NET may be entirely ineffective for an application built in Electron or Qt.
Technology Stack Compatibility
- UI Frameworks: Determine if your tool supports the object model of your framework. For instance, testing a native C++ application requires a tool that can hook into standard Windows APIs or specific UI libraries.
- Communication Protocols: Does the application communicate via REST, gRPC, or custom TCP/IP sockets? If your desktop app is merely a thin client, your focus should be on network traffic simulation. If it is a heavy-client application, your focus shifts to process-level monitoring.
- Automation Hooks: Does the application expose automation interfaces (like UI Automation for Windows)? Some testing tools require these hooks to interact with UI elements effectively.

Core Evaluation Criteria for Selection
When comparing potential candidates, use a weighted decision matrix. Your criteria should prioritize technical integration over broad marketing claims.
1. Instrumentation and Interception
Look for tools that provide non-intrusive monitoring. The "Observer Effect" is a common trap in desktop performance testing, where the act of monitoring the application consumes so many system resources that it invalidates the performance data.
2. Scripting vs. Record-and-Playback
Record-and-playback tools are excellent for rapid initial prototyping. However, as desktop applications grow in complexity, dynamic UI elements often break simple playback scripts. Ensure the tool supports a mature scripting language (such as Python, C#, or JavaScript) to handle logical branching, data-driven testing, and complex assertions.
3. Resource Monitoring Capabilities
The tool must be able to correlate UI actions with system-level metrics. You need to see a graph that aligns "Clicking the Export Button" with "RAM usage jump from 200MB to 800MB." If the tool cannot provide this correlation, you will end up manually aligning timestamps from different log files, which is prone to human error.
Comparison of Performance Testing Approaches
| Tool Feature | Record-and-Playback | Script-Based Automation | Hardware-Level Profiling |
|---|---|---|---|
| Ease of Use | High | Medium | Low |
| Maintenance | Difficult | Moderate | Low |
| Data Depth | Surface Level | High | Very High |
| Best For | Smoke testing workflows | Complex load scenarios | Identifying memory leaks |
Common Mistakes to Avoid
Many teams fail to achieve meaningful results because they approach desktop performance testing with a "web-first" mentality.
- Ignoring Hardware Diversity: Desktop applications behave differently on a high-end development machine versus a legacy office workstation. Always include a test matrix covering different hardware profiles (CPU core counts, RAM availability, and graphics card capabilities).
- Overlooking Cold vs. Warm Starts: A common mistake is testing only "warm" applications. Users often judge an application by how long it takes to launch from a cold state. Ensure your tool can measure startup latency independently of steady-state performance.
- Neglecting Network Simulation: Even if an app is a "desktop app," it likely fetches updates or cloud-synced data. If your performance tool ignores network latency or packet loss, you are missing a critical segment of the user experience.
Strategic Selection Process
The selection process should follow a clear, repeatable pattern to ensure objective decision-making.
Phase 1: Requirements Gathering
Map out your performance KPIs (Key Performance Indicators). Are you tracking frame rates (FPS), time-to-first-interaction, or total process memory? Once you define these, categorize them as "must-have" or "nice-to-have."
Phase 2: Pilot Testing
Never commit to a licensing model without running a proof-of-concept. Download a trial version of 2–3 candidate tools. Use a single, repeatable user journey (e.g., "Launch App, Open Large File, Perform Search, Save File") and measure how each tool handles the script creation and reporting.
Phase 3: Total Cost of Ownership (TCO) Analysis
Remember that the license cost is only one part of the budget. Consider:
- Learning Curve: How much training will your team require?
- Maintenance: How easily can your CI/CD pipeline run these tests automatically?
- Support: Does the vendor provide active support for the specific OS version you are targeting in 2026?
Troubleshooting Performance Discrepancies
If your tool provides data that contradicts the perceived user experience, do not assume the tool is broken immediately. Check for the following:
- Anti-Virus Interference: Antivirus software often scans files accessed by performance tools, creating false latency spikes. Exclude your test directories from real-time scanning.
- Power Management Profiles: Ensure your test machines are set to "High Performance" mode. Windows and macOS power-saving features often throttle CPU performance, which will corrupt your baseline data.
- Synchronization Issues: If the tool is checking for a UI change that happens asynchronously (like a background process finishing), ensure your wait-conditions are based on state-checks rather than static time delays.
Frequently Asked Questions
Does the choice of operating system change the tool selection? Yes. Many performance tools are OS-specific because they rely on native APIs. A tool that provides deep system hooks for Windows may not offer the same granularity on macOS. Always check the specific OS compatibility list before procurement.
Can I use web-based load testing tools for desktop apps? Only if the desktop app interacts solely with web APIs. If the app has a complex local UI, web tools will be blind to the rendering performance and local resource usage, rendering the results incomplete.
How do I handle dynamic UI elements? Look for tools that support "object-based" identification rather than coordinate-based identification. Object-based tools identify buttons and menus by their internal IDs or properties, ensuring the test remains valid even if the window is resized or moved.
Is open-source better than enterprise software for this niche? Not necessarily. Open-source tools often require extensive custom coding to hook into desktop UI frameworks. Enterprise tools usually offer pre-built plugins for popular frameworks, which can save months of engineering time.
What is the minimum number of metrics I should track? Start with the "Big Four": CPU utilization, physical memory working set, disk I/O, and UI responsiveness (latency between action and visual feedback). Tracking too many metrics initially will lead to "analysis paralysis."
Final Recommendations
Selecting a performance testing tool for a desktop application is a commitment to a specific workflow. Start by isolating your most critical UI components and your most resource-heavy back-end operations. Prioritize tools that provide deep, non-intrusive visibility into system-level metrics. Conduct a two-week pilot program where you attempt to automate your most common user scenario. If a tool cannot record that scenario without significant manual intervention, it will likely become a bottleneck in your testing cycle. Focus on tools that offer robust support for your specific UI framework, as this is where most desktop performance issues reside.
Image Gallery
Select an image to open it in a new tab.


Lars Thomsen
Global Labor Markets and Economic Strategy Editor
