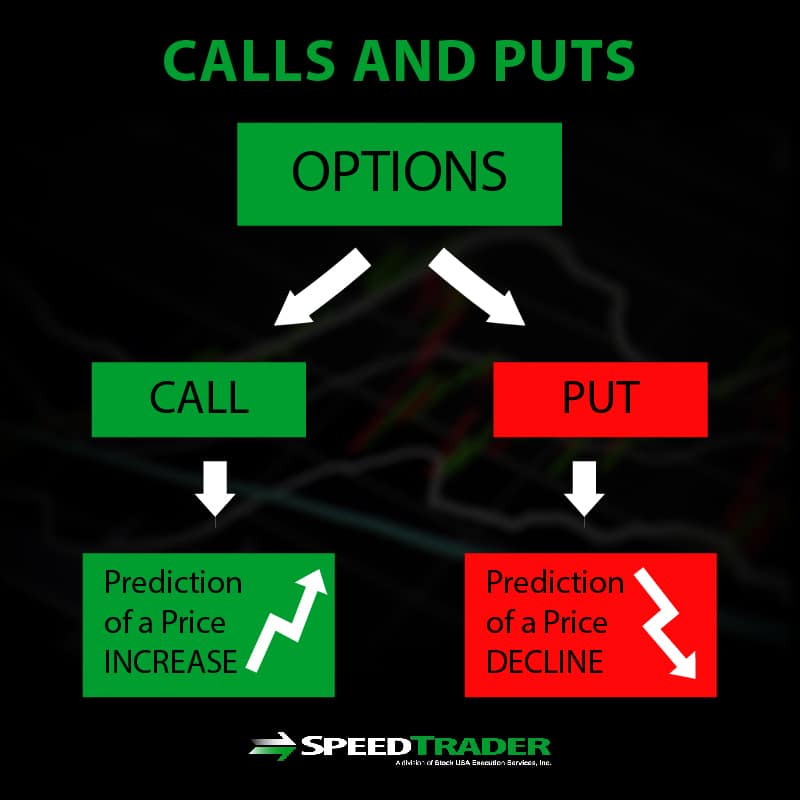
A call option chart, commonly known as a payoff diagram or P&L graph, is a visual representation of the potential profit or loss of a call option position at expiration relative to the underlying asset's price. It illustrates the relationship between the strike price, the premium paid, and the break-even point, allowing traders to quantify their maximum risk and unlimited reward potential before entering a trade.
Understanding how to read and interpret these charts is a fundamental skill for any options trader. In the fast-moving markets of 2026, where algorithmic trading and retail participation have reached record highs, the ability to visualize risk through a payoff diagram is more critical than ever. While a standard stock chart shows historical price movement, an options payoff chart looks forward, showing you exactly what needs to happen for your trade to be successful.
The Anatomy of a Call Option Payoff Chart
To the uninitiated, a call option chart looks like a simple "hockey stick" shape. However, every angle and axis on that chart provides specific data points necessary for risk management.
The Horizontal Axis (X-Axis): Underlying Asset Price
The horizontal axis represents the price of the underlying asset (such as a stock, ETF, or commodity) at the time the option expires. As you move from left to right, the price of the stock increases. This is the variable that determines whether your option will be "In the Money" (ITM), "At the Money" (ATM), or "Out of the Money" (OTM).
The Vertical Axis (Y-Axis): Profit and Loss (P&L)
The vertical axis represents the dollar amount of profit or loss. There is a horizontal line across the middle of the chart, often called the "Zero Line."
- Above the Zero Line: This area represents the profit zone.
- Below the Zero Line: This area represents the loss zone.
The "Kink" or Inflection Point: The Strike Price
The most recognizable feature of a call option chart is the "kink" in the line. For a buyer of a call option, the line remains flat and horizontal until it reaches the strike price. This point is where the option starts to gain intrinsic value. Prior to this point, the option would expire worthless, and the trader would lose their entire investment (the premium).
The Long Call Option Chart: Buying for Upside
The "Long Call" is the most common strategy for bullish traders. When you buy a call, you are paying for the right to buy a stock at a specific price (the strike price) before a certain date (expiration).
Visualizing the Maximum Risk
On a long call chart, the line sits below the zero line on the far left. This flat, horizontal section represents the Option Premium. Because you cannot lose more than what you paid for the option, the line never goes lower than the premium amount. This "capped risk" is a primary reason why traders use call options instead of shorting or buying stocks on heavy margin.
The Break-even Point
The break-even point is not the strike price; this is a common misconception among beginners. To break even, the stock must rise to the strike price PLUS the cost of the premium.
- Formula: Break-even = Strike Price + Premium Paid. On the chart, this is the exact point where the diagonal line crosses the zero line from the negative (loss) zone into the positive (profit) zone.
Unlimited Profit Potential
Once the stock price surpasses the break-even point, the diagonal line continues upward indefinitely. Theoretically, there is no limit to how high a stock price can go, meaning a long call option has theoretically unlimited profit potential. On the chart, this is represented by the line pointing toward the upper-right quadrant.
The Short Call Option Chart: Selling for Income
Selling a call option (also known as "writing" a call) creates an inverted version of the long call chart. This strategy is often used by institutional investors or traders seeking to generate income through covered calls.
Visualizing the Maximum Reward
For a short call, the "reward" is the premium received from the buyer. On the chart, the line starts in the positive zone (above the zero line). This is the maximum profit the seller can make. If the stock price stays below the strike price at expiration, the seller keeps the entire premium.
The Risk Profile
The danger of a short call (especially a "naked" or uncovered call) is visible on the right side of the chart. Once the stock price moves past the strike price, the line begins to dive diagonally downward. Because the stock price can technically rise to infinity, the seller's potential loss is unlimited. On the chart, the line continues to move deeper into the negative Y-axis as the stock price increases.
Comparative Analysis: Long Call vs. Short Call
The following table summarizes the key components found on these charts to help you distinguish between the two primary call positions.
| Feature | Long Call (Buyer) | Short Call (Seller/Writer) |
|---|---|---|
| Market Sentiment | Bullish (Price will go up) | Bearish to Neutral (Price will stay down) |
| Initial Cash Flow | Debit (You pay money) | Credit (You receive money) |
| Maximum Profit | Theoretically Unlimited | Limited to the Premium Received |
| Maximum Loss | Limited to the Premium Paid | Theoretically Unlimited (if naked) |
| Break-even Point | Strike Price + Premium | Strike Price + Premium |
| Chart Shape | Hockey Stick (pointing up) | Inverted Hockey Stick (pointing down) |
Understanding the "T+0" Line vs. Expiration Line
In modern trading platforms available in 2026, call option charts often show two lines instead of one. Understanding the difference between these is vital for intraday and swing traders who do not plan on holding until the final bell.
- The Expiration Line (The Hard Angle): This is the classic "hockey stick" shape discussed above. It shows the P&L if you held the option until the very last second of the contract.
- The T+0 Line (The Curve): This is a curved line that sits above the expiration line for long calls. It represents the "theoretical" profit or loss if you were to close the trade right now.
The gap between the curved T+0 line and the angular expiration line represents Extrinsic Value (or Time Value). As time passes, the curved line slowly "decays" and moves closer to the angular expiration line. This phenomenon is known as Theta Decay. On your chart, if you see the curve sagging toward the flat line, you are seeing the visual representation of time eating away at your option's value.
How Volatility Impacts the Chart
While the strike price and premium are fixed at the time of trade entry, Implied Volatility (IV) is a dynamic force that changes the "shape" of the T+0 curve on your call option chart.
- Increasing Volatility: If the market expects a massive move (e.g., ahead of an earnings report), the T+0 curve will expand upward (for long calls). This means the option becomes more expensive, and your potential profit at any given stock price (before expiration) increases.
- Decreasing Volatility (IV Crush): If volatility drops suddenly, the T+0 curve will collapse toward the expiration line. This explains why a trader can be "right" about the direction of a stock but still lose money—the volatility contraction reduced the option's value faster than the stock's price increase could compensate.
Common Pitfalls When Reading Call Option Charts
Even experienced traders can misinterpret these visual aids. Avoiding these common errors will ensure your risk management remains intact.
1. Ignoring the "Cost of Carry" and Fees
Most basic payoff charts do not include brokerage commissions or the interest costs of margin. In 2026, while many retail platforms offer "zero-commission" trading, the bid-ask spread remains a significant hidden cost. Ensure your mental break-even point accounts for the "slippage" encountered when entering and exiting the trade.
2. Confusing a Payoff Diagram with a Price Chart
A price chart shows Time vs. Price. A call option payoff chart shows Underlying Price vs. Profit. It is easy to look at a diagonal line moving upward and think it represents the stock's path over time. It does not. It represents a "snapshot" of a specific moment (usually expiration).
3. Overestimating the "Unlimited" Profit
While the chart shows the line going up forever, real-world constraints exist. Stocks rarely "moon" to infinity in a single expiration cycle. When looking at your chart, use a "probability of profit" overlay if your platform provides one. This adds a bell curve over the X-axis, showing you the statistical likelihood of the stock actually reaching those high-profit zones.
Practical Steps for Utilizing Call Option Charts
To effectively use these charts in your 2026 trading strategy, follow these steps:
- Identify Your Target: Determine where you think the stock will be by a certain date.
- Select a Strike Price: Enter the strike into your charting tool to see where the "kink" in the hockey stick will appear.
- Analyze the Premium: Notice how a higher premium moves the entire horizontal line further down the Y-axis (increasing your risk).
- Check the Break-even: Ensure the break-even price is a realistic target for the stock within the timeframe.
- Simulate "What-If" Scenarios: Use your platform’s tools to shift the T+0 curve for different dates and volatility levels. This helps you understand how the trade might perform if the stock moves quickly vs. slowly.
Frequently Asked Questions
What happens to the chart if I buy multiple call options?
If you buy multiple contracts of the same strike, the shape of the chart remains the same, but the scale of the Y-axis (Profit/Loss) increases. Your maximum loss (the premium) becomes deeper, and the slope of the profit line becomes steeper. This represents increased leverage.
Why does my call option chart look like a curve instead of a hockey stick?
If you are looking at a "live" or "analytical" chart before expiration, you are seeing the T+0 line. This curve accounts for time value and volatility. As the option approaches expiration, this curve will gradually sharpen into the classic hockey-stick shape.
Can I use a call option chart for covered calls?
Yes, but a covered call chart looks different than a standard long or short call. Because you own the underlying stock, the chart combines the stock's linear profit profile with the short call's capped profile. The result is a line that goes up diagonally and then flattens out (caps) at the strike price.
Does the chart show me when to sell?
The payoff chart does not provide timing signals. It only shows the financial outcome based on price levels. To determine "when" to sell, you should use technical analysis (on a standard price chart) in conjunction with the risk/reward levels identified on your payoff diagram.
Is the "kink" always at the strike price?
Yes, the strike price is the mathematical point where the option's status changes from having no intrinsic value to having intrinsic value. Therefore, the change in the slope of the P&L line (the kink) always occurs exactly at the strike price.
Final Recommendations
When using a call option chart, always prioritize the Break-even Point over the Strike Price. Many novice traders focus on the strike, failing to realize they need the stock to move significantly further just to recoup the cost of the premium.
For 2026 investors, the most effective way to use these charts is to run "Time Decay" simulations. By visualizing how the curved T+0 line moves toward the expiration line day by day, you can develop a "stop-loss" strategy based on time rather than just price. If the stock hasn't moved toward your target and the time decay is accelerating, the chart will clearly show your window of opportunity closing, signaling a prudent exit even if your price target hasn't been hit.
Image Gallery
Select an image to open it in a new tab.
Simon Caldwell
Enterprise Technology and Systems Editor
