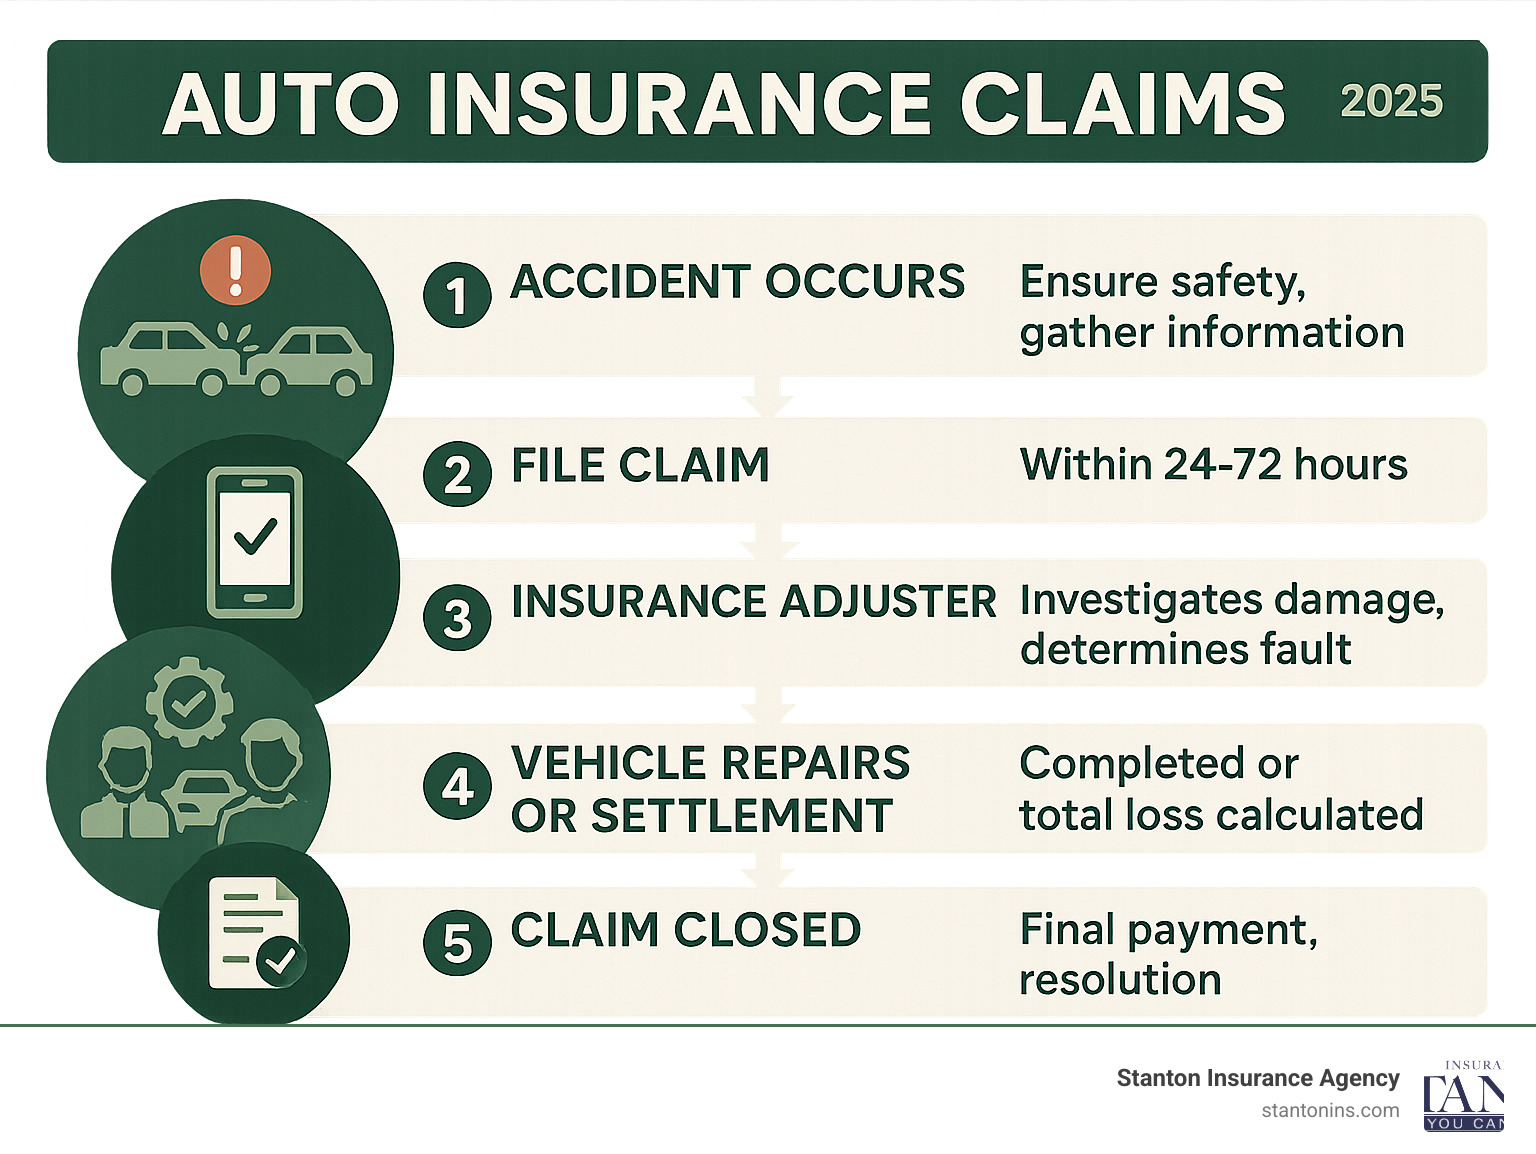
Auto insurance claim frequency refers to the statistical likelihood that a policyholder will file a claim within a specific timeframe, typically measured as the ratio of claims filed to the total number of insured vehicles in a given population. For insurers, this metric is a primary driver of premium pricing, while for consumers, it represents a data point that can influence the long-term affordability and availability of coverage in specific regions or vehicle classes.
Defining Claim Frequency in the Insurance Industry
At its core, auto insurance claim frequency is an actuarial calculation used to assess risk. Unlike "severity," which measures the average cost of an individual claim once it occurs, frequency focuses strictly on the "how often" aspect of risk. If a group of 100 drivers files 10 claims over a policy year, the claim frequency for that group is 10%.
Insurers aggregate this data across vast demographics, geographic locations, and vehicle models. By identifying trends in frequency, companies can adjust their financial reserves to ensure they have enough capital to meet their obligations. If frequency increases unexpectedly, it usually signals to the insurer that they must raise premiums to maintain solvency.
How Claim Frequency Influences Your Premiums
Insurance premiums are not random; they are meticulously calculated based on expected losses. The formula is generally represented as: Pure Premium = Frequency × Severity.
When you apply for a policy, the insurer analyzes your risk profile against the historical frequency data of your peer group. If you drive a vehicle model that is frequently involved in accidents, or if you live in a ZIP code where high-traffic congestion leads to a higher rate of claims, your "expected" claim frequency is higher. Consequently, your premium increases to compensate for the higher probability that the insurer will have to pay out on your policy.
Variables That Drive Claim Frequency
Several distinct factors cause fluctuations in claim frequency. Understanding these can help you better grasp why insurance costs move the way they do, even if your personal driving record remains clean.
1. Geographic and Environmental Factors
Urban areas consistently exhibit higher claim frequencies than rural ones. The density of vehicles, the complexity of road intersections, and the frequency of minor fender-benders in high-traffic cities contribute to a higher statistical likelihood of a claim. Weather patterns also play a significant role; regions prone to severe hail, flooding, or icy roads often see spikes in comprehensive claims during specific months.
2. Vehicle-Specific Attributes
Some vehicles are inherently more prone to certain types of claims. For example, vehicles with high-performance engines may be associated with more frequent speed-related accidents. Conversely, vehicles with advanced active safety systems—such as automatic emergency braking, blind-spot monitoring, and lane-keep assist—often show lower claim frequencies for collisions.
3. Socio-Economic and Behavioral Trends
Changes in human behavior affect frequency metrics. In 2026, the prevalence of mobile phone use behind the wheel remains a primary driver of collision frequency. Additionally, economic shifts can influence claims; during periods of economic hardship, there may be a measurable increase in claims related to minor damages as policyholders look to recover repair costs through insurance rather than paying out-of-pocket.
4. Legislative and Regulatory Changes
State laws regarding mandatory minimum coverage and "no-fault" insurance systems directly impact how often claims are filed. In states with higher mandatory coverage limits, the threshold for filing a claim may be different, which can alter the statistical frequency of claims reported to the insurance department.
Comparing Frequency vs. Severity
It is essential to distinguish between the two pillars of insurance math. Confusing these two terms can lead to a misunderstanding of why insurance costs change.
| Feature | Claim Frequency | Claim Severity |
|---|---|---|
| Definition | The number of claims relative to the number of policies. | The average dollar amount paid per claim. |
| Primary Driver | Accident rates, weather, traffic density, driver behavior. | Medical inflation, repair costs (parts/labor), litigation costs. |
| Impact on Premium | Higher frequency means higher probability of payout. | Higher severity means higher cost per individual payout. |
| Market Indicator | Often affected by local road conditions and safety systems. | Often affected by economic inflation and vehicle tech complexity. |
The Role of Advanced Vehicle Technology
In the current automotive landscape, technology is the most significant variable altering historical frequency trends. The introduction of Advanced Driver Assistance Systems (ADAS) has theoretically reduced the frequency of low-speed rear-end collisions. However, because these systems often require expensive sensors and calibration, a "low-frequency" accident (one that still happens) may result in a higher "severity" cost. Insurers are currently monitoring whether the reduction in accident frequency offsets the increased cost per claim.
Common Misconceptions
There is a persistent myth that filing a single claim will drastically increase one’s personal claim frequency profile to the point of uninsurability. While it is true that your personal history matters, insurers look at a weighted average of risk. A single, small, non-fault claim is often treated differently than a major at-fault collision.
Another misconception is that insurance companies set rates arbitrarily to increase profits. In reality, in most jurisdictions, insurance companies are required by state regulators to file their rating plans, which must be actuarially justified. If claim frequency drops in a specific region, regulators often mandate that companies pass those savings on to consumers in the form of lower rates.
How to Mitigate Your Personal "Frequency" Risk
While you cannot change the statistical frequency of your neighborhood or your vehicle model, you can influence your own risk profile.
- Prioritize Defensive Driving: High-frequency claim segments often include younger, less experienced drivers. Maintaining a clean driving record signals to the insurer that you represent a lower frequency risk than your demographic peers.
- Invest in Safety Features: When purchasing a vehicle, consider those with high safety ratings. Many insurance carriers offer discounts for specific safety features, which effectively acknowledges a lower expected claim frequency.
- Avoid Small Claims: Because many insurance carriers use "claim frequency" as a metric for internal renewals, filing multiple, low-dollar claims for minor scratches or incidents can lead to non-renewal. If an incident is close to your deductible, it is often financially wiser to pay for the repair out-of-pocket.
- Maintain Your Policy: Gaps in insurance coverage can lead to higher risk assessments. Insurers prefer "continuous" policyholders, as they are statistically proven to be more stable risks.
Frequently Asked Questions
Does a high claim frequency in my area mean my insurance will definitely rise? Not necessarily. While insurers do use regional data, they also use individual rating factors. If your personal driving record is excellent and your vehicle is low-risk, your premium may remain stable even if the regional trend is upward.
Can I view the claim frequency of my specific vehicle model? Yes. Organizations like the Highway Loss Data Institute (HLDI) publish data on insurance losses by vehicle make and model. This data tracks both frequency and severity, allowing you to see how your car compares to the industry average.
Why did my insurance go up if I haven’t filed any claims? Insurance is a pooled risk. If the overall "claim frequency" for your insurance pool (people like you, living in your area, driving your type of car) increases, the cost of that risk is shared across the pool. You are paying for the increased statistical probability of loss in your group.
Do "no-fault" accidents affect my frequency score? It depends on the carrier. Most insurers separate at-fault and not-at-fault claims. However, a high number of not-at-fault claims can still suggest that you reside or drive in a high-risk environment, which can influence your premium over time.
What is the difference between frequency and the "loss ratio"? Frequency is the count of claims; the loss ratio is a financial measure comparing the total premiums collected to the total claims paid out. The loss ratio is essentially the "bottom line" of the insurer's profitability.
Conclusion and Next Actions
Understanding claim frequency provides you with a clearer perspective on how the insurance market functions. It moves the conversation from "why is my bill expensive?" to "what factors are influencing the risk associated with my policy?" If you are concerned about how your profile affects your rates, the best course of action is to contact your insurance agent or carrier and request a policy review. Ask them specifically if any discounts—such as those for safety features or continuous coverage—are being applied to your current rate. Additionally, verify your vehicle’s safety classification through independent loss data reports to ensure you are accurately represented in your insurer’s risk models.

Image Gallery
Select an image to open it in a new tab.
Zara El-Hashem
Sociocultural Dynamics and Academics Writer
