How to Read Fibonacci Retracement for Trading: A Complete Technical Guide

Fibonacci retracement is a technical analysis tool used to identify potential support and resistance levels based on mathematical ratios derived from the Fibonacci sequence. By plotting these levels between a significant price high and low, traders can predict where price corrections might end and the primary market trend is likely to resume.
In the 2026 financial markets, technical analysis remains a cornerstone for both retail and institutional traders. Among the vast array of indicators, Fibonacci retracement stands out due to its mathematical elegance and its tendency to act as a self-fulfilling prophecy. Because so many market participants—and high-frequency trading algorithms—watch these specific levels, the price often reacts precisely at the designated ratios.
Understanding how to read and apply Fibonacci retracement requires more than just drawing lines on a chart. It involves identifying the correct "swing" points, understanding the psychological significance of each ratio, and combining these levels with other technical signals to increase the probability of a successful trade.
The Mathematical Foundation of Fibonacci Ratios
To read Fibonacci retracements effectively, one must first understand the origin of the numbers. The sequence was introduced to the Western world by Leonardo Pisano, known as Fibonacci, in the 13th century. The sequence starts with 0 and 1, and each subsequent number is the sum of the previous two (0, 1, 1, 2, 3, 5, 8, 13, 21, 34, 55, 89, 144, and so on).
The "magic" for traders lies in the relationships between these numbers. When you divide a number in the sequence by the number that follows it, the result approaches 0.618, also known as the Golden Ratio or "Phi." If you divide a number by the one two places higher, the result is 0.382. These mathematical constants appear throughout nature, architecture, and financial markets.
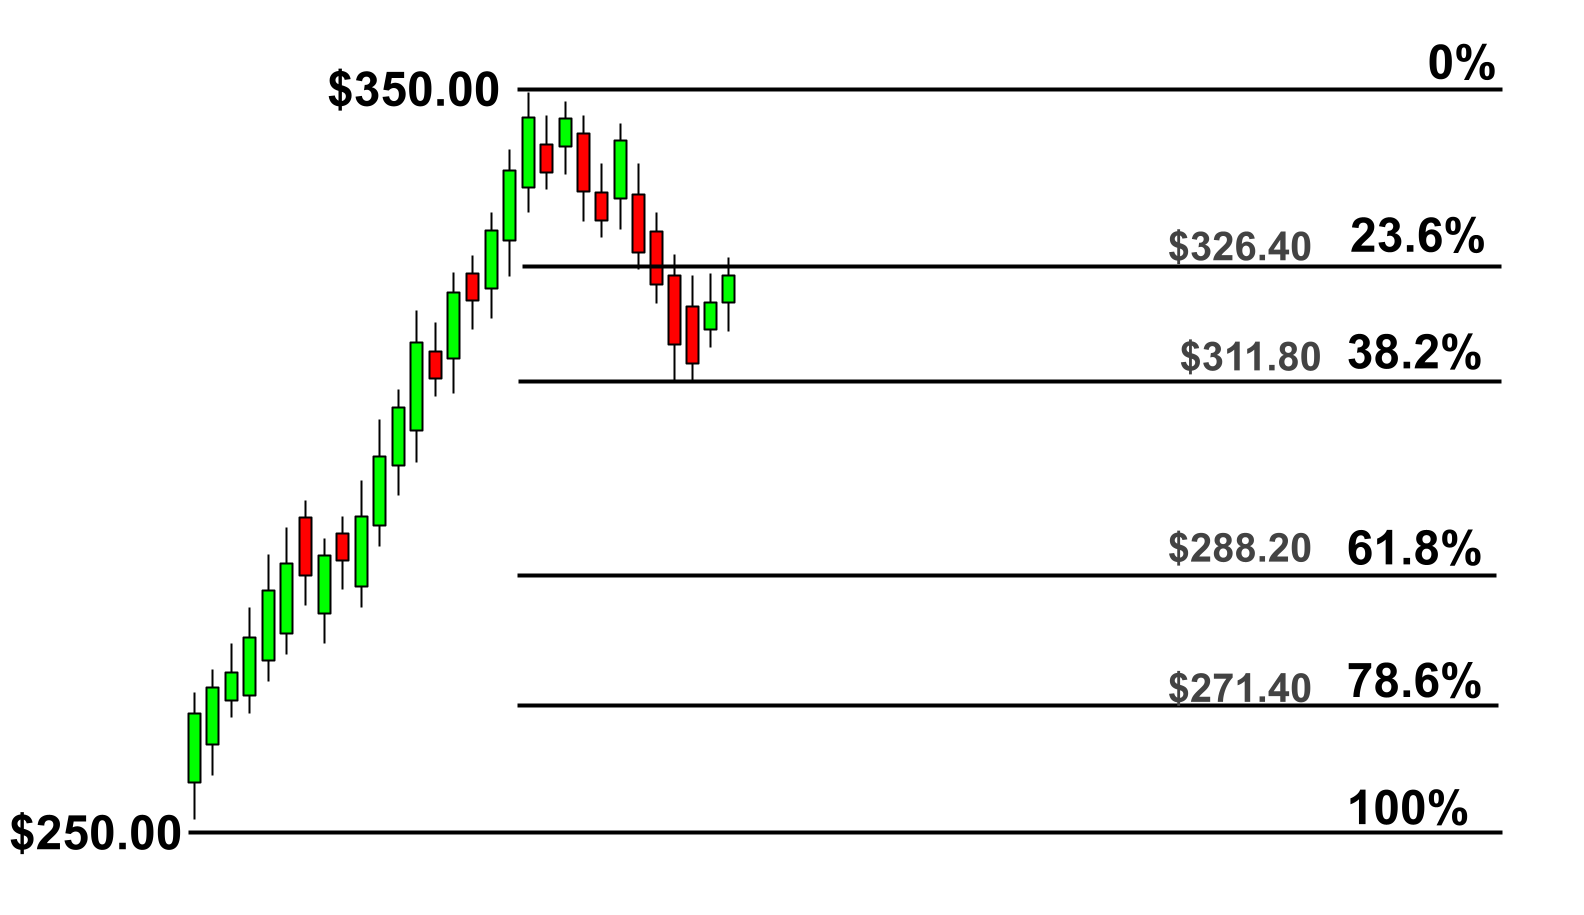
In trading, these ratios are converted into percentages that represent how much of a prior move the price has "retraced" or given back. The primary retracement levels used in technical analysis are:
- 23.6%: Calculated by dividing a number in the sequence by the number three places to the right.
- 38.2%: Calculated by dividing a number by the number two places to the right.
- 61.8%: The Golden Ratio, calculated by dividing a number by the one immediately following it.
- 78.6%: The square root of 0.618, often used as a final level of support or resistance.
- 50.0%: While not a Fibonacci number, this level is included in almost all charting software because markets frequently reverse after retracing exactly half of a major move (a concept rooted in Dow Theory).
How to Correct()ly Plot Fibonacci Retracement Levels
The accuracy of your Fibonacci analysis depends entirely on the points you select to draw the tool. These points are known as "Swing Highs" and "Swing Lows."
Identifying Swing Points
A Swing High is a candlestick peak that has at least two lower highs on both its left and right sides. Conversely, a Swing Low is a trough that has at least two higher lows on its left and right. For a Fibonacci retracement to be valid, these points should represent significant turning points on the timeframe you are trading.
Execution in an Uptrend
To measure a retracement in a bullish market:
- Select the Fibonacci Retracement tool in your charting platform (such as TradingView or MetaTrader).
- Click on the Swing Low (the absolute bottom of the move).
- Drag the cursor to the Swing High (the absolute top of the move).
- The software will automatically draw horizontal lines at the 23.6%, 38.2%, 50%, 61.8%, and 78.6% levels.
In an uptrend, these levels act as potential support. Traders look for the price to pull back from the high and "bounce" off one of these levels to enter a long position.
Execution in a Downtrend
To measure a retracement in a bearish market:
- Click on the Swing High (the start of the move down).
- Drag the cursor to the Swing Low (the bottom of the move).
- The levels will appear above the current price.
In a downtrend, these levels act as potential resistance. Traders look for the price to rally from the low and "reject" one of these levels to enter a short position.

Interpreting the Significance of Each Level
Not all Fibonacci levels are created equal. Depending on the strength of the trend and market volatility, the price will interact with these levels differently.
Shallow Retracements (23.6% and 38.2%)
When a market is in a very strong, aggressive trend, retracements tend to be shallow. If the price only dips to the 23.6% or 38.2% level before resuming the trend, it signals high momentum. Buyers (in an uptrend) are so eager to enter that they aren't willing to wait for a deeper discount. While these levels offer entry points, they also carry higher risk because the "stop loss" usually needs to be placed below the 50% or 61.8% level, resulting in a wider risk-to-reward ratio.
The Median and the Golden Ratio (50% and 61.8%)
The 50% level is a psychological powerhouse. Many institutional orders are clustered here. However, the 61.8% level is widely considered the most critical. It is often referred to as the "Golden Pocket" (sometimes expanded to the zone between 61.8% and 65%). If a price retraces to this level and shows signs of stabilization, it is one of the highest-probability setups in technical trading.
Deep Retracements (78.6%)
The 78.6% level is the "last stand" for a trend. If the price retraces this deeply, the original trend is significantly weakened. A bounce here is still possible, but if the price closes beyond this level, it often indicates a full trend reversal rather than a mere retracement.
| Retracement Level | Market Sentiment | Trading Implication |
|---|---|---|
| 23.6% | Extremely Bullish/Bearish | High momentum; entry for aggressive trend followers. |
| 38.2% | Strong Trend | Standard entry point for strong trending markets. |
| 50.0% | Balanced Correction | Psychological pivot; look for candlestick confirmation. |
| 61.8% | Ideal Value (Golden Ratio) | High-probability reversal zone; "Golden Pocket." |
| 78.6% | Weakening Trend | Deepest "safe" retracement; high risk of trend failure. |
Strategies for Reading Fibonacci with Confluence
Using Fibonacci retracement in isolation is a common mistake among novice traders. To increase accuracy, professional traders look for confluence—the overlapping of the Fibonacci level with other technical indicators.
1. Fibonacci and Horizontal Support/Resistance
The strongest signals occur when a Fibonacci level aligns perfectly with a previous "S/R Flip." For example, if the 61.8% retracement level sits exactly at a price point that was previously a major resistance peak, the likelihood of that level acting as support is significantly higher. This is often called "structural confluence."
2. Fibonacci and Moving Averages
Traders frequently use the 50-period or 200-period Exponential Moving Average (EMA) alongside Fibonacci. If the price pulls back to the 50% Fibonacci level and that level coincides with the 50 EMA, it provides a "double floor" for the price to bounce off.
3. Using Oscillators for Timing
While Fibonacci tells you where the price might reverse, oscillators like the Relative Strength Index (RSI) or Stochastics can tell you when. If the price hits the 61.8% Fibonacci level and the RSI shows an "oversold" condition (below 30), the convergence of these two independent signals creates a compelling reason to buy.
4. Candlestick Confirmation
Never enter a trade simply because the price touched a line. Instead, wait for the price to "react" to the level. Look for bullish reversal patterns (like a Hammer or Bullish Engulfing candle) at the 50% or 61.8% mark in an uptrend. These patterns prove that buyers are actually stepping in at the mathematical level.
Common Pitfalls and How to Avoid Them
Even with the best tools, improper application can lead to losses. In the 2026 trading environment, where algorithmic noise is prevalent, avoiding these mistakes is vital.
- Mixing Swing Points: Ensure you are consistent. If you use the candle wicks for the Swing Low, you must use the candle wicks for the Swing High. Mixing wicks and bodies creates inconsistent levels.
- Ignoring the Long-Term Trend: Fibonacci works best when traded in the direction of the higher-timeframe trend. If the daily chart is bearish, buying a 61.8% retracement on a 15-minute chart is dangerous because you are trading against the larger momentum.
- Over-reliance on Small Timeframes: On 1-minute or 5-minute charts, "market noise" can easily break through Fibonacci levels. These ratios are significantly more reliable on the 1-hour, 4-hour, and Daily charts.
- The "Line-in-the-Sand" Mentality: Market prices are rarely precise to the penny. Treat Fibonacci levels as "zones" rather than exact lines. Allow for some "wiggle room" or "stop hunts" around the levels.
Fibonacci Extensions: The Next Step
Once you master how to read retracements, the natural next step is learning Fibonacci Extensions. While retracements help you find an entry point, extensions help you find an exit or profit target.
By selecting three points (Swing Low, Swing High, and the Retracement Low), you can project where the price will go after the retracement is over. Common extension levels include 161.8% and 261.8%. In 2026, many automated take-profit orders are set at these extension levels, making them excellent targets for closing a successful trade.
Frequently Asked Questions
Which Fibonacci level is the most accurate?
The 61.8% level, known as the Golden Ratio, is widely considered the most accurate and significant level in technical analysis. However, the 50% level is also highly respected by institutional traders. The "accuracy" often depends on the market context; in very strong trends, the 38.2% level may be the only one the price reaches.
Should I draw Fibonacci from the candle body or the wick?
Most professional traders use the candle wicks to draw Fibonacci levels. The wicks represent the absolute extremes of market sentiment (the highest and lowest prices actually traded). Using the wicks ensures you are capturing the full volatility of the price move. Consistency is more important than the choice itself; do not mix wicks and bodies in the same drawing.
Does Fibonacci retracement work for crypto and forex?
Yes, Fibonacci retracement is a "market-agnostic" tool. It works on any liquid asset, including stocks, forex, cryptocurrencies, and commodities. Because it is based on human psychology and mathematical patterns, it is effective across any market where there is significant participation and volume.
Can I use Fibonacci retracement for day trading?
Absolutely. Fibonacci retracement is popular among day traders who use it on 5-minute or 15-minute charts to find entries during the "morning trend" or after a major news release. However, because lower timeframes are more volatile, it is essential to use Fibonacci in conjunction with volume analysis or other indicators to filter out "fakeouts."
Why did the price go right through my Fibonacci level?
Fibonacci levels are not brick walls; they are areas of interest. If a level fails, it usually means the underlying trend has changed or the news catalyst driving the move was too strong for technical levels to hold. This is why stop-loss management is critical. A break of the 78.6% level often indicates that the "retracement" has become a "reversal."
Practical Recommendation
To begin using Fibonacci retracement effectively, start by backtesting the tool on historical data. Open a daily chart of a major asset, such as the S&P 500 or Bitcoin, and identify the major moves of the past year. Draw the Fibonacci levels from the major highs to lows and observe how often the price reacted at the 50% and 61.8% levels.
For live trading in 2026, your next action should be to integrate Fibonacci into a "confluence checklist." Before taking a trade, ensure the Fibonacci level aligns with at least one other signal, such as a horizontal support zone or a moving average. This disciplined approach transforms Fibonacci from a simple drawing tool into a robust trading strategy.
Image Gallery
Select an image to open it in a new tab.


Vivian Cho
Executive IT and Emerging Technologies Reporter
