How to Use Power BI Analyze in Excel to Bridge Business Intelligence and Spreadsheets
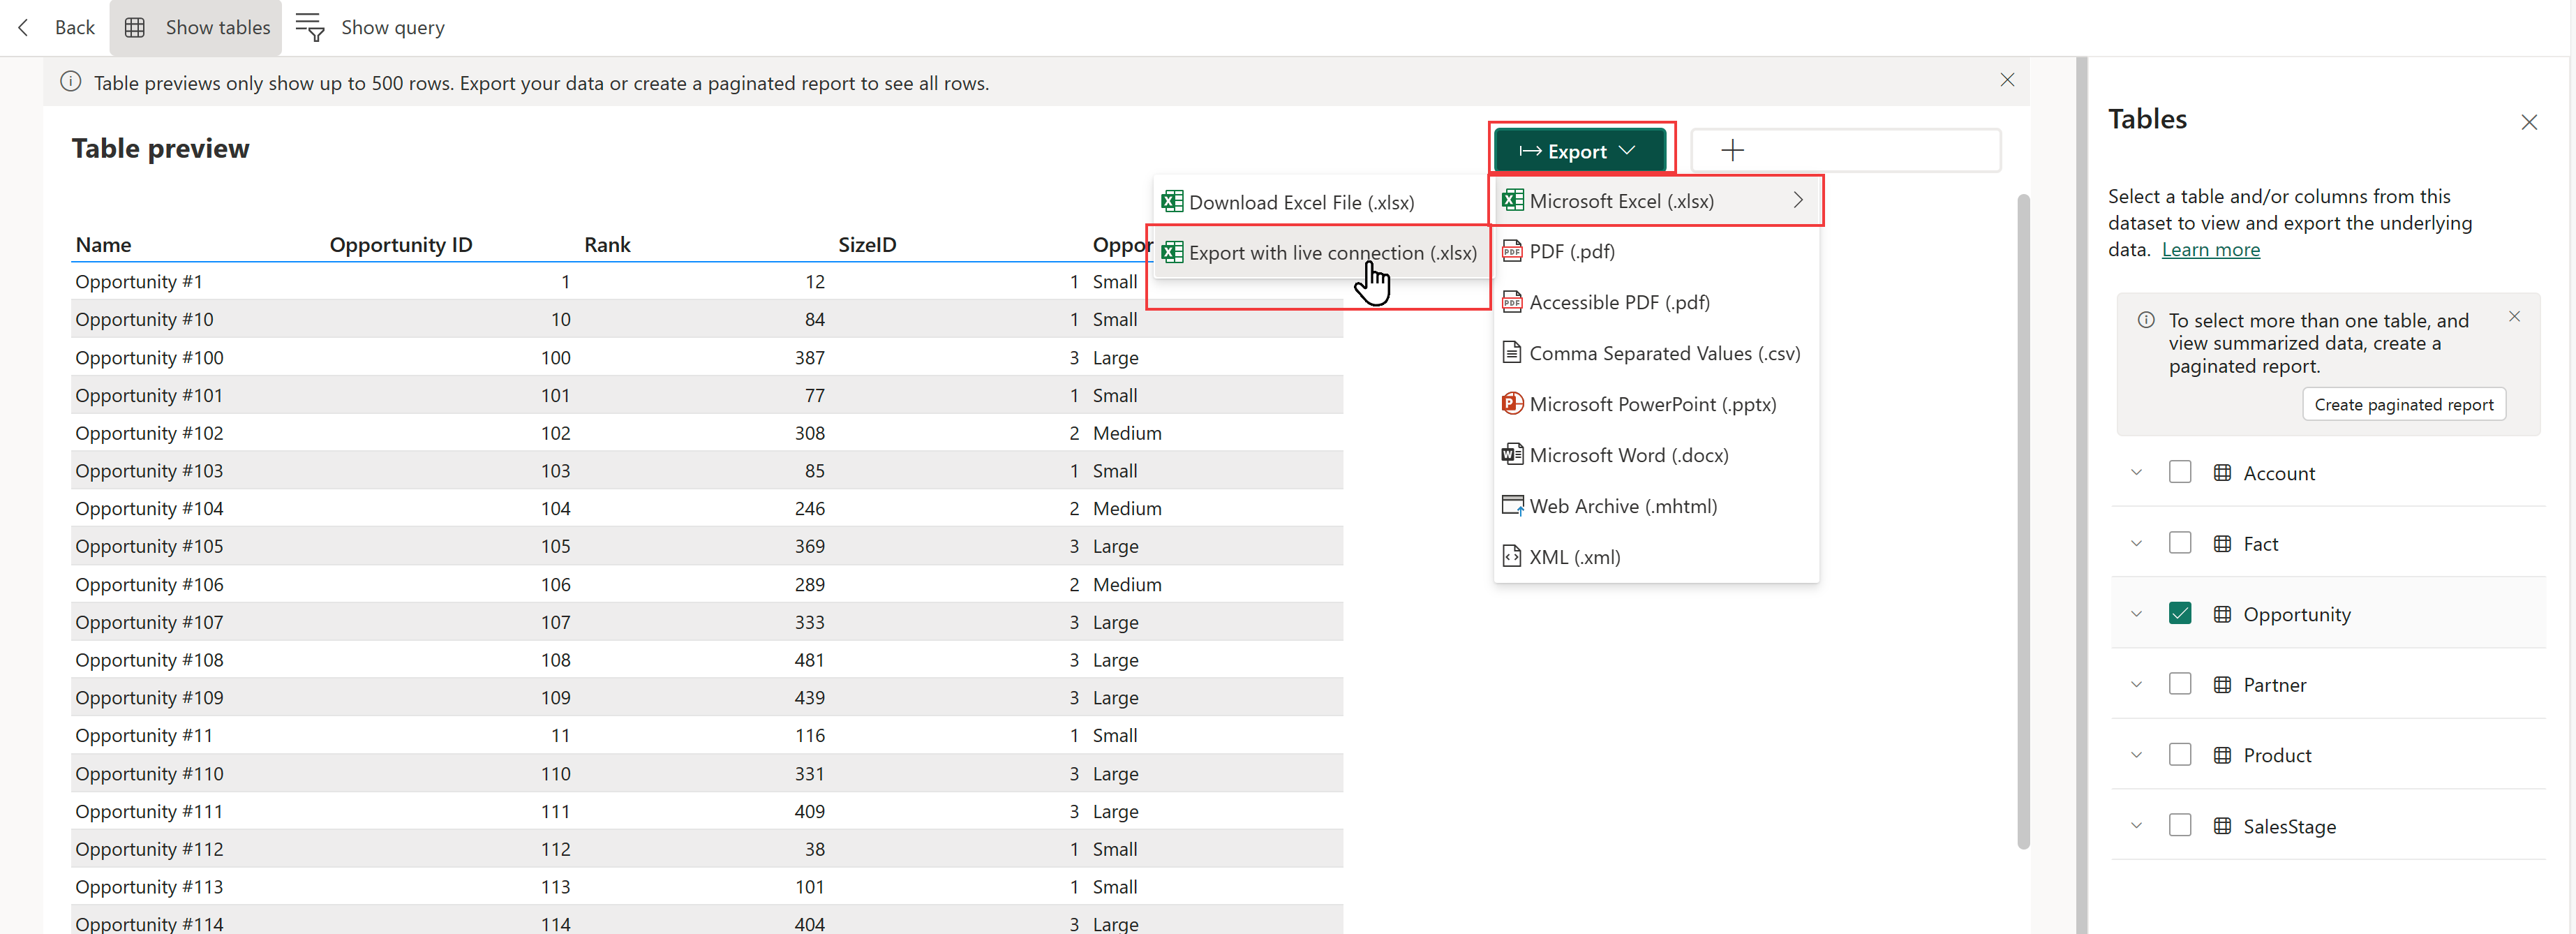
Power BI Analyze in Excel is a powerful feature that lets users connect existing Power BI datasets directly to Microsoft Excel, creating pivot tables, charts, and slicers based on cloud-hosted semantic models while maintaining enterprise data governance and single-source-of-truth reliability.
Understanding the Power BI Analyze in Excel Feature
For organizations heavily invested in the Microsoft ecosystem, bridging the gap between centralized business intelligence (BI) repositories and individual spreadsheet workflows has historically presented architectural challenges. Analysts often export static CSV files or attempt brittle local connections, resulting in version control fragmentation and data drift. The Power BI Analyze in Excel capability resolves this operational friction. By creating a direct, live connection from the Excel desktop client to a Power BI semantic model (formerly known as datasets) residing in the Power BI service or a Fabric workspace, this feature empowers business users to leverage familiar spreadsheet interfaces without sacrificing the integrity of enterprise-grade data models.
At its technical core, Analyze in Excel utilizes the same underlying connectivity protocols as SQL Server Analysis Services (SSAS). When you initiate the command from either the Power BI service or directly from Excel via the Power BI data connector, the system generates a secure .odc (Office Data Connection) file. This small file contains the necessary connection string, authentication parameters, and server details required to query the cloud-hosted tabular model. Excel acts as a presentation layer, submitting DAX (Data Analysis Expressions) queries behind the scenes while the cloud infrastructure handles heavy computational workloads, measure evaluations, and relationship management.
The Core Value Proposition: Governance Meets Flexibility
Organizations frequently struggle to balance two competing priorities: maintaining strict data governance through centralized models and providing end-users with the analytical flexibility they demand. When analysts build disparate spreadsheets from scratch, calculations diverge, and definitions of key performance indicators (KPIs) become inconsistent across departments.
Analyze in Excel enforces consistency because the underlying measures, hierarchies, and security rules are locked inside the Power BI semantic model. If a finance team member creates a pivot table using an enterprise model, any measure—such as Year-to-Date Revenue or Gross Margin Percentage—computes using the exact same logic established by the BI development team. Users can slice, dice, and filter data using standard Excel PivotTables and PivotCharts, but they cannot accidentally alter the core data definitions, ensuring enterprise-wide reporting alignment.
Prerequisites and Licensing Requirements
Before attempting to utilize the Analyze in Excel feature, administrators and end-users must verify that specific licensing, permission, and software prerequisites are met. Because this feature bridges cloud infrastructure and desktop software, configuration gaps at any level will prevent successful connection establishment.
Software and Environment Specifications
- Excel Version: Users must have a modern desktop installation of Microsoft Excel (typically Microsoft 365 apps or Office 2016 Professional Plus and newer). Web-based Excel (Excel for the Web) has limited support for live analytical connections to external tabular models depending on tenant configuration, so the desktop client remains the standard requirement.
- Power BI Publisher for Excel / Client Updates: Ensure that Office installations and Analysis Services OLE DB provider drivers are up to date. Windows systems require the latest Microsoft Analysis Services OLE DB Provider for SQL Server to process enterprise data structures correctly.
- Authentication and SSO: Modern authentication mechanisms, including Multi-Factor Authentication (MFA) and Azure Active Directory (Microsoft Entra ID) credentials, must be supported by the local Excel environment.
Licensing and Permission Tiers
To successfully connect Excel to a Power BI dataset, users require specific subscription tiers and workspace permissions:
| Requirement Component | Minimum Threshold | Operational Notes |
|---|---|---|
| Power BI License | Power BI Pro or Premium Per User (PPU) | Required for the user initiating the connection and accessing the dataset. |
| Workspace Capacity | Pro user workspace, Premium Capacity, or Microsoft Fabric F-SKU | Workspace must support dataset querying and XMLA endpoint interactions (read-only enabled for Premium). |
| Dataset Permissions | Build Permission | Users must have explicit Build permission on the target semantic model, or Member/Contributor access to the workspace. |
| Tenant Settings | "XMLA read-only endpoint and Analyze in Excel with local datasets" | Must be enabled by the Power BI tenant administrator in the Admin Portal. |

Step-by-Step Guide: How to Connect Power BI to Excel
Executing an Analyze in Excel workflow can be approached from two distinct starting points: directly within the Power BI service web interface or from inside the Excel desktop application. Both methods yield identical results, but understanding each approach ensures flexibility depending on user preference.
Method 1: Initiating from the Power BI Service
This is the most common workflow for users who spend their initial discovery time exploring reports and dashboards in their web browser.
- Navigate to the Workspace: Open your web browser, log into the Power BI service, and navigate to the workspace containing your target semantic model.
- Locate the Dataset: Find the specific semantic model you want to analyze. Do not click the report; look specifically for the dataset icon and name.
- Access More Options: Click the ellipsis (
...) button next to the dataset name to open the context menu. - Select Analyze in Excel: Click on the Analyze in Excel option. The Power BI service will automatically download a small
.odcfile to your local machine's default downloads folder. - Open the File: Click on the downloaded
.odcfile. This action launches Microsoft Excel and prompts you to enable external data connections. - Authenticate: If prompted, sign in using your corporate Microsoft 365 credentials associated with your Power BI account to authorize the secure tunnel.
- Build Your PivotTable: An empty Excel PivotTable workspace will appear on your screen, accompanied by the PivotTable Fields task pane on the right side, displaying all tables, columns, and measures from the Power BI model.
Method 2: Initiating Directly from Excel
If you already have Excel open and prefer managing your data sources from within the application, you can pull the model directly.
- Open Excel: Launch a blank workbook in Microsoft Excel.
- Navigate to Data Sources: Go to the Data tab on the Excel ribbon.
- Get Data: Click Get Data > From Database > From Analysis Services.
- Enter Server Details: In the Analysis Services Database Connection wizard, enter your Power BI workspace connection string (retrievable from workspace settings under XMLA connection).
- Select the Model: Provide your credentials, select the specific semantic model from the list of available databases, and click Finish to insert the PivotTable.
Working with Data: PivotTables, Slicers, and DAX Measures
Once the live connection is established, the Excel interface transforms into a dynamic canvas driven entirely by the cloud model. Understanding how to interact with this structure maximizes analytical efficiency while avoiding common pitfalls.
Utilizing Measures and Hierarchies
Unlike traditional Excel pivot tables built on flat tables where you manually drag fields into "Sum of" or "Average of" aggregations, Power BI semantic models come pre-programmed with explicit business logic. When you select a measure (distinguished by a small calculator icon next to the field name in the PivotTable Fields pane), Excel does not guess how to aggregate it. It executes the exact DAX formula written by the model developer.
Furthermore, time-intelligence hierarchies—such as Year, Quarter, Month, and Day—automatically group data into drill-down structures. Dragging a Date hierarchy into the rows section allows you to instantly expand or collapse time periods without writing custom grouping formulas in Excel.
Formatting and Display Consistency
Any visual formatting established in the Power BI model—such as currency symbols, percentage decimals, or conditional styling configurations—carries over into the Excel PivotTable. However, users retain the freedom to apply standard Excel cell formatting on top of the connected data. If you need to present numbers in millions or adjust font colors for executive presentation, local Excel formatting tools remain fully operational without breaking the underlying live connection.
Security, Governance, and Row-Level Security (RLS)
One of the most critical advantages of using Analyze in Excel is that it does not bypass enterprise security protocols. Many organizations worry that connecting Excel to cloud data models creates a security loophole where unauthorized users can pull sensitive records.
How Row-Level Security Applies
If a Power BI dataset has Row-Level Security (RLS) roles defined—restricting regional managers to see only their respective geographic sales data—those exact security filters apply when the user queries the model through Excel. When Excel sends a query to the Power BI service, the cloud model evaluates the identity of the authenticated user launching Excel. It applies the appropriate RLS role dynamically, ensuring that the Excel user sees only the data they are legally and operationally authorized to view.
Data Refresh and Currency of Information
Because Analyze in Excel maintains a live connection rather than importing a static snapshot, the data is as fresh as the underlying semantic model.
- If the semantic model is configured for scheduled refresh in the Power BI service, your Excel pivot tables will reflect the newly refreshed data the next time you click Refresh on the Excel Data ribbon.
- No local data duplication occurs on your hard drive beyond the connection credentials and temporary query cache, significantly reducing compliance and data leakage risks.
Troubleshooting Common Analyze in Excel Errors
Even with proper configuration, users occasionally encounter connection roadblocks. Reviewing common error messages and their systematic resolutions minimizes downtime.
1. "Initialization Failed" or Authentication Loops
- Cause: Stale credentials, multi-factor authentication token expiration, or cached Windows credentials conflicting with Microsoft Entra ID.
- Resolution: Sign out of all Office applications, clear browser cache, ensure your Windows account matches your Power BI tenant credentials, and re-download a fresh
.odcfile.
2. "We cannot connect to the external data source"
- Cause: The local OLE DB provider for Analysis Services is missing, outdated, or the tenant administrator has disabled XMLA endpoints and external connections.
- Resolution: Download and install the latest Microsoft Analysis Services OLE DB provider from the official Microsoft Download Center, and verify with your IT administrator that external tool connections are permitted in the Power BI admin portal.
3. Missing Fields or Outdated Model Structure
- Cause: The Power BI dataset was recently updated with new tables or measures, but Excel is caching an older metadata schema.
- Resolution: Go to the Data tab in Excel, click Refresh All, or close and reopen the workbook to force the client to re-evaluate the model schema from the cloud service.
Conclusion and Recommended Next Actions
Using Power BI Analyze in Excel provides a seamless bridge between centralized enterprise data modeling and the ubiquitous analytical flexibility of spreadsheets. By leveraging live connections, organizations maintain rigid data governance, single-source-of-truth calculations, and robust Row-Level Security while empowering analysts to work within their preferred desktop environment. To implement this effectively, verify that your user licensing meets Pro or Premium standards, confirm that tenant settings allow external connections, and guide your team on utilizing pre-built measures rather than rebuilding calculations locally.
Image Gallery
Select an image to open it in a new tab.


Lars Thomsen
Global Labor Markets and Economic Strategy Editor
