
A healthy price-to-earnings (P/E) ratio is not a static number but a relative valuation metric that depends on the specific industry, the company’s growth trajectory, and prevailing macroeconomic conditions. Generally, a ratio between 15 and 25 is often viewed as a baseline for stable, mature companies, though investors must evaluate it against historical averages and peer performance to avoid misinterpreting value.
The Mechanics of the Price-to-Earnings Ratio
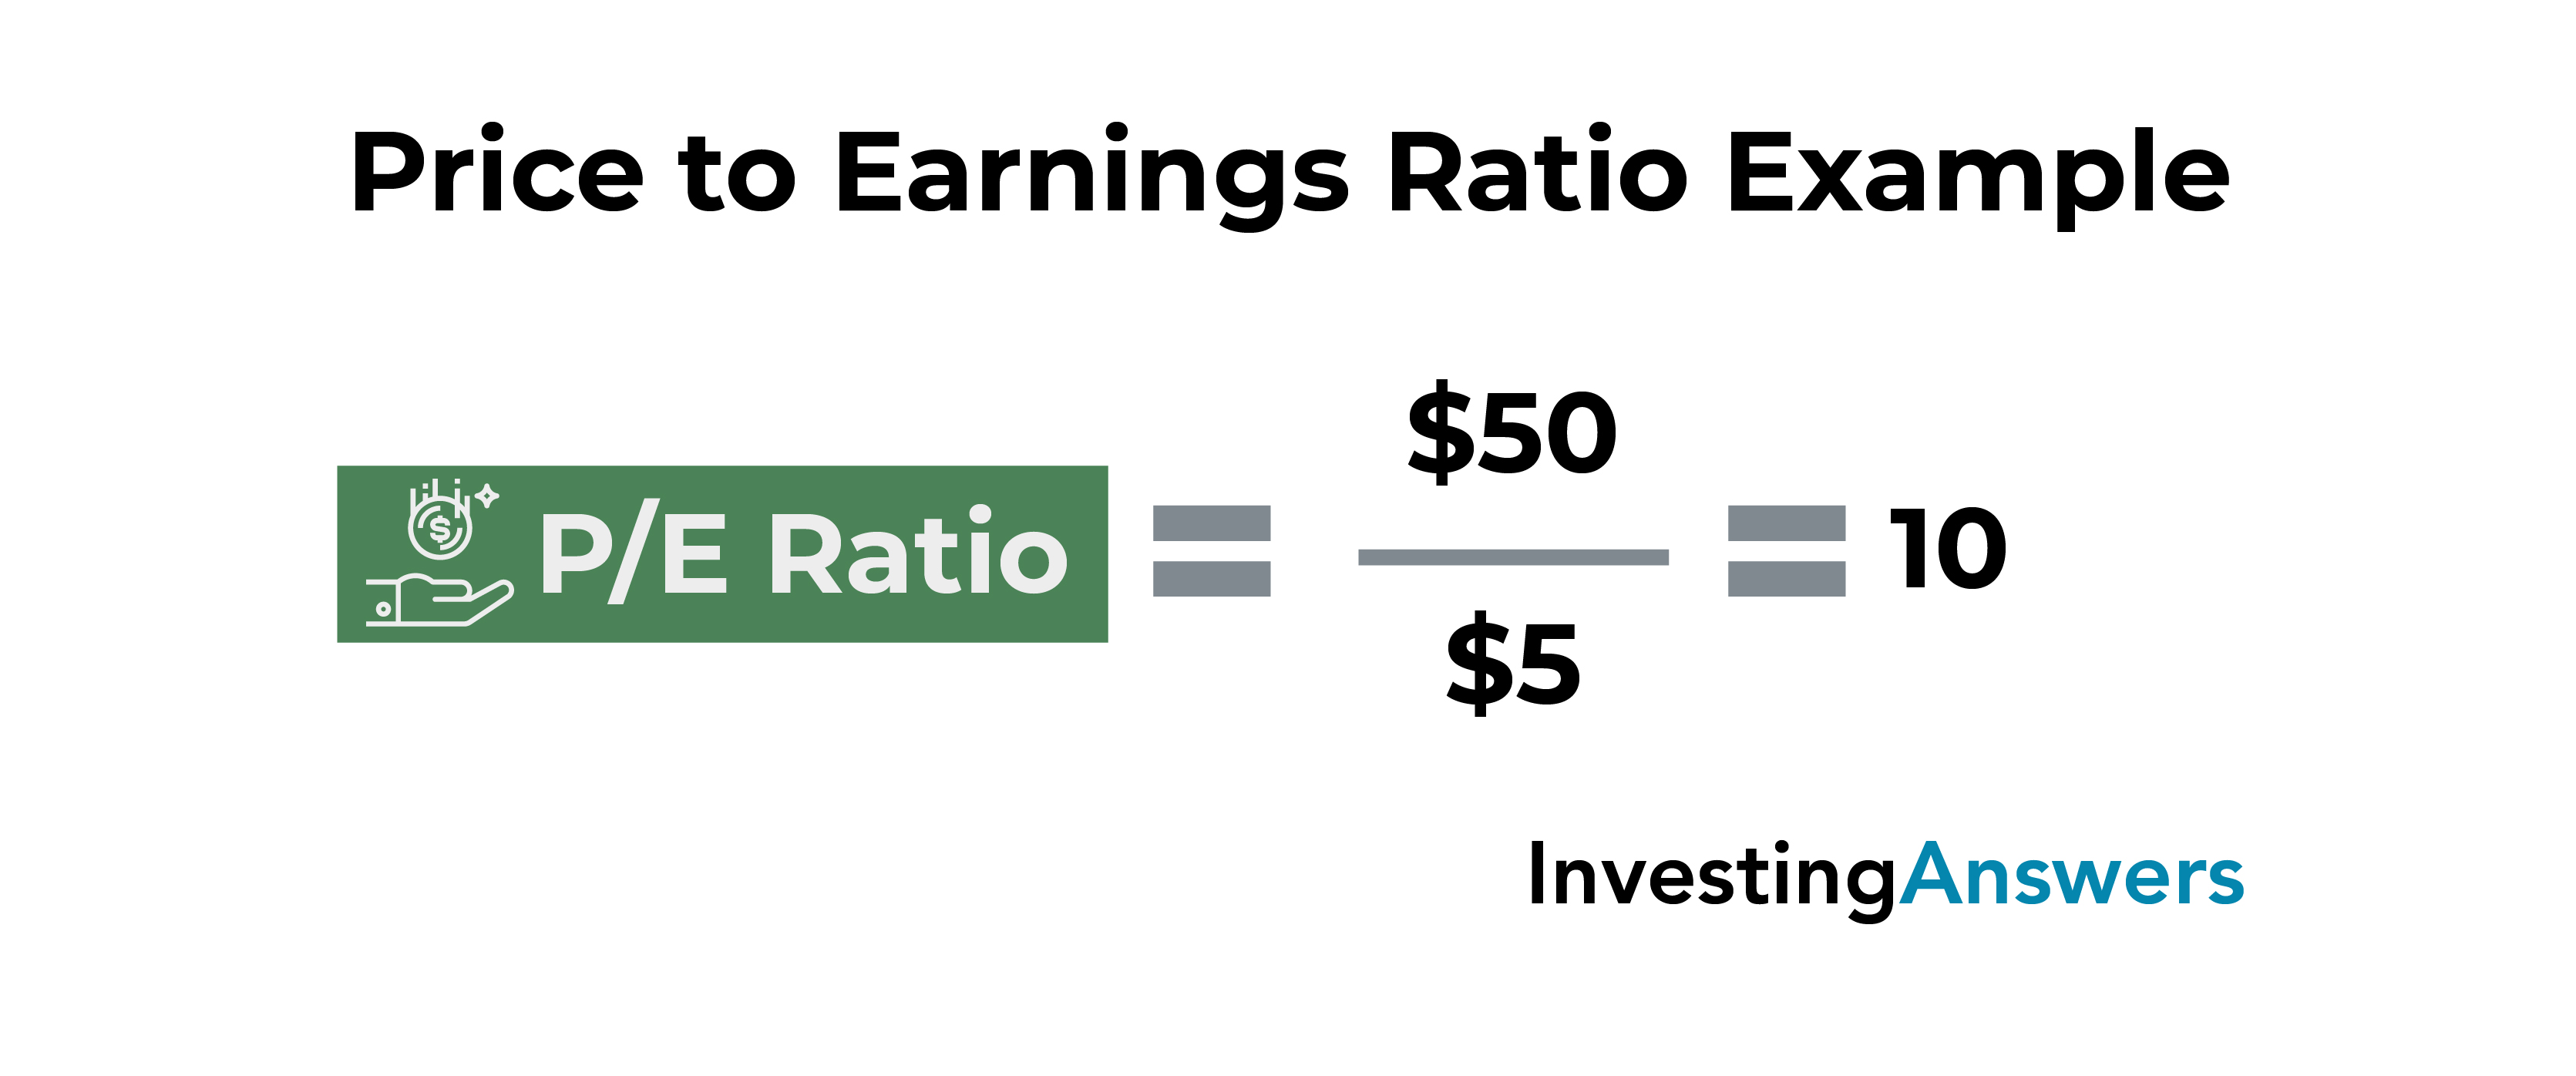
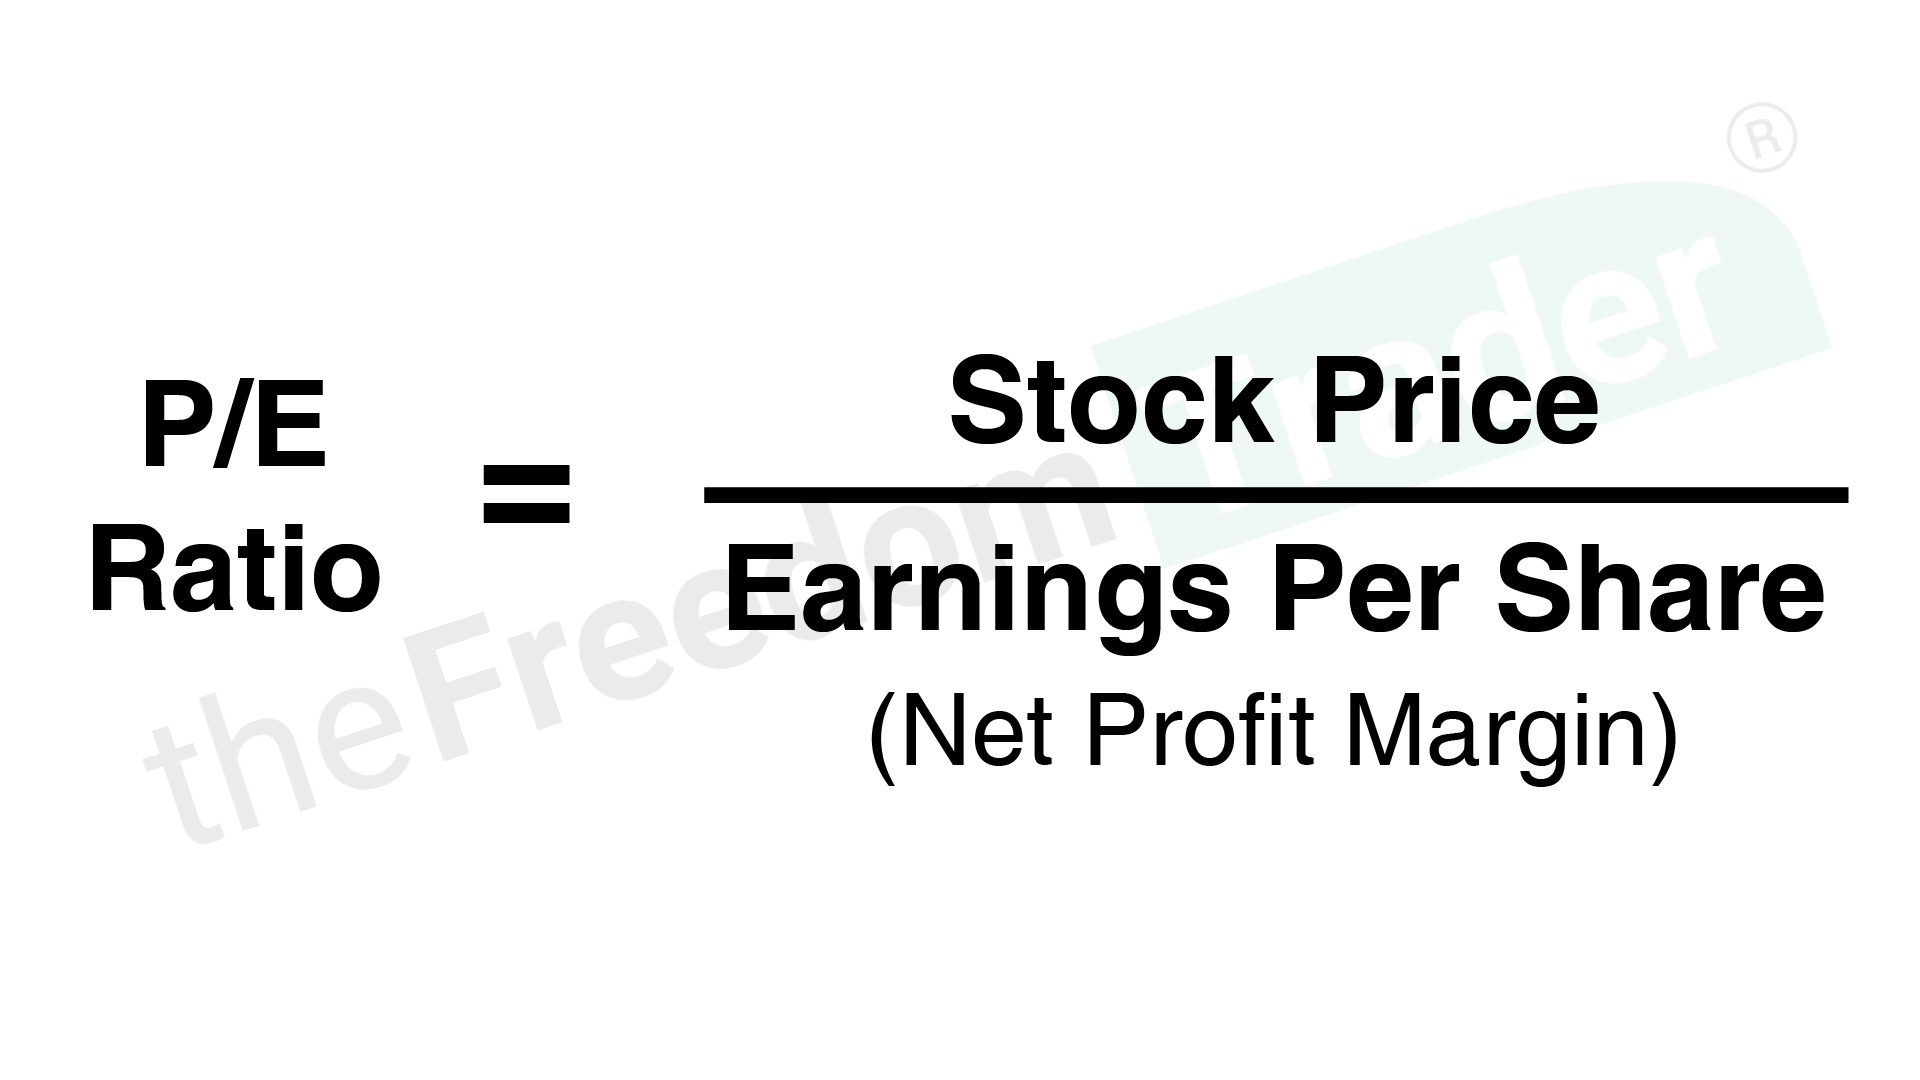
The price-to-earnings (P/E) ratio is one of the most widely utilized tools in fundamental analysis. It serves as a bridge between the stock market’s pricing of a company and the company’s actual bottom-line performance. Mathematically, the ratio is calculated by dividing the current market price per share by the earnings per share (EPS).
When you look at a P/E ratio, you are effectively asking: "How many dollars am I paying for every one dollar of earnings the company generates?" If a company has a P/E of 20, it means investors are willing to pay $20 for every $1 of annual profit. This multiplier functions as a gauge of market sentiment regarding the company's future potential. A high P/E ratio suggests that investors expect higher earnings growth in the future, while a low P/E ratio may imply that the company is undervalued, experiencing stagnant growth, or facing significant operational headwinds.
However, the P/E ratio is a snapshot in time. It uses the price of the stock, which changes second-by-second during market hours, and the EPS, which is typically reported quarterly. Because of this, it is crucial to understand whether you are looking at Trailing P/E (based on the last 12 months of earnings) or Forward P/E (based on analyst projections for the next 12 months).
Contextualizing "Healthy": Industry and Sector Variations
The single biggest mistake novice investors make is comparing the P/E ratios of companies across different sectors. A "healthy" P/E for a utility company would be considered dangerously low for a high-growth technology startup.
Sector-Specific Expectations
Mature industries, such as utilities, consumer staples, and telecommunications, often have lower, more consistent P/E ratios. These companies are usually slow-growing but provide steady dividends, leading to a stable price floor. Conversely, the technology and biotechnology sectors are characterized by rapid innovation and high potential for future earnings expansion. Investors accept higher P/E ratios here because they are paying a premium for the expectation of exponential growth.
The Role of Macroeconomics
In 2026, the broader economic environment remains a critical driver of valuation multiples. When interest rates are low, investors are often willing to pay more for stocks, pushing average P/E ratios across the board higher. When interest rates are higher, borrowing costs increase, and the "discount rate" applied to future earnings rises, which tends to compress P/E multiples. Therefore, a "healthy" ratio in 2026 must be viewed through the lens of current monetary policy and inflation expectations.
Key Factors That Influence P/E Ratios
Beyond the sector, several internal and external factors influence what investors consider a reasonable price to pay for a stock.
Earnings Quality and Volatility
Not all earnings are created equal. A company may report high EPS because of a one-time sale of an asset, which creates a temporary spike in earnings and artificially deflates the P/E ratio. Professional analysts look at "normalized" or "core" earnings to determine if the P/E is truly reflective of ongoing business health. If a company’s earnings are volatile, a high P/E might be a warning sign rather than an indication of growth, as the market may be pricing in a cyclical downturn.
Growth Prospects
The Price/Earnings-to-Growth (PEG) ratio is a vital refinement of the standard P/E ratio. It divides the P/E ratio by the annual earnings growth rate. A PEG ratio of 1.0 is often considered "fair value." If a company has a high P/E of 40 but is growing at 40% per year, the PEG ratio of 1.0 suggests the premium is justified. Conversely, a P/E of 15 for a company with 0% growth might actually be expensive.
Dividends and Cash Flow
Companies that pay consistent dividends often trade at lower P/E ratios. Because these firms return cash to shareholders, they are often viewed as "value" investments. If you are seeking a healthy P/E, look for companies that balance reinvestment with profitability; excessive reliance on debt to maintain EPS can lead to a deceptive P/E ratio that ignores the company’s underlying solvency risks.
Comparative Analysis Table: P/E Norms by Industry
The following table provides a generalized overview of how valuation expectations shift based on the nature of the business. Please note that these are heuristic averages and not absolute investment thresholds.
| Industry Segment | Typical P/E Range | Investor Rationale |
|---|---|---|
| Utilities | 12 – 18 | Stable, regulated returns; focus on dividends. |
| Financial Services | 10 – 15 | Highly cyclical; sensitive to interest rate spreads. |
| Consumer Staples | 15 – 22 | Consistent demand; lower volatility, steady growth. |
| Technology | 25 – 40+ | High growth expectations; R&D intensity. |
| Energy | 8 – 15 | Commodity-dependent; high asset depreciation. |
Common Mistakes When Evaluating P/E Ratios
Evaluating a P/E ratio is not as simple as checking if the number is "low" or "high." Several common pitfalls can lead to poor decision-making.
The "Value Trap"
One of the most dangerous scenarios is the "value trap." A company may appear to have a healthy, low P/E ratio—for example, a P/E of 8 in a sector where the average is 15. An inexperienced investor might buy the stock thinking it is a bargain. However, if the company is in a dying industry or is facing an existential threat (such as loss of market share or regulatory scrutiny), the low P/E is merely a reflection of the market pricing in future losses. Always investigate why a P/E is low before concluding that it represents a discount.
Ignoring Accounting Differences
Different companies may use different accounting methods to report earnings, especially regarding depreciation and amortization. Two companies in the same industry may have different P/E ratios simply because of how they structure their capital expenditures. Always supplement your P/E analysis with a review of the Cash Flow Statement.
Focusing Solely on Historical Means
Comparing a current P/E to a 20-year average can be misleading. Business models change. A company that was a slow-growing retailer in 2006 may have transitioned into a tech-enabled logistics powerhouse by 2026. Comparing its current P/E to its historical P/E from a decade ago ignores the fundamental transformation of the business.
How to Verify Your Valuation Analysis
Before committing capital, take a structured approach to validating your assessment of a company's P/E ratio:
- Peer Comparison: Identify 3 to 5 direct competitors. If the company’s P/E is significantly higher than its peers, identify the specific competitive advantage (moat) that justifies the premium.
- Trend Review: Look at the P/E ratio over the last five years. Is it consistently expanding or contracting? A consistent trend often signals changing investor confidence.
- Growth Correlation: Calculate the PEG ratio. If the PEG ratio exceeds 2.0, the stock may be significantly overvalued regardless of the sector.
- Macro Check: Consider the current interest rate environment. If rates are rising, pressure on high-multiple stocks is usually more intense.
Frequently Asked Questions
Can a P/E ratio be too low?
Yes. An extremely low P/E ratio often indicates that the market expects the company's earnings to decline or that the company faces significant litigation, debt, or operational risks. This is commonly referred to as a value trap.
Is a negative P/E ratio always bad?
A negative P/E ratio occurs when a company has negative earnings (losses). While many early-stage startups operate at a loss, a persistent negative P/E for a mature company is a major red flag indicating an inability to generate profit.
Should I prioritize P/E over other metrics?
No. P/E should be one of many tools. It is best used alongside the Price-to-Sales (P/S) ratio, Price-to-Book (P/B) ratio, and Free Cash Flow analysis to get a complete picture of financial health.
Does a lower P/E always mean a safer investment?
Not necessarily. A company with a low P/E might be cheap for a reason. Safety in investing is determined by the strength of the balance sheet, the consistency of cash flow, and the durability of the business model, not just the entry price.
How do I find the P/E ratio for a specific company?
You can find the P/E ratio on most financial news websites, brokerage platforms, or the company’s investor relations page. Always ensure you are looking at the most recent data as of 2026.
Final Recommendation
When assessing a "healthy" P/E ratio, your goal is to determine if the price you are paying is reasonable relative to the company’s growth prospects and risk profile. Treat the P/E ratio as a starting point for inquiry rather than a definitive answer.
If you are a long-term investor, prioritize companies with a history of earnings stability and a PEG ratio that reflects realistic growth expectations. Avoid the temptation to chase stocks with low P/E ratios without performing a thorough investigation into their underlying business health. If you are uncertain about a valuation, consider a broader index fund approach, which naturally diversifies the risk associated with individual company valuations. Always consult with a qualified financial advisor before making significant investment decisions, especially when navigating complex market cycles.
Image Gallery
Select an image to open it in a new tab.




Vivian Cho
Executive IT and Emerging Technologies Reporter
