How to Create a Project Management Dashboard in Excel
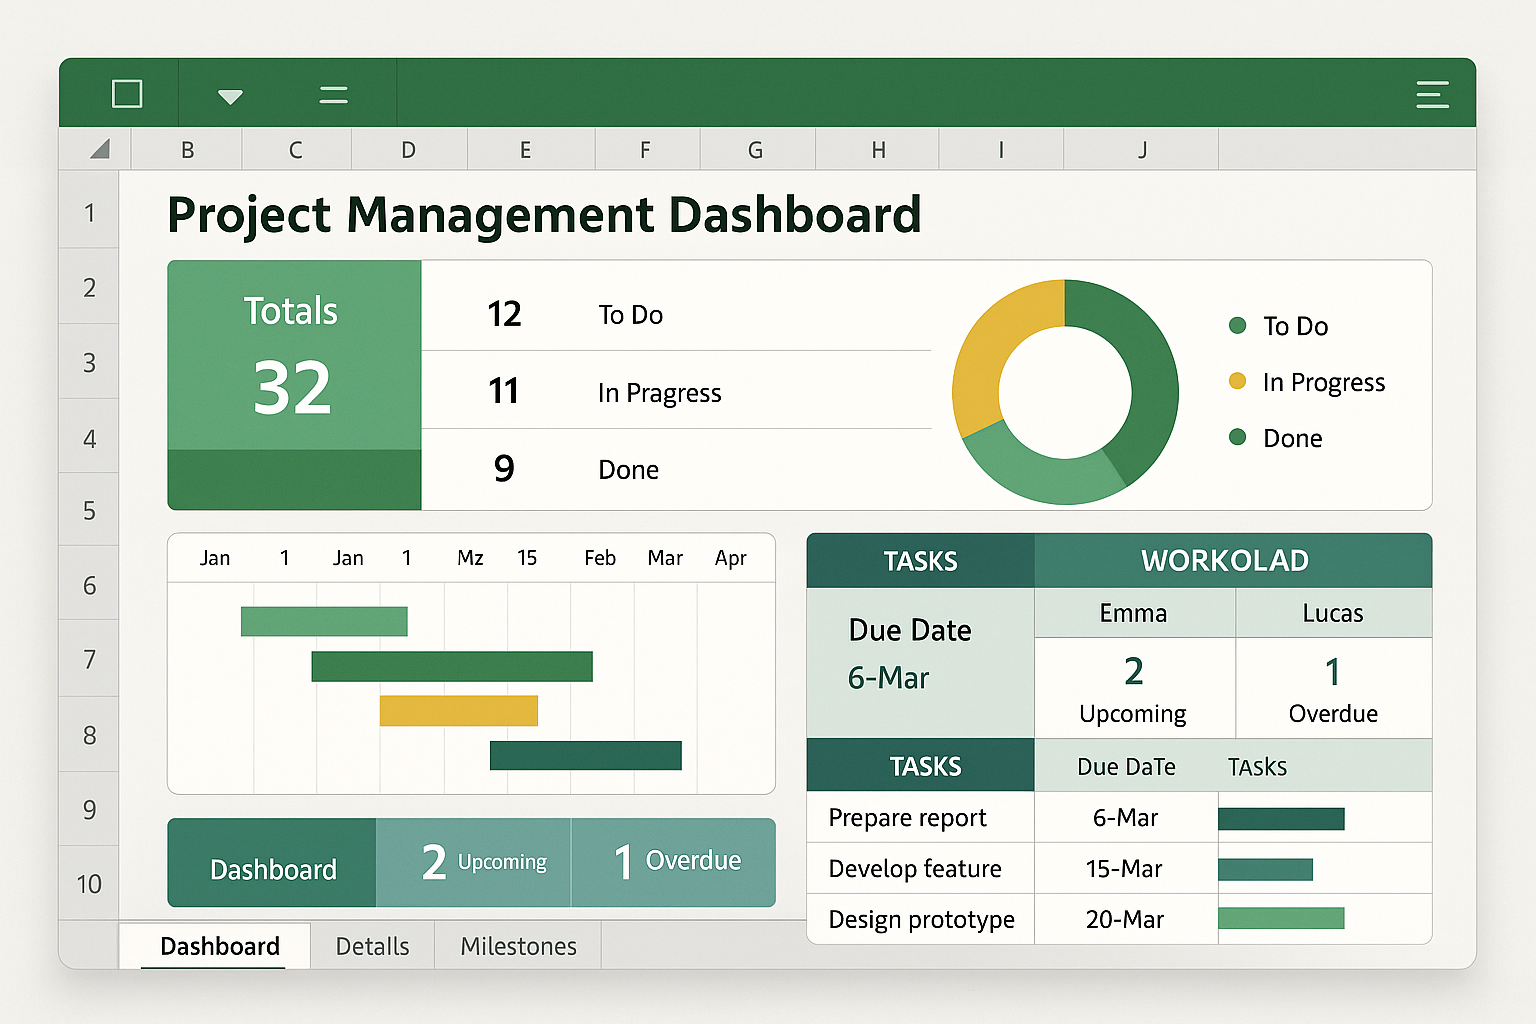
Creating a project management dashboard in Excel involves centralizing your project data into a structured table and using features like PivotTables, Slicers, and conditional formatting to visualize key performance indicators (KPIs). By mapping task status, timelines, and resource allocation, you transform raw spreadsheet data into an interactive, high-level overview that tracks progress against organizational objectives.
Understanding the Role of an Excel Dashboard
A project management dashboard serves as a consolidated communication tool. Unlike a standard project log that requires scrolling through rows of data, a dashboard distills information into a visual summary. In 2026, even with the rise of dedicated project management software, Excel remains the standard for many organizations due to its flexibility, lack of ongoing subscription costs for existing users, and the ability to integrate seamlessly with other Microsoft Office documents.
The primary goal of a dashboard is to answer three critical questions for stakeholders:
- Is the project on track?
- Are resources being utilized effectively?
- What are the immediate risks or bottlenecks?
By building this in Excel, you ensure that the project lead has control over the data structure, allowing for custom metrics that rigid, off-the-shelf software might not support.
Prerequisites for Success
Before creating your first visual, you must establish a clean data environment. A common mistake is attempting to build the dashboard directly on the sheet containing your task list. This creates a cluttered, fragile environment where updating data often breaks your visuals.
Instead, adopt the Data-Analysis-Dashboard structure:
- The Data Sheet: A raw table containing all tasks, deadlines, owners, status, and budget info. It should have no merged cells and a consistent format (one row per task).
- The Analysis Sheet: A staging area where you use PivotTables and functions (such as
SUMIFSorCOUNTIFS) to aggregate the data. - The Dashboard Sheet: The final, cleaned-up interface where you place your charts, slicers, and summary cards.
Step-by-Step Construction Guide
1. Preparing the Data Table
Transform your list of tasks into an official Excel Table by selecting your data range and pressing Ctrl + T. This action ensures that when you add new projects or tasks in the future, your PivotTables and charts will automatically incorporate the new data rows without requiring manual range adjustments. Ensure you have columns for "Task Name," "Owner," "Start Date," "End Date," "Status" (e.g., Not Started, In Progress, Complete), and "% Complete."
2. Building the Analytical Foundation
Navigate to the "Analysis" sheet. Create a PivotTable based on your data table.
- To track Status Distribution, pull "Status" into the Rows area and "Task Name" into the Values area (ensure this is set to "Count").
- To track Timeline Variance, create a helper column in your main table that calculates the difference between "Actual Finish" and "Target Finish." This allows you to visualize potential delays.
3. Designing the Visual Interface
On your "Dashboard" sheet, turn off gridlines for a clean look (View > Show > uncheck Gridlines). Use shapes or standard cells with background colors to create "cards" for your key metrics.
For instance, use a large cell to display a total count of overdue tasks using a simple COUNTIF formula linked back to your raw data. Insert charts—Bar charts are ideal for progress by owner, while Pie or Donut charts effectively communicate status distribution.
4. Enhancing Interactivity
The true power of an Excel dashboard lies in Slicers. Once your PivotTable is selected:
- Go to the
PivotTable Analyzetab in the ribbon. - Select
Insert Slicer. - Choose categories like "Owner" or "Department."
- Connect these slicers to all your PivotTables and charts.
When you click an owner's name, the entire dashboard updates to show only that person’s tasks, deadlines, and project contributions.
Comparing Excel to Specialized PM Tools
| Feature | Excel Dashboard | Specialized PM Software |
|---|---|---|
| Cost | Minimal (Included in Office) | High (Monthly Per-User Fees) |
| Learning Curve | Moderate (Requires Formula Knowledge) | Varies (Platform Dependent) |
| Customization | Unlimited | Restricted by UI/UX Design |
| Collaboration | Manual (Requires File Sharing) | Real-time, Native Integration |
| Scalability | Lower (Risk of file bloat) | High (Handles massive datasets) |
Troubleshooting Common Issues
- Data Refreshing: PivotTables do not refresh automatically. You must either click "Refresh All" on the Data tab or add a small macro to trigger an update whenever the workbook opens.
- Date Calculations: If your progress bars are not showing correctly, check that your date columns are formatted as "Date" rather than "Text." Excel’s inability to perform math on text dates is the most frequent cause of formula errors.
- Layout Shifts: When adding new data, existing charts may overlap. Use the "Selection Pane" to group elements and ensure your dashboard is set to a fixed print area if you intend to export it as a PDF for meetings.
Best Practices for Maintenance
An effective dashboard is one that is actually used. In 2026, the complexity of data can lead to "dashboard fatigue," where users ignore information because it is too granular. Keep your design minimal:
- Focus on exceptions: Highlight tasks that are at risk or behind schedule.
- Use color intentionally: Use red/yellow/green status indicators consistently. Do not use vibrant colors for non-essential data.
- Automate inputs: Use Data Validation lists (drop-downs) for status updates to prevent users from entering "Finished," "Done," and "Complete" as three different statuses, which would break your counts.
Frequently Asked Questions
Can I track resource hours in the same dashboard? Yes. Add a "Resource Hours" column to your data table. Use a PivotTable to sum these hours by person or project. You can then use this to create a stacked bar chart to identify who is overallocated versus those who have available capacity.
How do I make the dashboard dynamic for different users? Use Slicers. By keeping your dashboard on a single "master" view, users can filter the information to see only what is relevant to them without needing multiple versions of the same file.
Should I use Excel for large-scale enterprise projects? Excel is excellent for small-to-mid-sized projects. However, if your project involves more than 1,000 tasks or requires real-time input from 20+ people simultaneously, it is advisable to transition the data source to a cloud-based database and use Excel only as the visualization layer (via Power Query).
How do I prevent others from breaking my formulas? Protect your sheet and workbook. Lock the cells containing formulas and headers while leaving the data-entry cells unlocked. This allows team members to update project status without accidentally deleting the logic that powers your charts.
What is the best way to share the dashboard? Exporting to PDF is best for static weekly reports. If you are using Microsoft 365, saving the file to OneDrive or SharePoint allows multiple stakeholders to view the dashboard live, though you should ensure the file is set to "View Only" for non-managing team members to protect your calculations.
Final Recommendation
Start by defining your KPIs before you open Excel. If you try to build the dashboard while you are still deciding what you want to measure, you will end up with a cluttered, ineffective spreadsheet. Begin with a simple Task List and one PivotChart. Build the dashboard in layers, testing each calculation as you go. Once the structure is stable, add the formatting and interactivity that will make it a valuable tool for your team in the coming year.
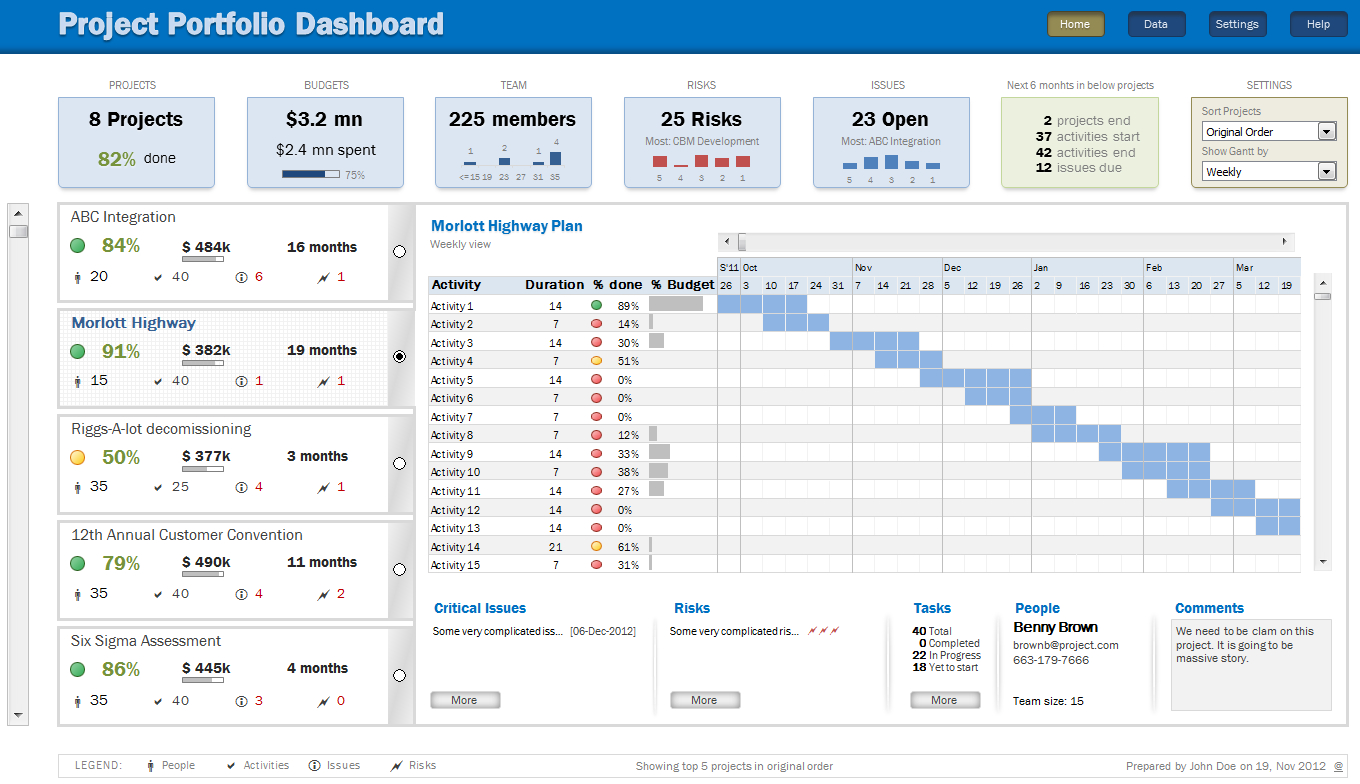
Image Gallery
Select an image to open it in a new tab.

Zara El-Hashem
Sociocultural Dynamics and Academics Writer
