
Calculating Net Present Value (NPV) in Excel helps businesses determine whether a capital project will generate a positive return by discounting future cash flows back to their present value. Using the built-in =NPV() function alongside cash flow timelines allows financial analysts and project managers to account for the time value of money, ensuring sound, data-driven investment and expansion choices.
Understanding Net Present Value in Capital Budgeting
Net Present Value represents the difference between the present value of cash inflows and the present value of cash outflows over a given period of time. In corporate finance and project management, decision-makers face continuous choices regarding resource allocation, equipment purchases, facility expansions, and software integrations. Relying solely on raw, undiscounted revenue projections can severely distort a project's financial viability because a dollar earned five years from now is worth less than a dollar in hand today due to inflation and opportunity costs.
The core principle behind NPV is the time value of money. By applying a discount rate—often representing the company’s weighted average cost of capital (WACC) or the minimum acceptable rate of return—analysts shrink future cash receipts and outlays down to today's purchasing power. If the resulting NPV is positive, the project is expected to add value to the firm, exceeding the hurdle rate. If the NPV is negative, the project destroys value and should generally be rejected.
Mastering this calculation within Microsoft Excel bridges the gap between theoretical financial modeling and actionable operational decisions. Rather than relying on manual discounting formulas for every individual period, Excel provides specialized financial functions designed to handle multi-year projections efficiently, provided the user understands how the software treats cash flow timing and array indexing.
Core Components Required Before Opening Excel
Before entering formulas into a spreadsheet, you must gather and organize three foundational components: the initial investment, the projected future cash flows, and the discount rate. Missing or poorly estimated inputs will render your Excel output unreliable, regardless of how accurate your syntax is.
1. The Initial Investment (Cash Outflow)
Every project starts with an initial outlay of capital, often referred to as Time Zero ($CF_0$). This figure represents all upfront costs required to launch the project, including equipment purchases, licensing fees, installation labor, and initial working capital adjustments. In financial models, this value is almost universally represented as a negative number because it is cash leaving the business.
2. Projected Operating Cash Flows
You must forecast the periodic cash inflows and outflows generated by the project over its expected lifecycle. It is vital to use cash flows rather than net income. Net income includes non-cash expenses like depreciation, whereas cash flow analysis requires tracking actual physical cash entering and leaving bank accounts. Adjust net income by adding back depreciation and subtracting capital expenditures and changes in net working capital.
3. The Discount Rate (Cost of Capital)
The discount rate reflects the riskiness of the project and the opportunity cost of capital. For standard corporate projects, this is typically the company's Weighted Average Cost of Capital (WACC). For riskier ventures, management may apply a higher hurdle rate. Choosing an accurate discount rate is the single most sensitive variable in any NPV model; overestimating or underestimating it can flip a project's recommendation entirely.

Setting Up Your Excel Worksheet Structure
A clean, transparent layout is essential for auditing financial models and presenting decisions to stakeholders. Disorganized spreadsheets often lead to hardcoding errors and misaligned cell references.
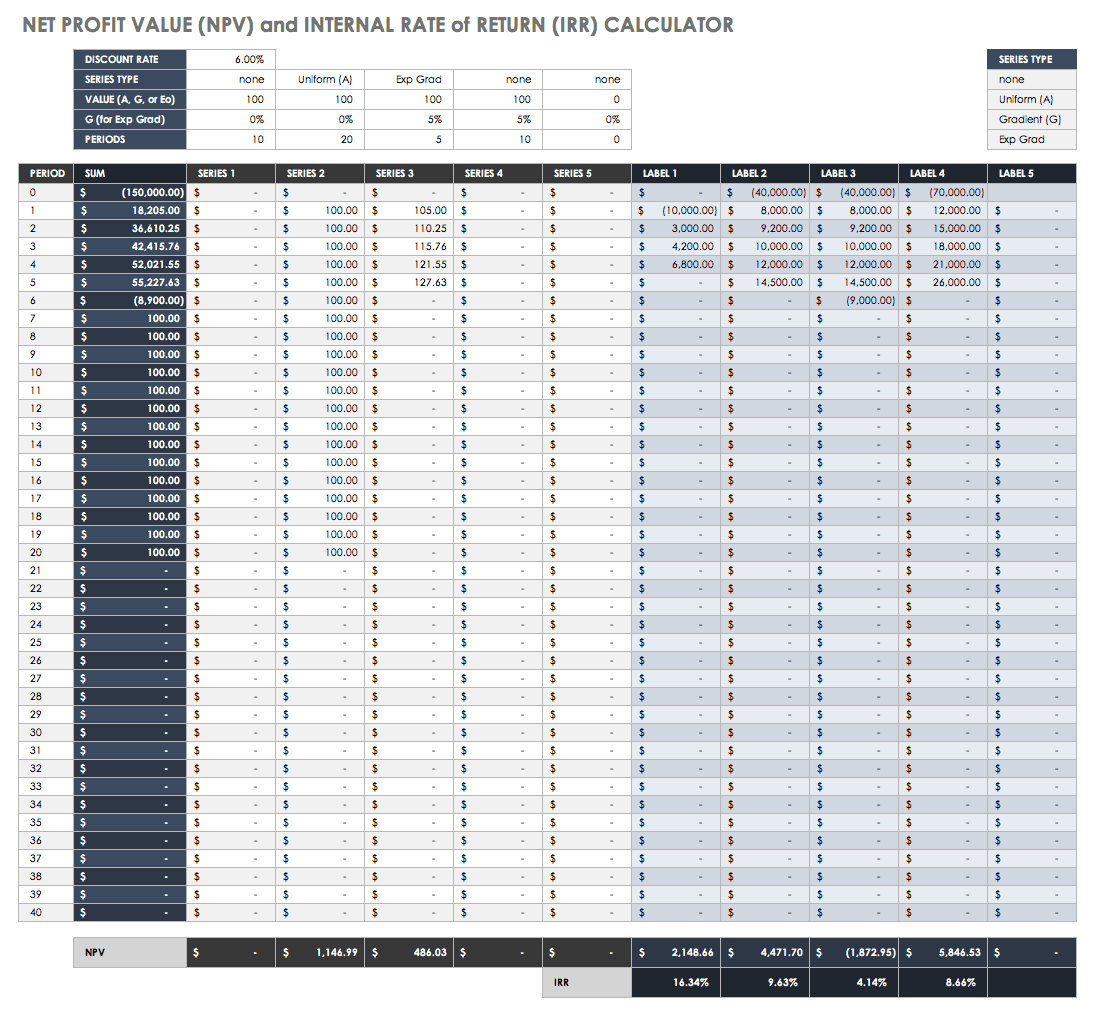
To set up a professional project cash flow model, organize your worksheet into distinct sections: assumptions, cash flow timeline, and output metrics.
| Model Section | Recommended Excel Columns / Rows | Purpose |
|---|---|---|
| Assumptions Block | Cells B1 to B5 |
Houses global variables such as Discount Rate, Project Life, and Initial Outlay. |
| Timeline Header | Row 8 (Years 0, 1, 2, 3...) |
Establishes the discrete time periods for the project lifecycle. |
| Cash Flow Schedule | Row 9 (Outflows and Inflows) |
Lists the net cash generated or spent during each specific period. |
| Evaluation Metrics | Rows 12 to 15 |
Displays final calculated outputs, including NPV and IRR. |
Place your discount rate in a dedicated assumption cell (for example, cell B2 containing 0.08 for an 8% WACC). Keeping assumptions centralized ensures that if management decides to stress-test the model with a 10% or 12% discount rate later, you only need to change a single cell rather than rewriting formulas across the entire workbook.
Step-by-Step Guide to Using the =NPV() Function in Excel
Microsoft Excel features a native financial function named NPV. However, understanding its mechanics is critical because its behavior often surprises first-time users.
The Critical Catch with Excel’s =NPV() Function
In standard mathematical finance, the NPV formula discounts cash flows starting from period 1 all the way to period $n$, and then subtracts the initial cash outflow at period 0.
Excel’s =NPV() function assumes that the first cash flow in your selected range occurs at the end of period 1, not period 0.
If you highlight your initial negative investment along with your future cash flows inside the standard =NPV() range, Excel will mistakenly discount your initial outlay by one period, skewing your final calculation.
Step-by-Step Calculation Procedure
- Enter Your Data: Set up your timeline horizontally or vertically. Let us assume your discount rate is in cell
B2(0.10), your initial investment of-$100,000is in cellC9(Year 0), and your future cash flows for Years 1 through 5 are in cellsD9throughH9($30,000,$40,000,$50,000,$20,000, and$10,000). - Isolate Future Cash Flows: Select only the range containing the future cash flows (
D9:H9), leaving out the initial investment cell (C9). - Write the Formula: Click on the cell where you want your Net Present Value to appear and type the following formula:
=NPV(B2, D9:H9) - Account for the Initial Investment: Because the
=NPV()function only discounts the range provided, you must manually add back (or subtract, since it is negative) the initial cash outflow which occurs at Year 0. Adjust your formula to:=C9 + NPV(B2, D9:H9) - Press Enter: Excel will compute the true Net Present Value by discounting the future cash flows at the rate specified in
B2and combining them with the upfront capital expenditure.
Advanced Considerations: Handling Uneven Cash Flow Timelines
Real-world projects rarely feature evenly spaced, annual cash flows. A software implementation project might require heavy cash outlays over month one, minor maintenance fees at month six, and large subscription returns spanning arbitrary dates. Using the standard =NPV() function for irregularly timed cash flows introduces mathematical inaccuracies.
Utilizing the =XNPV() Function
When cash flows occur on specific, irregular calendar dates rather than standardized yearly intervals, Excel provides the =XNPV() function.
The syntax for =XNPV() is:
=XNPV(discount_rate, values, dates)
- discount_rate: The annual discount rate or hurdle rate.
- values: The array of cash flows, including the initial negative cash outflow at its specific start date.
- dates: The array of exact calendar dates corresponding to each cash flow in the values array.
Why =XNPV() is Superior for Complex Projects
Unlike standard NPV, =XNPV() calculates exact day-counts using the actual number of days between transactions, typically based on a 365-day year convention. If your project evaluation spans mid-year launches, quarterly milestones, or fluctuating payment schedules, incorporating explicit calendar dates via =XNPV() protects your financial model from distortion.
Comparing NPV with Other Project Decision Metrics
While Net Present Value is widely considered the gold standard for capital budgeting because it measures absolute value added to the firm, decision-makers rarely evaluate it in isolation. Comparing NPV against complementary metrics provides a comprehensive risk profile.
| Financial Metric | Core Definition | Primary Advantage | Main Limitation |
|---|---|---|---|
| Net Present Value (NPV) | The absolute dollar value added by the project. | Measures direct impact on shareholder wealth and firm value. | Does not indicate project scale or relative capital efficiency on its own. |
| Internal Rate of Return (IRR) | The discount rate that makes NPV equal zero. | Expresses returns as an intuitive percentage rate. | Can produce multiple or misleading outputs with unconventional cash flows. |
| Payback Period | The time required to recoup the initial investment. | Measures liquidity and basic operational risk exposure. | Ignores cash flows occurring after the payback threshold and time value of money. |
| Profitability Index (PI) | The ratio of present value of cash inflows to outflows. | Useful for rationing capital across mutually exclusive projects. | Requires careful interpretation when project lifespans differ significantly. |
Combining NPV with the Internal Rate of Return (=IRR()) ensures that management understands both the absolute dollar return and the annualized percentage yield of the proposed venture.
Common Mistakes to Avoid in Excel NPV Models
Financial models built under tight deadlines frequently contain subtle errors that distort project valuations. Watch out for these frequent pitfalls:
- Including Depreciation in Cash Flows: Depreciation is a non-cash accounting adjustment used to spread asset costs. Adding it to operating cash flows directly will distort your tax shield assumptions. Make sure you only add back the tax savings generated by depreciation if you are building an after-tax cash flow model.
- Failing to Anchor Cell References: When copying formulas across multiple scenarios or project options, forgetting to use absolute cell references (like
$B$2instead ofB2) for your discount rate will cause formula errors as the rows or columns shift. - Mixing Nominal and Real Rates: Ensure that your cash flow projections account for expected inflation if your discount rate is a nominal rate. If your cash flows are expressed in constant dollars (real terms), use a real discount rate.
- Omitting Terminal Value: For projects that continue operating indefinitely or hold significant salvage value at the end of the forecast period, failing to calculate and add a terminal value will severely understate the true NPV.
Frequently Asked Questions
Why does Excel's NPV formula give a different answer than my manual calculation?
This discrepancy almost always stems from how Excel treats Year 0. If you include your initial negative investment inside the cell range of the standard =NPV() function, Excel discounts that initial outlay by one period. To fix this, apply the initial investment outside of the =NPV() function range by adding it directly to the result.
How do I handle negative cash flows that occur midway through a project?
Negative cash flows occurring after the initial investment—such as major equipment overhauls or mid-term working capital injections—are fully supported by both =NPV() and =XNPV(). Simply input them as negative numbers in their respective periods or dates, and Excel will automatically treat them as outflows during discounting.
What is the difference between NPV and IRR in project decisions?
NPV measures the absolute dollar amount of wealth added to the firm by a project, whereas IRR measures the annualized percentage yield generated by the invested capital. While IRR is helpful for intuitive comparison against a hurdle rate, NPV is mathematically superior when comparing mutually exclusive projects of different sizes or capital requirements.
Can I calculate NPV with a changing discount rate over time?
The standard =NPV() function in Excel accepts only a single, flat discount rate across all periods. If your project requires a variable, term-dependent discount rate structure, you must calculate the present value of each individual cash flow manually using the formula CashFlow_t / (1 + r_t)^t and sum the results using the =SUM() function.
How do I handle inflation when calculating project NPV?
You can handle inflation in two consistent ways: either project your nominal cash flows (incorporating expected price increases) and discount them using a nominal WACC, or project your cash flows in today's constant dollars (real cash flows) and discount them using a real discount rate. Mixing real cash flows with a nominal discount rate will distort your valuation.
Conclusion and Next Actions
Calculating Net Present Value in Excel provides a rigorous, mathematically sound foundation for evaluating project decisions and capital allocation. By maintaining a clean worksheet structure, correctly separating your initial investment from future cash flows, and choosing between standard =NPV() and date-driven =XNPV() functions depending on your timeline complexity, you can eliminate guesswork from financial modeling.
For your next project decision, audit your cash flow assumptions to ensure they reflect true operational cash movements rather than net income, verify your discount rate against current market conditions, and cross-reference your final NPV output with the internal rate of return to present a balanced investment case to stakeholders.
Image Gallery
Select an image to open it in a new tab.


Ingrid Bjornson
Global Cyber Policy and Regulation Analyst
