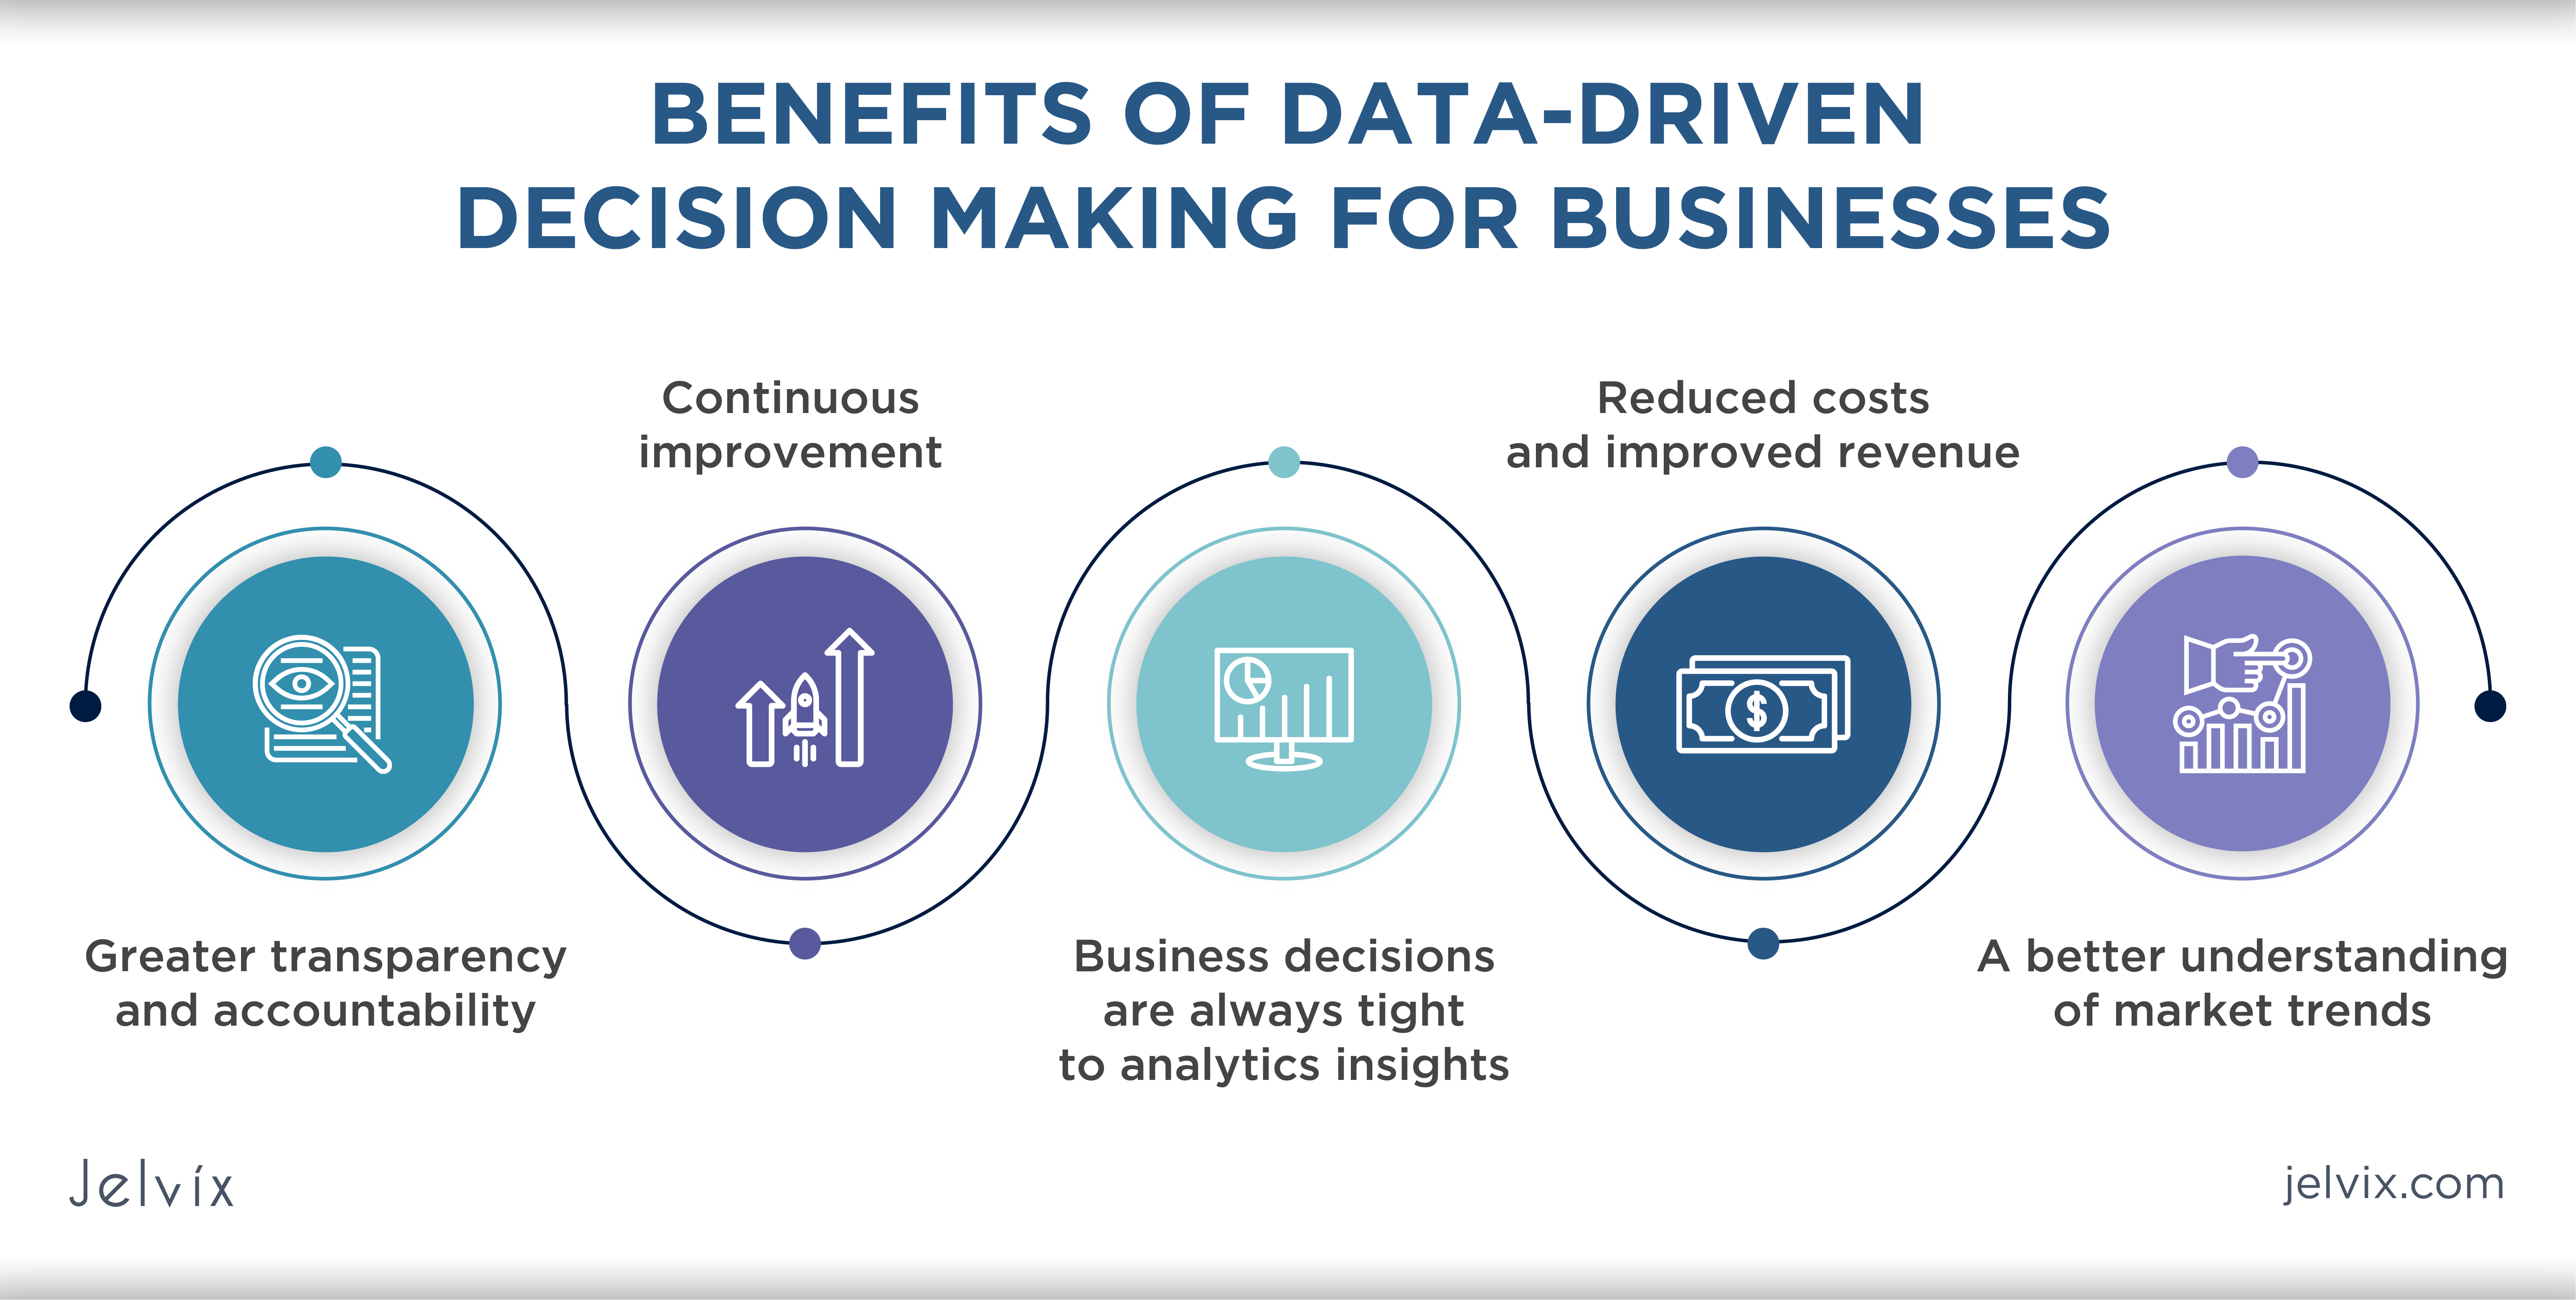
A Business Objects dashboard serves as a centralized interactive interface that aggregates complex organizational data into actionable visual insights. By utilizing the SAP BusinessObjects (BOBJ) BI 2025 platform, decision-makers can monitor key performance indicators (KPIs) in real-time, identify trends, and perform root-cause analysis to ensure every strategic move is backed by empirical evidence rather than intuition.
The landscape of business intelligence has shifted significantly by 2026. While the core mission of data-driven decision-making remains constant, the tools used to achieve it within the SAP ecosystem have matured. Organizations no longer rely on static reports; they demand dynamic, interconnected environments where data flows seamlessly from ERP systems to the executive suite. The SAP BusinessObjects Business Intelligence (BI) platform, specifically through its Web Intelligence (WebI) and SAP Analytics Cloud integration, provides the architecture necessary to support this level of sophistication.
The Evolution of Dashboarding in SAP BusinessObjects
To understand the current state of dashboards in 2026, one must look at the convergence of legacy stability and modern agility. For years, SAP BusinessObjects offered various tools like Xcelsius (SAP Dashboards) and SAP Lumira. However, as of the current BI 2025 release, the platform has consolidated its dashboarding capabilities primarily within Web Intelligence (WebI).
WebI has evolved from a simple ad-hoc reporting tool into a comprehensive dashboarding solution. This transition was accelerated by the introduction of the Fiori-based user interface in version 4.3, which standardized the look and feel across the SAP portfolio. In 2026, a "Business Objects dashboard" typically refers to a highly customized WebI document designed with interactivity, tiles, and side-panel navigation that mimics the functionality of dedicated dashboarding software.
Why Data-Driven Decisions Require a Centralized Dashboard
Data-driven decision-making is the practice of basing strategic goals on data analysis rather than purely on observation or experience. Without a dashboard, data remains siloed in different departments—sales figures in one database, inventory in another, and customer sentiment in a third.
A Business Objects dashboard solves this fragmentation by:
- Providing a Single Version of the Truth: By connecting to a unified "Universe" (the semantic layer), every user views the same data definitions, eliminating discrepancies between departmental reports.
- Enhancing Speed to Insight: Visualizations allow the human brain to process information significantly faster than reading spreadsheets.
- Promoting Accountability: When KPIs are displayed prominently, teams can track their progress against targets in real-time.
Technical Components of a Business Objects Dashboard
Creating a dashboard that effectively drives decisions requires a robust technical foundation. In the BI 2025 environment, several components work in tandem to deliver high-performance analytics.
The Semantic Layer (Information Design Tool)
The heart of any BOBJ dashboard is the Universe. Using the Information Design Tool (IDT), developers create a .unx file that maps complex database structures into user-friendly business terms. In 2026, the Universe remains a critical asset because it abstracts the technical complexity of SQL or SAP HANA views, allowing business users to drag and drop elements like "Revenue," "Region," and "Fiscal Year" without knowing the underlying table joins.
Web Intelligence (WebI) as a Dashboarding Engine
While Crystal Reports handles high-volume pixel-perfect printing, WebI is the engine for interactive dashboards. Modern WebI features include:
- Input Controls: These allow users to filter the entire dashboard by clicking on a list, a radio button, or a tree-map.
- Element Linking: Clicking a specific data point in a chart (e.g., a "North America" bar) can automatically update all other charts on the page to show only North American data.
- Conditional Formatting: Dashboards can use "Alerting" to change the color of a cell or chart element if a KPI falls below a certain threshold, immediately drawing the decision-maker's attention to a problem.
SAP BusinessObjects Mobile
In 2026, data-driven decisions are often made on the go. The SAP BusinessObjects Mobile app allows these WebI-based dashboards to be consumed on tablets and smartphones. The responsive design ensures that the layout adjusts to different screen sizes while maintaining the interactivity required for deep-dive analysis.

Step-by-Step Guide to Building a Dashboard for Decision Support
Building a dashboard is a multi-phase process that begins with understanding the business question and ends with a deployed solution.
Phase 1: Requirements Gathering and KPI Definition
The most common mistake is building a dashboard before defining what a "success" metric looks like. Stakeholders must decide which KPIs are "leading indicators" (predicting future performance) and which are "lagging indicators" (reporting past results).
- Question: "Why is our churn rate increasing?"
- KPIs needed: Customer satisfaction scores, average response time, contract expiration dates, and competitor pricing data.
Phase 2: Data Modeling in the Universe
Once the requirements are clear, the BI developer ensures the data is available in the Universe. This may involve creating calculated measures in the IDT. For example, a "Net Profit Margin" calculation might be built directly into the Business Layer so that every dashboard using that Universe calculates profit identically.
Phase 3: Designing the WebI Layout
In the WebI Rich Client or the Fiori-based web interface, the developer arranges blocks of data.
- Header Area: Contains global filters (Date Range, Department).
- Summary Layer: Large "Big Number" tiles showing the most critical KPIs (e.g., Total Sales, Year-over-Year Growth).
- Analysis Layer: Charts and graphs (Bar charts for comparisons, Line charts for trends, Heat maps for geographical distribution).
- Detail Layer: A hidden or collapsible table that provides the raw data behind the charts for users who need to see the "why" behind a specific number.
Phase 4: Adding Interactivity and Logic
The developer adds Input Controls to allow the user to toggle between different views, such as "Actual vs. Budget" or "Current Year vs. Prior Year." Element Linking is established so that the dashboard feels like an application rather than a document.
Phase 5: Validation and User Acceptance Testing (UAT)
Before the dashboard can drive decisions, its data must be verified. This involves comparing the dashboard's output against the source system (e.g., SAP S/4HANA or an Oracle database) to ensure no logic errors were introduced during the data modeling phase.
Comparison of Dashboarding Tools in the SAP Ecosystem (2026)
| Feature | Web Intelligence (WebI) | SAP Analytics Cloud (SAC) | Crystal Reports |
|---|---|---|---|
| Primary Use Case | On-premise interactive dashboards | Cloud-native augmented analytics | High-volume formatted reporting |
| Data Connection | UNX Universe, BICS, OData, Excel | Live or Acquired (Cloud & On-prem) | Direct SQL, UNX, BICS |
| Interactivity | High (Input controls, drilling) | Excellent (AI-driven insights) | Low (Static/Parametric) |
| Offline Access | Yes (via Mobile app/archiving) | Limited (Mobile app required) | No |
| Advanced Features | Complex variable logic | Predictive modeling & Planning | Pixel-perfect layout control |
The Role of Hybrid BI: BOBJ and SAP Analytics Cloud
As we move through 2026, many organizations have adopted a Hybrid BI strategy. While SAP BusinessObjects remains the "workhorse" for on-premise data and governed reporting, SAP Analytics Cloud (SAC) is often used for high-end data visualization and predictive analytics.
The Business Objects platform facilitates this through the Live Data Connect. This allows an organization to keep their data safely behind their firewall in a BOBJ Universe while using the modern, AI-powered interface of SAC to build dashboards. This hybrid approach is particularly effective for data-driven decisions because it combines the "Enterprise Readiness" of BOBJ (security, scheduling, stability) with the "Smart Insights" of the cloud (machine learning, natural language processing).
Best Practices for Effective Data-Driven Dashboards
To ensure a dashboard actually leads to better decisions, follow these industry-standard guidelines:
1. Avoid the "Data Dump"
A dashboard should not be a collection of every available metric. This leads to cognitive overload. Focus on the "Rule of Seven": try not to include more than seven primary visual elements on a single screen. If more data is needed, use tabs or drill-through reports.
2. Context is King
A number without context is meaningless. For example, "Revenue: $1M" doesn't tell a decision-maker if the company is succeeding. Displaying "$1M (Target: $1.2M)" provides the context necessary to trigger an action, such as a sales review meeting.
3. Use the Correct Visualization
- Trend Analysis: Use line charts.
- Part-to-Whole: Use donut charts or treemaps (avoid pie charts with more than three categories).
- Distribution: Use histograms or box plots.
- Comparison: Use horizontal or vertical bar charts.
4. Prioritize Performance
A dashboard that takes 60 seconds to load will not be used. In the BI 2025 environment, developers should use Query Stripping (which removes unused objects from the SQL query) and ensure that heavy calculations are pushed back to the database level (HANA or Snowflake) rather than being performed in the WebI engine.
Common Challenges and Troubleshooting
Even with a mature platform like Business Objects, hurdles can arise when implementing a dashboard strategy.
- Data Latency: If the dashboard is based on a daily ETL (Extract, Transform, Load) process, but the business needs real-time data for operational decisions, the dashboard may be deemed "irrelevant." The solution is to move toward BICS (Business Intelligence Consumer Services) connections for SAP BW/HANA, which provide live data access.
- User Adoption: Sometimes executives prefer their old Excel sheets. To overcome this, the dashboard must offer something Excel cannot—such as automated scheduling to their inbox every morning or "drill-to-detail" capabilities that save them hours of manual work.
- Mobile Security: Deploying dashboards to mobile devices requires careful integration with Mobile Device Management (MDM) software. SAP BusinessObjects supports various authentication protocols (SAML, Kerberos) to ensure that sensitive data-driven insights do not fall into the wrong hands.
Frequently Asked Questions
Can I migrate my old Xcelsius/Dashboards to the 2026 version of BOBJ?
Direct migration for Xcelsius (Flash-based) is no longer possible as the technology was deprecated years ago. Organizations should rebuild these dashboards in Web Intelligence or SAP Analytics Cloud. The logic used in the original Excel-based Xcelsius models can often be replicated using WebI variables or SAC formulas.
Is the SAP BusinessObjects platform still being updated?
Yes. SAP has committed to the platform with the release of SAP BI 2025. This version focuses on enhanced WebI capabilities, improved OData integration for third-party tools, and deeper connectivity with SAP Analytics Cloud. It ensures that on-premise customers have a supported, modern path forward for their reporting needs.
How does "Data-Driven Decision Making" differ from "Business Intelligence"?
Business Intelligence is the technology and process of collecting and analyzing data. Data-driven decision-making is the cultural outcome of having good BI. BI provides the "what," while data-driven decision-making focuses on the "so what" and the "what next."
Can Business Objects dashboards connect to non-SAP data?
Absolutely. Through the Information Design Tool (IDT), Business Objects can connect to virtually any relational database (SQL Server, Oracle, MySQL, Snowflake, etc.) as well as Big Data sources like Hadoop. This makes it an ideal "Aggregator Dashboard" for companies with a diverse software landscape.
Final Recommendations for Organizations
To successfully implement Business Objects dashboards for data-driven decisions in 2026, organizations should:
- Audit Existing Reports: Eliminate redundant or unused reports before migrating to the BI 2025 platform.
- Invest in Universe Design: A well-built Universe is the foundation of all future dashboards. Do not take shortcuts in the semantic layer.
- Adopt a Hybrid Mindset: Use WebI for governed, operational dashboards and SAC for executive-level, predictive visualizations.
- Focus on Training: Provide end-users with the skills to interpret the data, not just click the buttons.
By focusing on user intent and technical precision, the Business Objects dashboard becomes more than just a reporting tool—it becomes a strategic asset that ensures the organization remains competitive in an increasingly data-centric world.
Image Gallery
Select an image to open it in a new tab.


Simon Caldwell
Enterprise Technology and Systems Editor
