
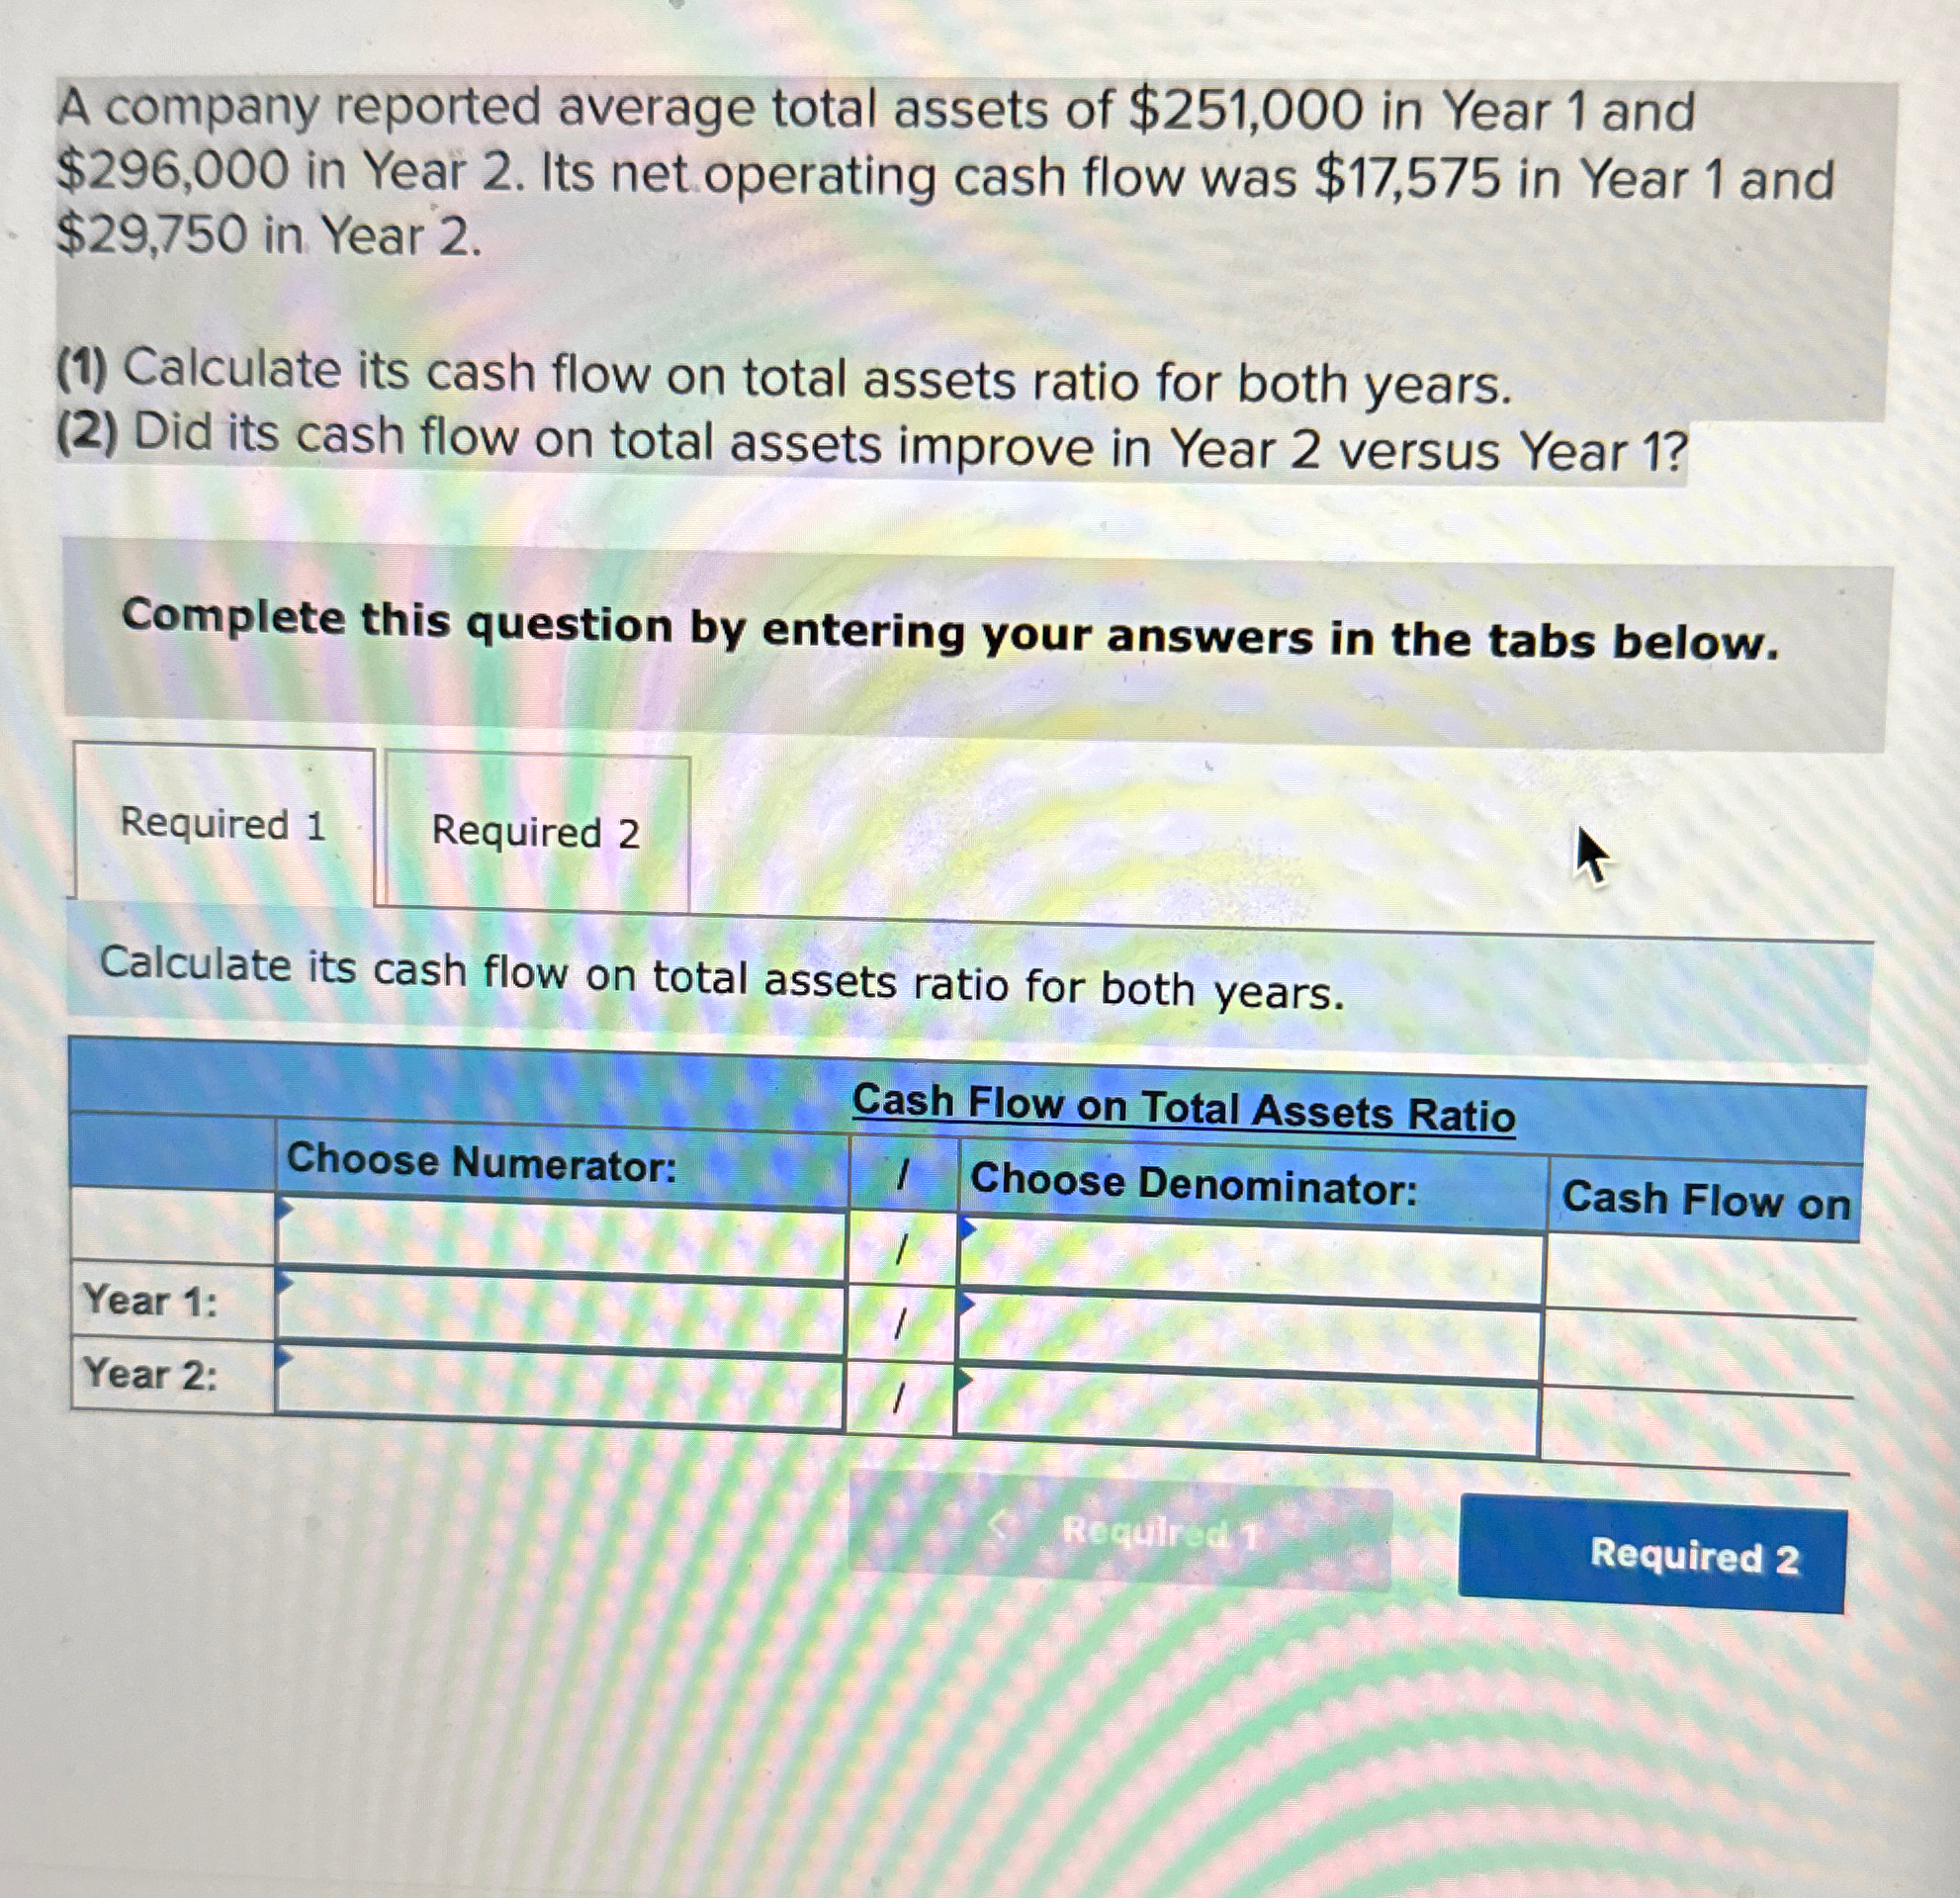
To calculate average total assets, add the total asset value from the beginning of a specific period to the total asset value at the end of that same period, then divide the sum by two. This formula—(Beginning Assets + Ending Assets) / 2—is primarily used to smooth out fluctuations and provide a more accurate basis for financial ratio analysis.
Understanding average total assets is a fundamental requirement for investors, analysts, and business owners who need to measure how efficiently a company utilizes its resources. While a balance sheet provides a "snapshot" of a company’s financial position at a single point in time, business operations occur over a duration. Averaging assets allows for a more consistent comparison between "point-in-time" figures (like assets) and "period-of-time" figures (like revenue or net income).
In this guide, we will explore the nuances of this calculation, the specific financial ratios that rely on it, and the technical considerations required for accurate reporting in 2026.
The Importance of Averaging Assets in Financial Analysis
In accounting, we deal with two types of data: stock and flow. Stock data represents a value at a specific moment, such as the amount of cash in a bank account on December 31st. Flow data represents a cumulative total over a period, such as total sales made throughout the year.
When an analyst wants to determine how much profit a company generated relative to its size, they look at the Return on Assets (ROA). However, comparing the Net Income (a flow variable) to the Ending Total Assets (a stock variable) can be misleading. If a company purchased a massive manufacturing plant on the final day of the fiscal year, its "Ending Total Assets" would skyrocket, making the ROA look artificially low because that new plant hasn't had time to contribute to the year's income.
By using the average total assets, the calculation accounts for the fact that the company operated with a smaller asset base for most of the year. This provides a more equitable representation of management’s efficiency.
The Step-by-Step Calculation Process
Calculating the average is mathematically simple, but the accuracy of the result depends entirely on the quality of the underlying data retrieved from the balance sheet.
1. Identify the Reporting Period
Before beginning, define the timeframe. Most corporate analyses focus on a fiscal year, but quarterly or monthly averages are common for internal management reports or highly seasonal businesses.
2. Locate Beginning Total Assets
For a fiscal year calculation, the beginning total assets are found on the balance sheet from the end of the previous year. For example, if you are calculating the average for the 2026 fiscal year, your "Beginning Total Assets" will be the "Ending Total Assets" reported on the December 31, 2025, balance sheet.
3. Locate Ending Total Assets
The ending total assets are found on the current balance sheet for the period being analyzed. For the 2026 fiscal year, this is the total asset figure as of December 31, 2026.
4. Apply the Formula
The standard formula for the simple moving average of assets is:
Average Total Assets = (Beginning Total Assets + Ending Total Assets) / 2
Example Calculation
Suppose a technology firm reports the following on its consolidated balance sheets:
- Total Assets (Dec 31, 2025): $5,000,000
- Total Assets (Dec 31, 2026): $7,000,000
The calculation would be: ($5,000,000 + $7,000,000) / 2 = $6,000,000
In this scenario, $6,000,000 is the figure used as the denominator for performance ratios throughout the 2026 analysis.
Components of Total Assets
To ensure the calculation is correct, one must understand what constitutes "Total Assets." Under Generally Accepted Accounting Principles (GAAP) and International Financial Reporting Standards (IFRS), total assets are the sum of all current and non-current assets.
Current Assets
These are resources expected to be converted into cash or used up within one year. They include:
- Cash and Cash Equivalents: Petty cash, checking accounts, and short-term gilts.
- Accounts Receivable: Money owed by customers for goods or services delivered.
- Inventory: Raw materials, work-in-progress, and finished goods.
- Prepaid Expenses: Payments made in advance for services like insurance or rent.
Non-Current (Fixed) Assets
These are long-term investments that facilitate business operations over multiple years:
- Property, Plant, and Equipment (PP&E): Land, buildings, and machinery (usually reported net of accumulated depreciation).
- Intangible Assets: Patents, trademarks, and copyrights (reported net of amortization).
- Goodwill: The premium paid during an acquisition over the fair market value of net identifiable assets.
- Long-term Investments: Stocks or bonds held for more than one year.
When calculating the average, you must ensure that the "Total Assets" line item is used, which already accounts for the subtraction of contra-asset accounts like Accumulated Depreciation and Allowance for Doubtful Accounts.
Key Financial Ratios Using Average Total Assets
The primary reason for performing this calculation is to populate specific formulas that measure corporate health.
1. Return on Assets (ROA)
ROA measures how profitable a company is relative to its total assets. It indicates how effectively management is using the company's resources to generate earnings.
- Formula: Net Income / Average Total Assets
A higher ROA indicates more efficient asset management. By using the average, the ratio prevents "window dressing" where a company might sell off assets just before the end of the year to make the ROA appear higher.
2. Total Asset Turnover Ratio
This efficiency ratio measures a company's ability to generate sales from its assets.
- Formula: Net Sales (or Revenue) / Average Total Assets
This ratio is particularly important in capital-intensive industries like manufacturing or telecommunications. If the ratio is low, it suggests the company may have over-invested in assets that are not producing sufficient revenue.
3. DuPont Analysis
The DuPont model breaks down Return on Equity (ROE) into three components: Profit Margin, Asset Turnover, and Financial Leverage. Average total assets are critical here for calculating the Asset Turnover component, providing a deeper look into what is truly driving a company’s financial performance.
Comparing Simple vs. Weighted Averages
While the "Beginning + Ending / 2" formula is the industry standard for external reporting, it may not always be the most accurate method for internal decision-making, especially if the asset base changed significantly at a specific point in the year.
The Limitation of Simple Averages
The simple average assumes that asset growth or decline happened linearly throughout the year. If a company started the year with $1 million in assets and ended with $11 million because it acquired a competitor on January 2nd, the simple average would be $6 million. However, for almost the entire year, the company actually operated with $11 million in assets. Using $6 million in the denominator would grossly overstate the company's efficiency.
The Weighted Average Approach
In cases of massive mid-year fluctuations, some analysts prefer a weighted average or a multi-point average (e.g., averaging the total assets from all four quarters).
- Quarterly Average Formula: (Q1 Assets + Q2 Assets + Q3 Assets + Q4 Assets) / 4
This method provides a "smoother" and more realistic representation of the assets deployed during the year, reducing the impact of seasonal spikes or one-time capital expenditures.
Summary of Asset Categories in Calculations
| Asset Category | Inclusion in Total | Impact on Average |
|---|---|---|
| Cash & Equivalents | Always Included | High liquidity; fluctuates daily but affects the starting/ending balances significantly. |
| Accounts Receivable | Included (Net) | Must use the net value after deducting the allowance for doubtful accounts. |
| Inventory | Always Included | Highly seasonal; quarter-by-quarter averaging is often better for retailers. |
| PP&E | Included (Net) | Large purchases (CAPEX) are the primary reason for using averages to avoid distortion. |
| Goodwill | Included | Generally stable unless an impairment occurs, which can drop the ending balance sharply. |
Common Pitfalls and Troubleshooting
Even seasoned accountants can make errors when calculating average total assets. Avoiding these common mistakes ensures the integrity of your financial modeling.
Mixing Fiscal and Calendar Years
Ensure that the "Beginning Assets" and "Ending Assets" align with the specific fiscal period of the income statement you are analyzing. If a company has a fiscal year ending in June, do not use December 31st balance sheets for your calculation.
Ignoring Asset Impairments
If a company takes a significant impairment charge (writing down the value of an asset) mid-year, the ending asset balance will be significantly lower. While the simple average is technically correct according to the formula, an analyst should note the impairment in their report, as it represents a loss of value rather than a typical operational change.
Consistent Accounting Standards
Ensure that both the beginning and ending figures are calculated under the same accounting framework (e.g., both under US GAAP or both under IFRS). Changes in accounting policy mid-year—such as a change in how leases are capitalized—can make the beginning and ending figures incomparable.
Practical Example: Analysis for 2026
In 2026, many companies are navigating the long-term effects of digital transformation and shifting interest rate environments. Let's look at a hypothetical case study for Global Logistics Corp.
- Net Income (2026): $450,000
- Total Assets (Dec 31, 2025): $2,100,000
- Total Assets (Dec 31, 2026): $2,800,000
Step 1: Calculate Average Total Assets ($2,100,000 + $2,800,000) / 2 = $2,450,000
Step 2: Calculate ROA $450,000 / $2,450,000 = 18.37%
If the analyst had mistakenly used only the ending assets ($2,800,000), the ROA would have appeared to be only 16.07%. By using the average, the analyst correctly identifies that the company was more efficient with the capital it had throughout the year than the year-end snapshot suggested.
Frequently Asked Questions
Why do we divide by 2 when calculating average total assets?
The division by 2 is used because you are taking the arithmetic mean of two data points: the start of the period and the end of the period. This simplifies the varied asset levels throughout the year into a single representative figure that can be compared against "period" data like annual revenue.
Should I use total assets or net assets?
For calculating "Average Total Assets," you must use Total Assets. "Net Assets" refers to Total Assets minus Total Liabilities (which is essentially Shareholders' Equity). Using Net Assets would result in the Return on Equity (ROE) calculation rather than the Return on Assets (ROA) calculation.
Can average total assets be negative?
No, total assets cannot be negative. While individual accounts like "Accumulated Depreciation" are negative (contra-assets), the sum of all assets must be zero or positive. If a company has significant liabilities exceeding its assets, it has negative equity, but its total assets remain positive.
How does depreciation affect the average total asset calculation?
Depreciation reduces the book value of non-current assets over time. Since "Total Assets" is reported net of accumulated depreciation on the balance sheet, the "Ending Assets" figure will naturally be lower due to depreciation, which in turn lowers the overall average. This accurately reflects the diminishing economic value of the equipment being used to generate income.
Is it better to use monthly averages for the calculation?
Yes, for internal management or businesses with high seasonality (like retail or agriculture), a 12-month average is superior to a simple 2-point average. It captures the peaks and valleys of inventory and cash levels that a year-end snapshot might miss entirely.
Expert Recommendation for Next Actions
To master the use of average total assets in your financial workflows, start by standardizing your data collection. When analyzing a company, always retrieve the last three years of balance sheets. This allows you to calculate the average for the two most recent years and identify trends in asset growth.
Furthermore, if you are using these figures for investment purposes, compare the Total Asset Turnover of a company against its direct industry peers. An increasing average total asset base coupled with a declining turnover ratio is a major red flag, suggesting that the company is "empire building"—buying assets that are not contributing to the bottom line. For more information on standardized accounting practices, you can refer to the Financial Accounting Standards Board (FASB) or the International Financial Reporting Standards (IFRS) Foundation.
Image Gallery
Select an image to open it in a new tab.


Zara El-Hashem
Sociocultural Dynamics and Academics Writer
