Understanding American Household Net Worth Percentiles: Benchmarks, Demographics, and Wealth Analysis
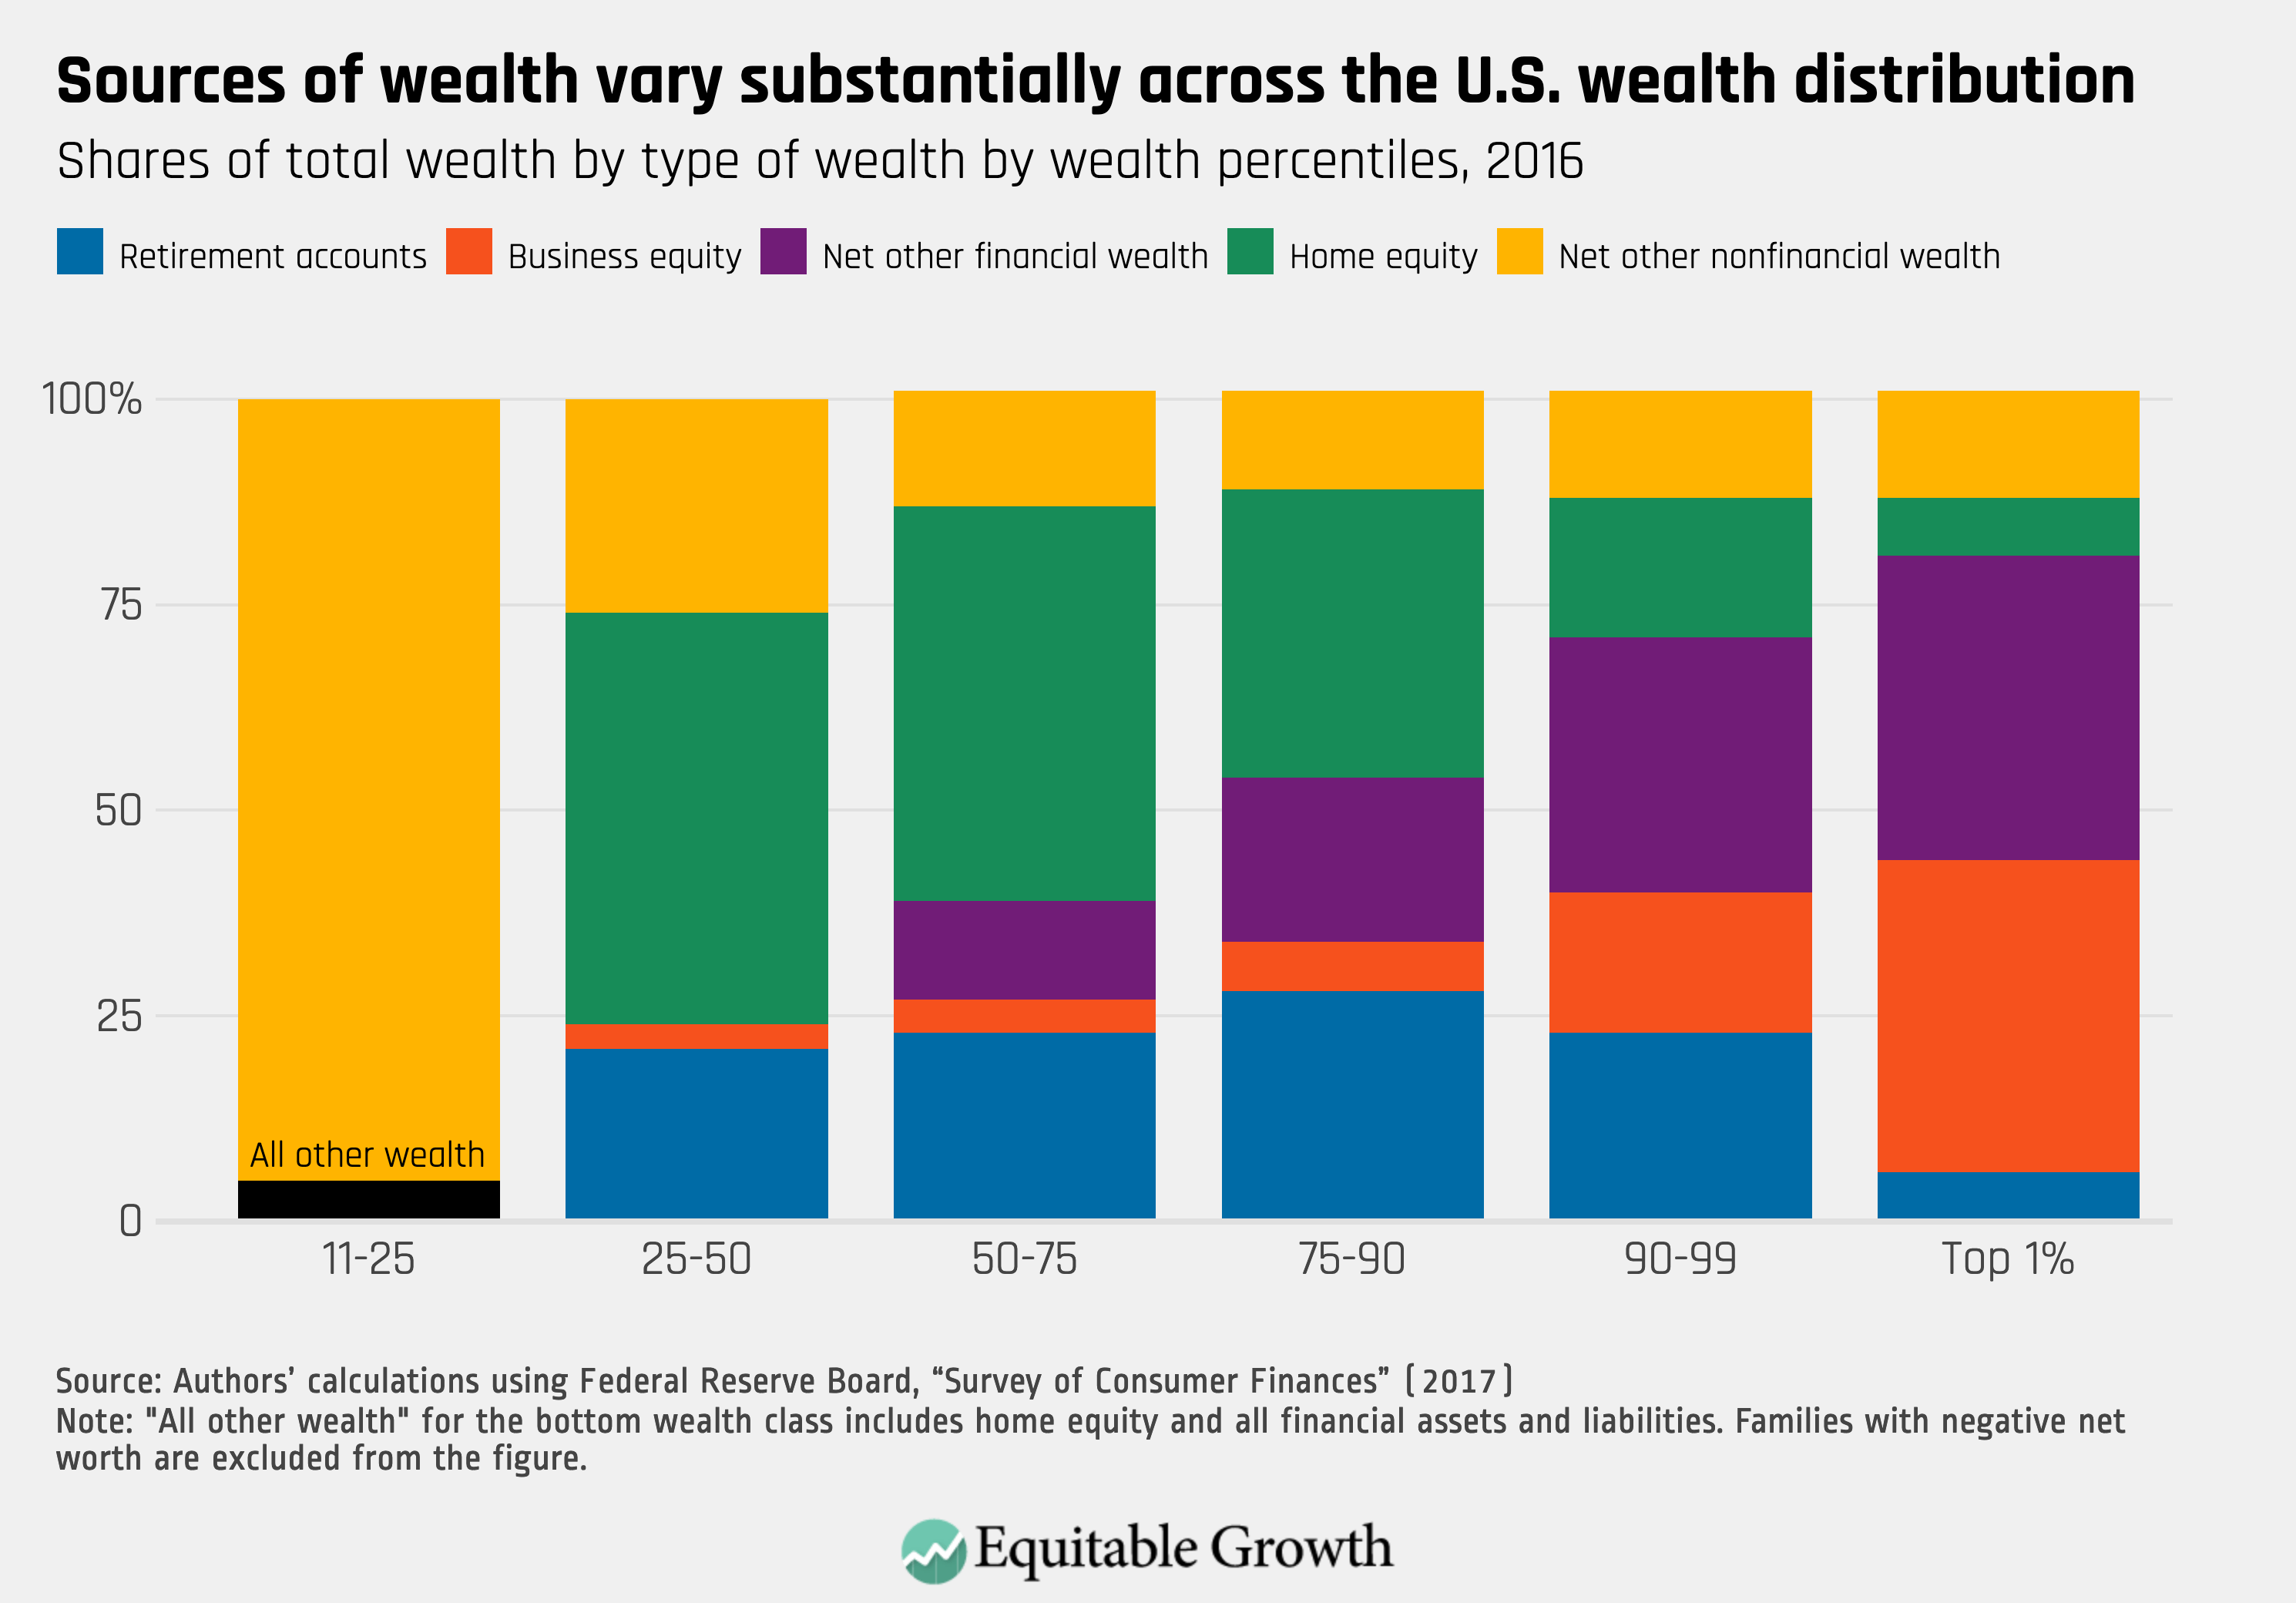
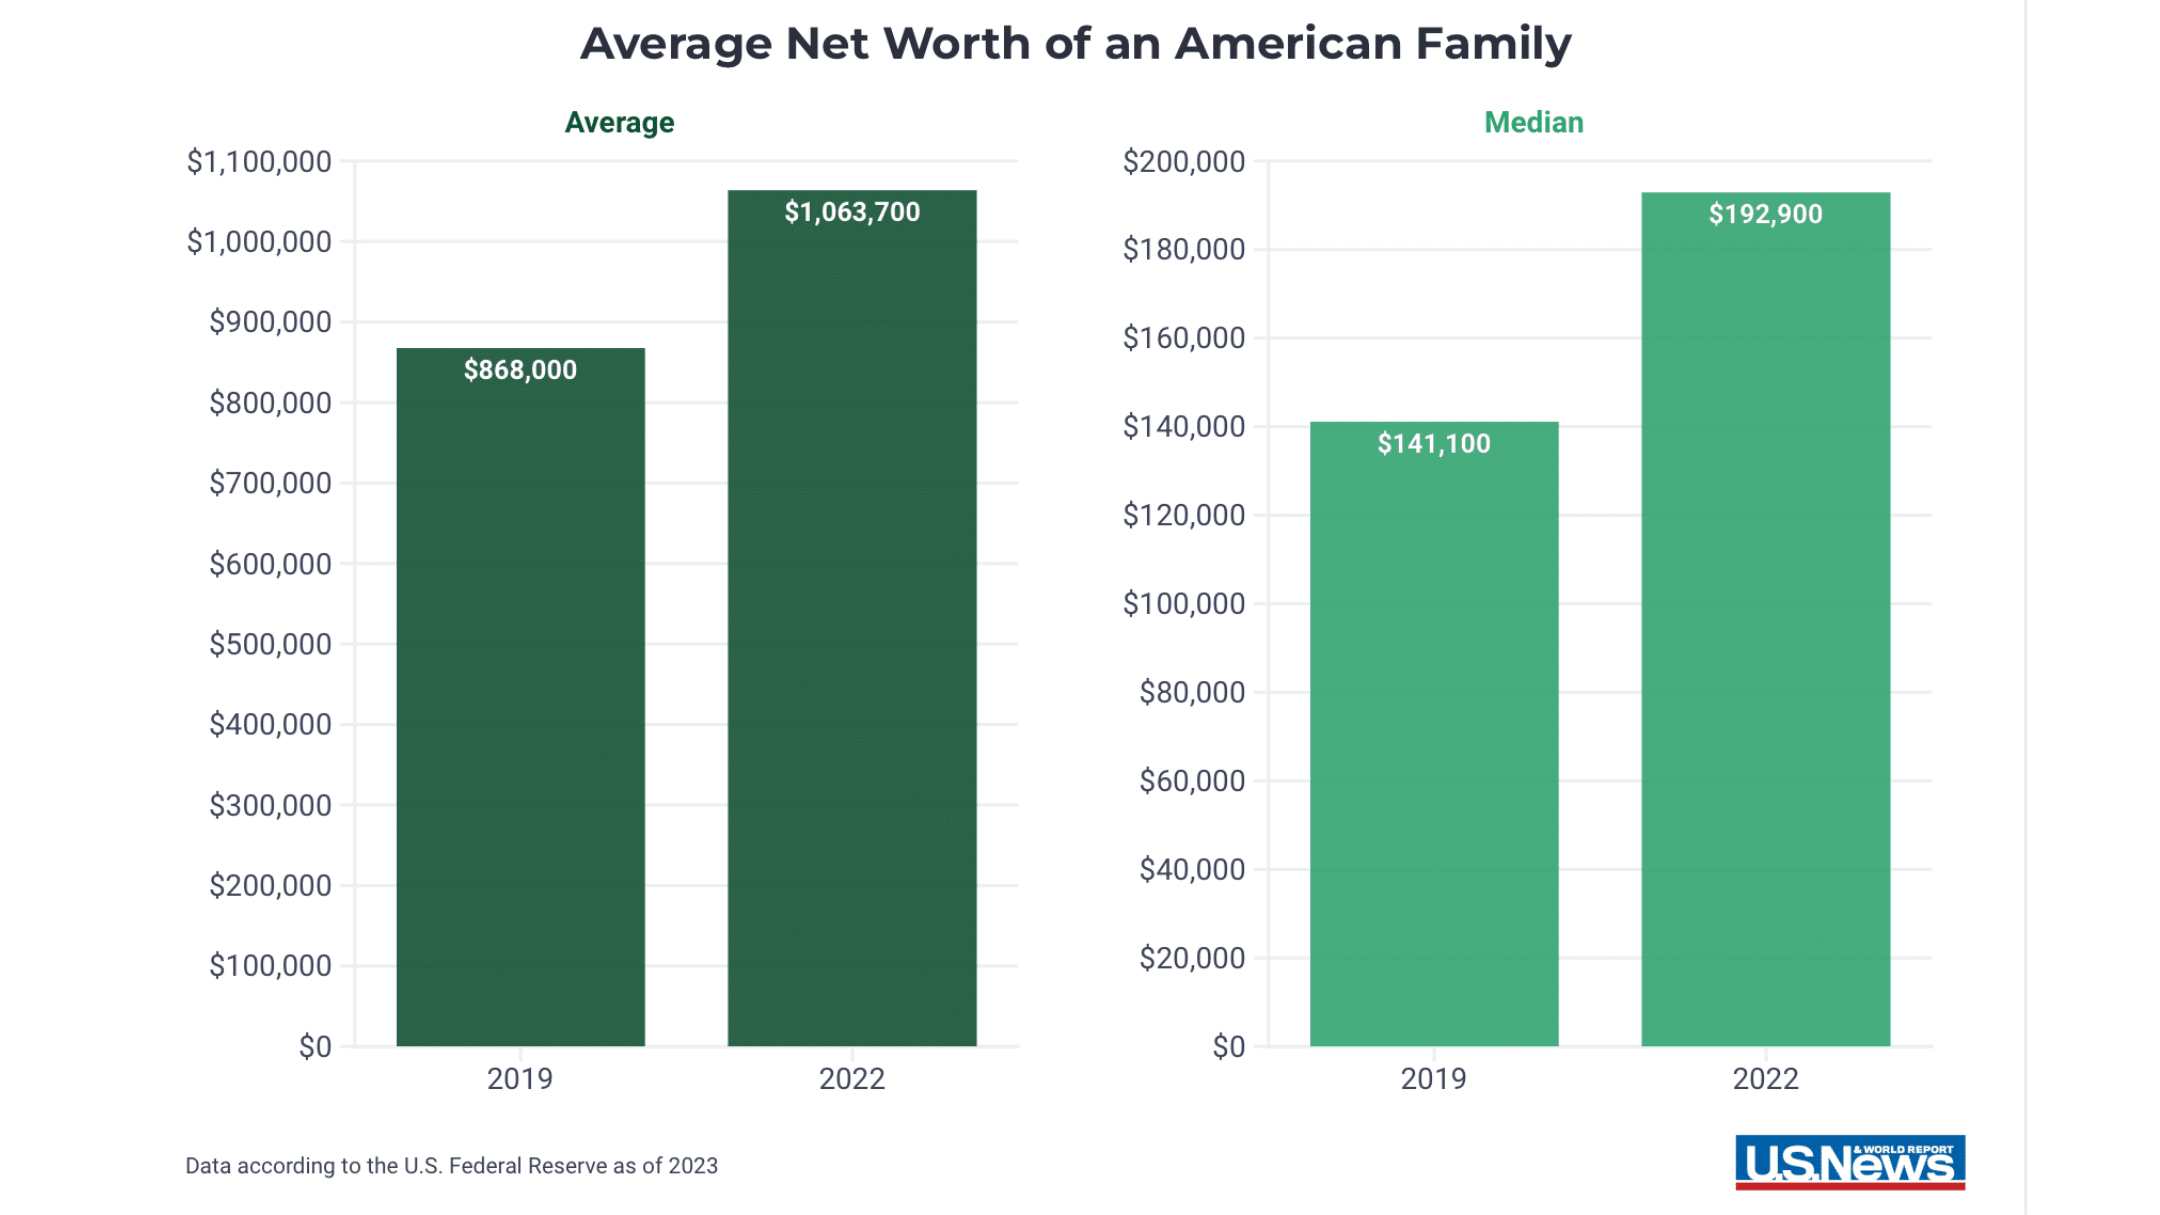
American household net worth measures the sum of all financial and physical assets owned by a household minus its total outstanding liabilities. In the United States, median household net worth stands at approximately $192,900, while entering the 90th percentile requires roughly $1.9 million. Net worth varies widely depending on age, education level, and homeownership status.
What Is Household Net Worth and How Is It Measured?
Household net worth is the ultimate scorecard of cumulative financial health. Unlike household income—which tracks the flow of money into a home over a specific period—net worth represents accumulated wealth over time.
To determine a household's net worth, financial institutions and economic researchers apply a straightforward accounting formula:
$$\text{Net Worth} = \text{Total Assets} - \text{Total Liabilities}$$
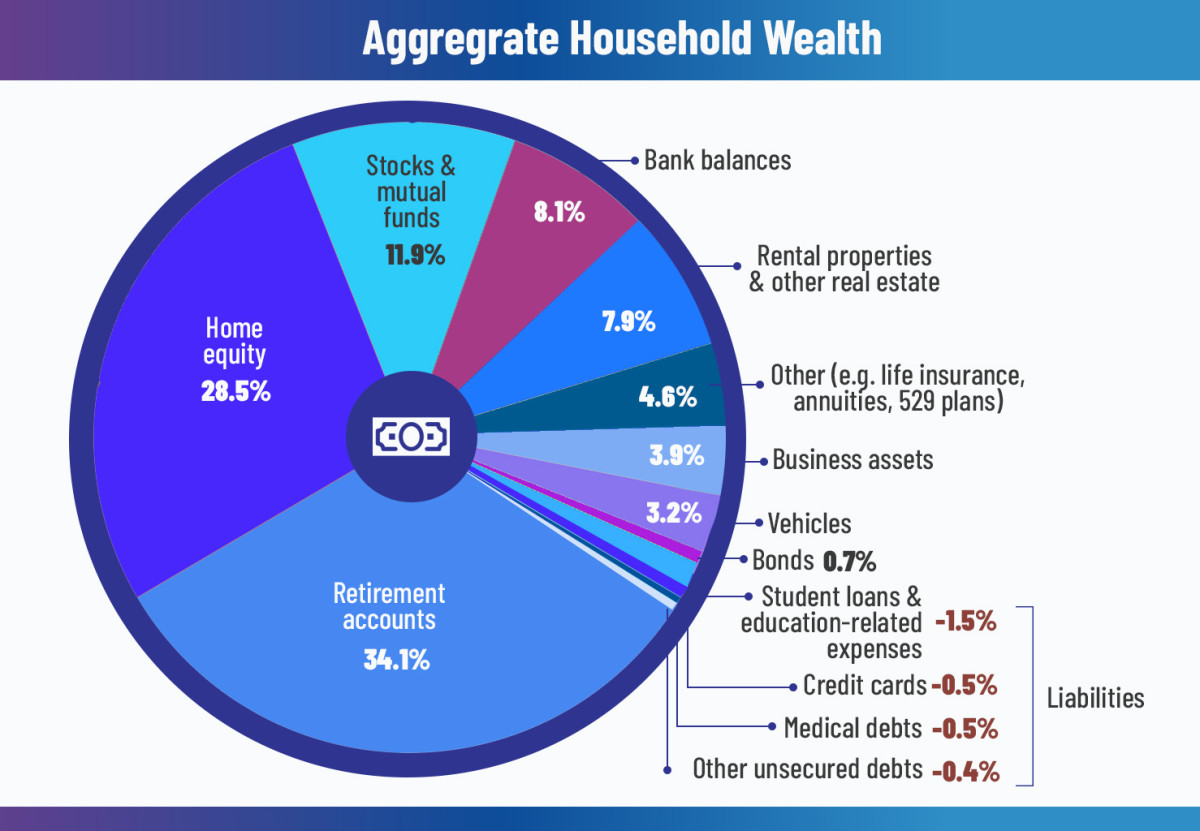
Asset Categories Included in Net Worth
- Primary Residence Equity: The estimated market value of a home minus any outstanding mortgage debt.
- Financial Accounts: Cash, checking accounts, high-yield savings accounts, certificates of deposit (CDs), and money market funds.
- Investment Holdings: Directly held stocks, bonds, mutual funds, exchange-traded funds (ETFs), and private equity.
- Retirement Accounts: Traditional and Roth 401(k)s, 403(b)s, Individual Retirement Accounts (IRAs), and simplified employee pension (SEP) plans.
- Business Equity: The net value of privately held businesses, partnerships, or professional practices.
- Vehicles and Personal Property: The current resale value of automobiles, boats, jewelry, and valuable collectibles (often estimated conservatively).
Liability Categories Subtracted from Assets
- Mortgages and Home Equity Lines of Credit (HELOCs): Primary and secondary residential debt.
- Consumer Debt: Credit card balances, personal lines of credit, and store financing.
- Student Debt: Federal and private educational loans owed by all household members.
- Auto Loans: Total remaining balances on vehicle financing agreements.
The gold standard for tracking net worth data in the United States is the Federal Reserve Survey of Consumer Finances (SCF). Conducted every three years by the Board of Governors of the Federal Reserve System, the SCF provides detailed microdata regarding balance sheets, pensions, income, and demographic characteristics of U.S. families.
Overall American Household Net Worth Percentiles
Wealth in the United States is distributed unevenly, creating a wide divergence between median (50th percentile) and mean (average) figures. The median net worth represents the exact midpoint: half of all American households have a higher net worth, and half have a lower net worth. The mean net worth, by contrast, takes the sum of all wealth and divides it by the total number of households, skewing the metric upward due to ultra-high-net-worth families.
The mean net worth for U.S. households exceeds $1,000,000, yet the median sits dramatically lower at roughly $192,900. Analyzing net worth by percentiles offers a far clearer picture of where a household stands relative to the rest of the country.
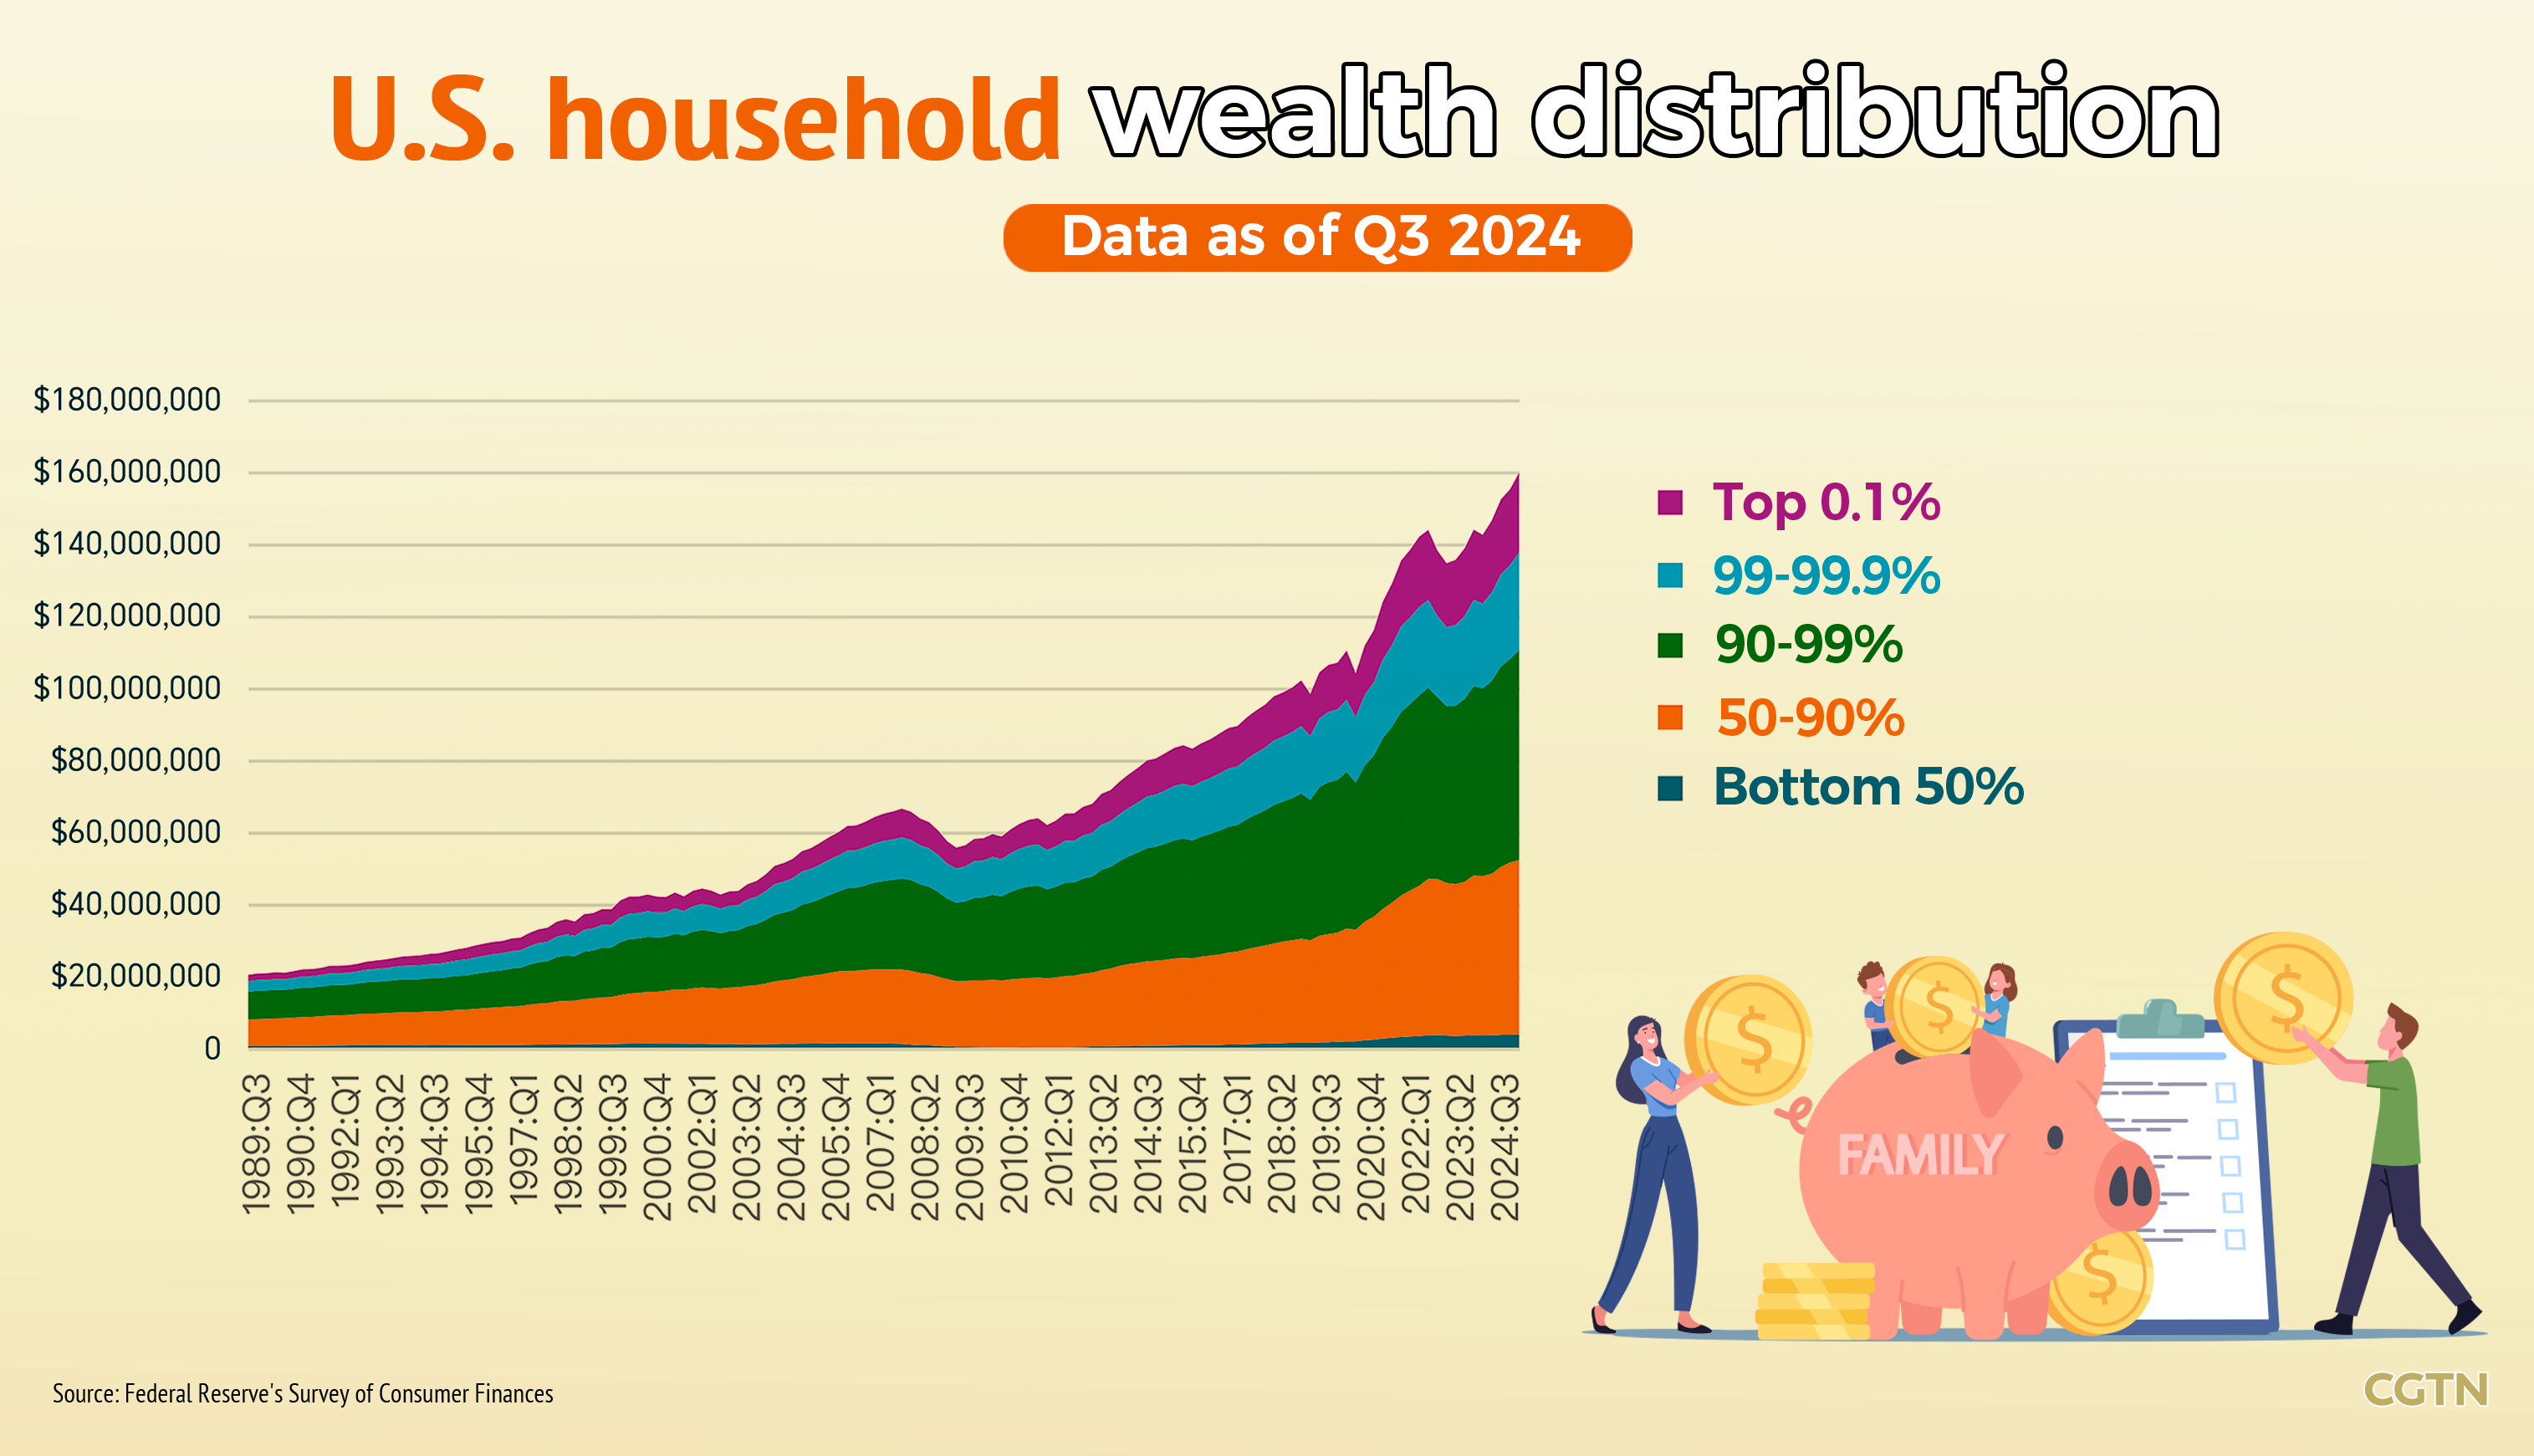
| Net Worth Percentile | Estimated Household Net Worth Threshold | Primary Composition & Asset Drivers |
|---|---|---|
| 10th Percentile | -$500 to $5,000 | High consumer/student debt relative to minimal cash reserves. |
| 25th Percentile | $35,000 | Used vehicles, small emergency savings, minimal retirement funds. |
| 50th Percentile (Median) | $192,900 | Home equity in primary residence, modest 401(k) balances. |
| 75th Percentile | $658,000 | Substantial home equity, mature 401(k)/IRA accounts, liquid stocks. |
| 90th Percentile | $1,920,000 | Multiple real estate properties, taxable brokerage accounts, high retirement balances. |
| 95th Percentile | $3,800,000 | Diversified stock portfolios, commercial real estate, corporate equity. |
| 99th Percentile (Top 1%) | $13,700,000+ | Private business ownership, extensive market holdings, real estate portfolios. |
Note: Percentile thresholds are derived from Federal Reserve SCF data baselines adjusted for inflation and national economic tracking models.
Net Worth Percentiles by Age Group
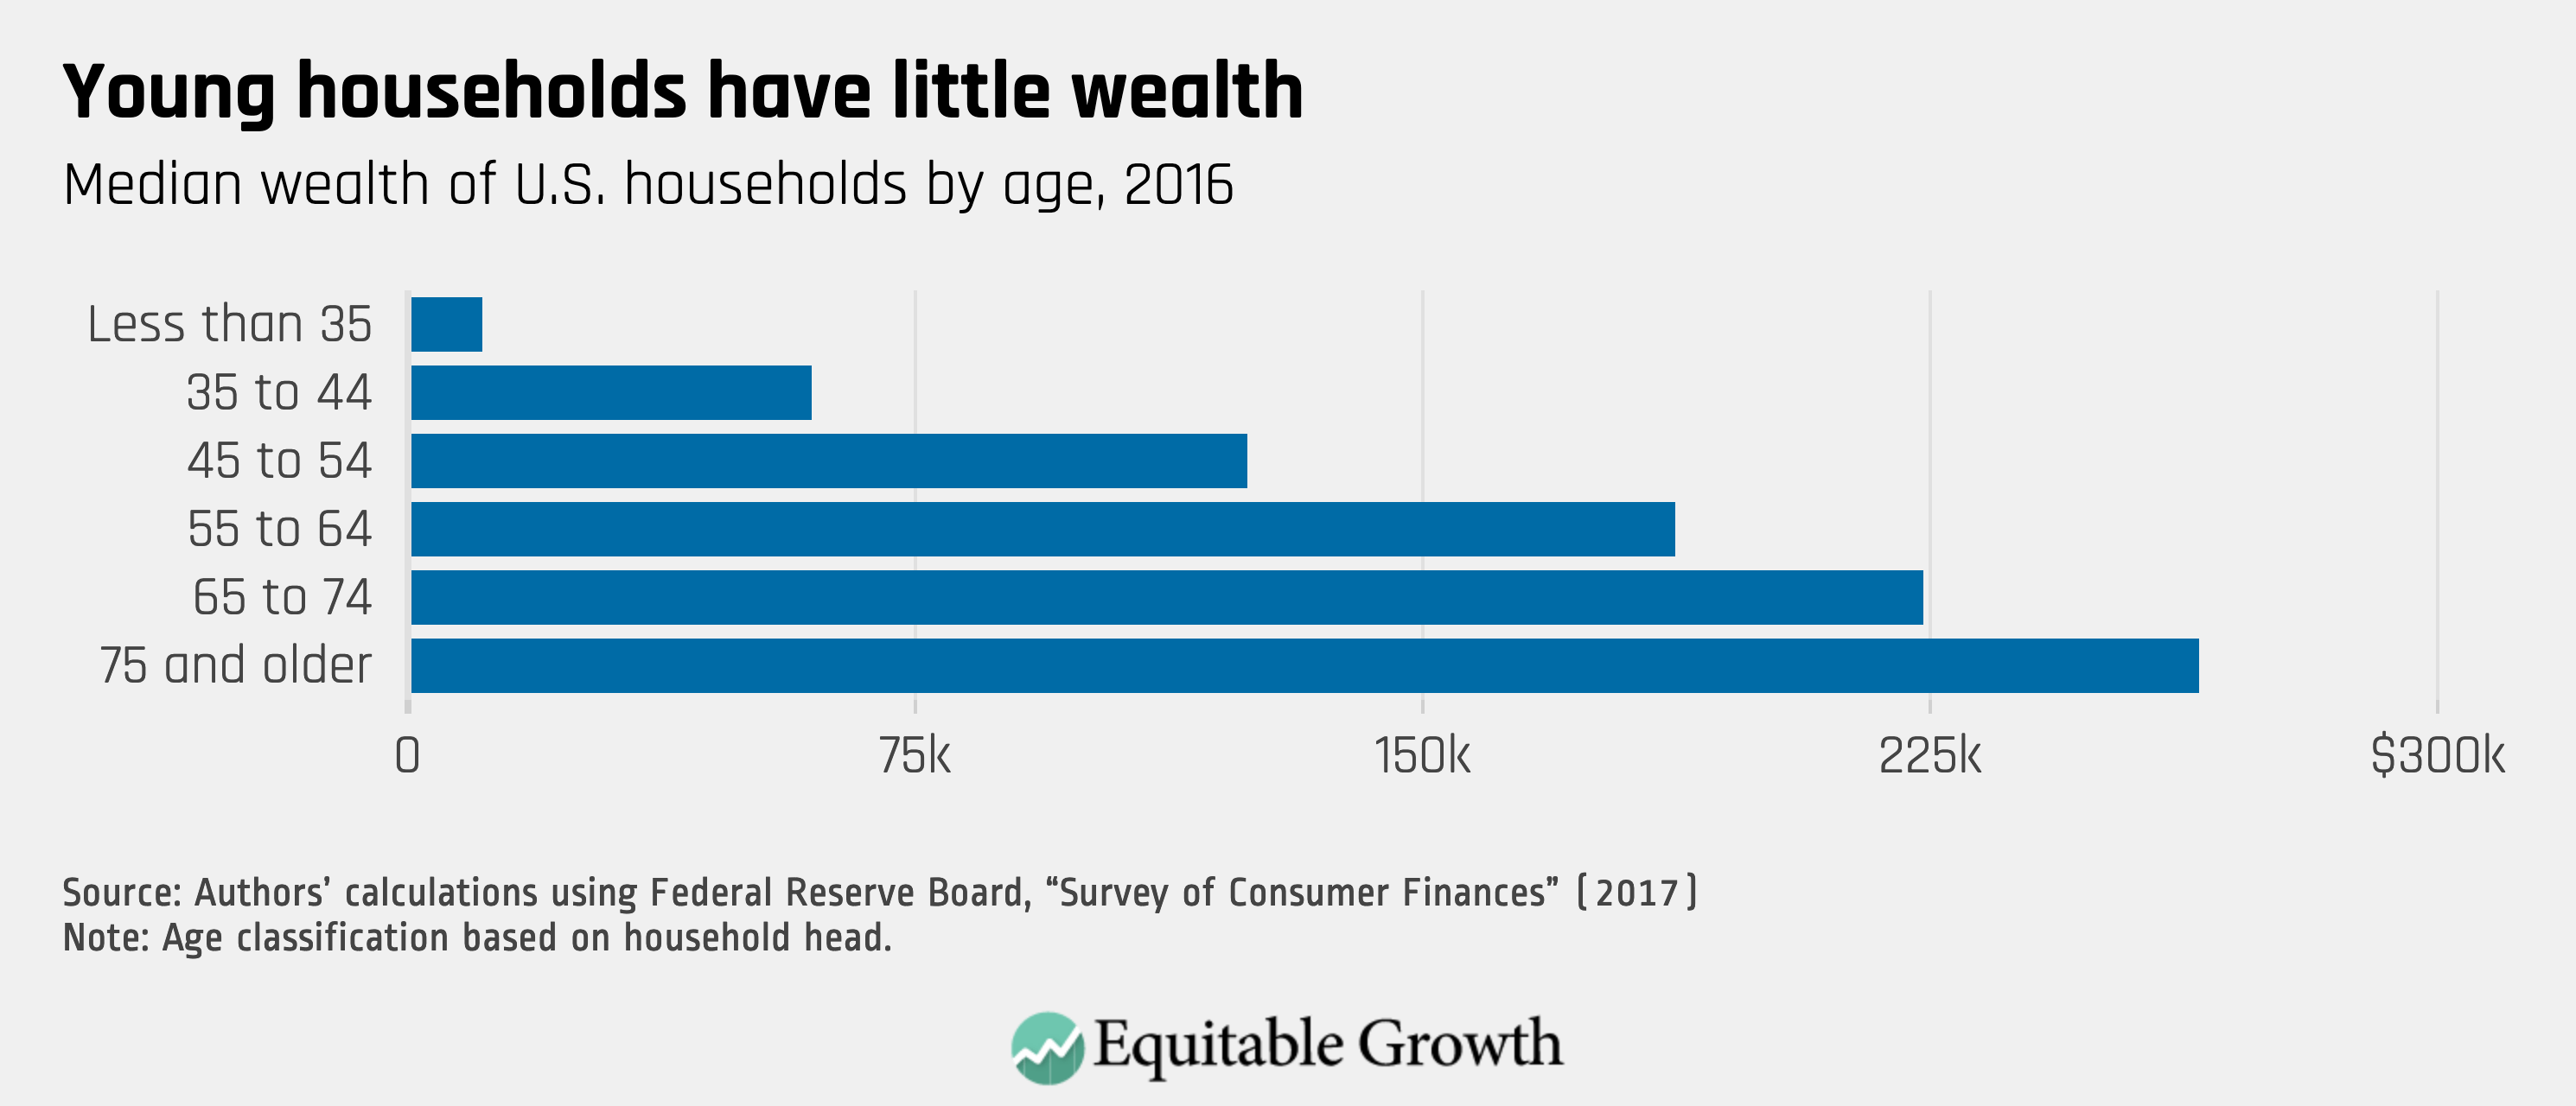
Because wealth accumulation is a life-cycle process, comparing a 28-year-old worker to a 67-year-old retiree distorts financial evaluations. Younger households typically carry student debt and entry-level salaries, while older households benefit from compounding investment returns, decades of principal payments on home mortgages, and peak earning years.
The Federal Reserve categorizes wealth distribution across major life stages, demonstrating how household net worth builds over time before stabilizing or gradually declining during retirement decumulation.
Life-Cycle Net Worth Trajectory (Median vs. 90th Percentile)
| Age Bracket | Median Net Worth | 90th Percentile Net Worth |
|---|---|---|
| Under 35 | ~$39,000 | ~$175,000 |
| 35 – 44 | ~$135,000 | ~$860,000 |
| 45 – 54 | ~$247,000 | ~$1,750,000 |
| 55 – 64 | ~$364,000 | ~$2,650,000 |
| 65 – 74 | ~$410,000 | ~$2,800,000 |
| 75+ | ~$335,000 | ~$2,400,000 |
Under 35 Years Old
Households led by individuals under age 35 are in the initial capital-building stage.
- Median Net Worth: ~$39,000
- 90th Percentile: ~$175,000
- Key Factors: For this demographic, net worth is often constrained by educational debt, vehicle financing, and lower initial earnings. High-earning young professionals or early homeowners occupy the top 10% of this age bracket.
Age 35 to 44
During this decade, career earnings accelerate, and families frequently purchase their first homes or begin investing meaningfully in tax-advantaged accounts.
- Median Net Worth: ~$135,000
- 90th Percentile: ~$860,000
- Key Factors: Home equity begins to play a central role as mortgage balances decrease and residential real estate values appreciate. Compound interest in 401(k) accounts begins to yield noticeable returns.
Age 45 to 54
Peak earning years typically fall within this age range. Families often reach peak salary levels and accelerate debt paydowns.
- Median Net Worth: ~$247,000
- 90th Percentile: ~$1,750,000
- Key Factors: Households in the upper percentiles often hold balanced equity portfolios and significant home equity. Debt-to-asset ratios drop markedly compared to younger brackets.
Age 55 to 64
This represents the final pre-retirement consolidation phase. Investment returns and systematic savings reach their maximum trajectory prior to drawing down accounts.
- Median Net Worth: ~$364,000
- 90th Percentile: ~$2,650,000
- Key Factors: High net worth households in this category have often paid off primary mortgages entirely, leaving investment portfolios as their largest single wealth asset.
Age 65 to 74
Statistically, households in the 65-to-74 age bracket exhibit the highest median net worth of any age cohort in the United States.
- Median Net Worth: ~$410,000
- 90th Percentile: ~$2,800,000
- Key Factors: Accumulation reaches its apex before required minimum distributions (RMDs) and medical expenses trigger systematic withdrawals.
Age 75 and Older
During late retirement, total net worth often compresses as healthcare costs rise and wealth transfers to heirs or charitable trusts occur.
- Median Net Worth: ~$335,000
- 90th Percentile: ~$2,400,000
- Key Factors: Asset drawdown, spending on assisted living or long-term care, and intergenerational wealth gifting reduce total balance sheet totals.
Primary Factors Driving American Wealth Distribution
Understanding how a household achieves a specific percentile requires analyzing the core mechanisms of wealth creation in the American economy. Historical data consistently highlights four distinct structural drivers:
CORE DRIVERS OF U.S. HOUSEHOLD WEALTH
- Residential Real Estate Equity (Primary Wealth Anchor)
- Compound Growth via Equity Markets & Tax-Advantaged Accounts
- Business Ownership & Private Equity Holdings
- Management of High-Interest Liabilities
1. Homeownership and Real Estate Appreciation
Residential real estate remains the primary wealth-building vehicle for middle-income American households. According to Federal Reserve data, homeowners possess a median net worth over 30 times higher than that of renters ($396,000 vs. $10,400).
A home mortgage acts as a forced savings mechanism: each monthly payment reduces principal debt while the underlying real estate historically appreciates over multi-decade periods. You can analyze national real estate data and monetary trends directly through the Federal Reserve Bank of St. Louis FRED Database.
2. Market Participation and Tax-Advantaged Growth
While real estate dominates the lower and middle percentiles, stock market investments drive the upper 25% of net worth distribution. Households that consistently contribute to tax-advantaged accounts—such as 401(k) plans, traditional IRAs, and Roth IRAs—benefit from compounding asset returns that outpace baseline inflation.
The Internal Revenue Service sets annual contribution limits and structural rules for these tax-favored vehicles. You can review official contribution limits and regulations at the Internal Revenue Service (IRS).
3. Business Ownership and Entrepreneurship
Reaching the 95th to 99th percentiles of American net worth frequently requires owning equity in private businesses. Business owners capture both operational cash flow and the capital appreciation of the enterprise. According to the Federal Reserve SCF, families owning private business assets display significantly higher median and mean wealth metrics than families relying exclusively on wage labor.
4. Educational Attainment and Debt Management
Educational attainment correlates strongly with lifetime earnings, but high student debt loads can create severe drag on early net worth accumulation. Managing high-interest liabilities—such as credit cards and uncollateralized personal loans—is critical. The Consumer Financial Protection Bureau (CFPB) offers tools and statutory guidance on managing consumer debt and understanding credit obligations.
Regional Disparities and Cost-of-Living Context
Comparing national net worth percentiles without adjusting for regional economic dynamics can yield misleading conclusions. A household with a net worth of $600,000 holds distinct purchasing power and relative financial standing depending on geographic location.
High-Cost vs. Low-Cost Jurisdictions
- Metropolitan Areas (e.g., San Francisco, New York, Seattle): High housing valuations inflate nominal net worth figures. However, elevated property taxes, high state income taxes, and elevated retail costs reduce real financial flexibility. A home valued at $1.2 million with a $600,000 mortgage yields $600,000 in equity, but daily living costs remain high.
- Low-to-Moderate-Cost Regions (e.g., Midwest, Rural South): Real estate valuations are lower, meaning median net worth figures may appear lower on absolute national charts. However, lower overhead requirements, cheaper services, and reduced tax liabilities can result in equivalent or superior financial independence.
Defined-Benefit Pensions vs. Defined-Contribution Accounts
Standard net worth calculations face another key limitation: the valuation of defined-benefit pensions. Public sector workers (such as teachers, firefighters, and federal civil service personnel) often hold valuable pension annuities that guarantee lifetime retirement income.
However, because these pensions cannot be liquidated on a balance sheet, standard SCF metrics frequently exclude their total capitalized present value. Consequently, a public-sector worker with a non-liquid pension may show a lower official net worth percentile than a private-sector worker with an equivalent 401(k) balance, despite enjoying comparable retirement cash flow security.
How to Calculate and Audit Your Household Net Worth
To determine your household's exact percentile, you must perform a comprehensive asset-and-liability audit using current market valuations.
HOUSEHOLD BALANCE SHEET AUDIT
- TOTAL ASSETS:
- Primary Real Estate Market Value
- Tax-Advantaged Retirement (401k/IRA)
- Taxable Investment Brokerage Accounts
- Liquid Cash & Savings (Checking, HYSA, CDs)
- Resale Value of Vehicles & Property
- = Gross Asset Value
- LESS TOTAL LIABILITIES:
- Mortgage Principal Balance
- Car Loans & Auto Financing
- Outstanding Student Debt
- Credit Card Balances & Consumer Debt
- = NET HOUSEHOLD WORTH
Steps for an Accurate Balance Sheet Audit
- Gather Statements: Collect current balances from bank accounts, retirement portals, brokerage firms, and loan servicing centers.
- Value Assets Conservatively: Price real estate based on realistic comparative market analyses (such as recent local sales), not optimistic listing prices. Value vehicles at current trade-in or wholesale value using established pricing guides, factoring in depreciation.
- Sum Total Debt: Add together every outstanding balance, including principal home mortgages, auto loans, educational loans, tax liabilities, and credit card balances.
- Subtract Liabilities from Assets: The resulting figure represents your baseline net worth.
- Benchmark Against Your Age Cohort: Compare your calculated balance sheet against the appropriate age-based percentile table rather than national general figures.
Frequently Asked Questions
What net worth puts a household in the top 10% in America?
To reach the 90th percentile (top 10%) of American household wealth, a household generally requires a net worth of approximately $1.92 million. This figure varies significantly by age; for households aged 55 to 64, entering the top 10% requires roughly $2.65 million.
What is the net worth threshold for the top 1% of U.S. households?
Entering the 99th percentile (top 1%) of net worth in the United States requires a minimum household net worth of approximately $13.7 million. The vast majority of top 1% wealth consists of business equity, private company shares, high-value real estate portfolios, and directly held financial assets.
Is primary residence home equity included in net worth?
Yes. Standard economic measurements, including the Federal Reserve's Survey of Consumer Finances, include primary residence home equity (market value minus outstanding mortgage balance) in household net worth calculations. Liquid net worth, by contrast, excludes real estate equity to measure funds immediately available for cash conversion.
Why is the average net worth so much higher than the median net worth?
The average (mean) net worth in the U.S. exceeds $1,000,000, whereas the median net worth is around $192,900. This disparity occurs because wealth distribution is skewed at the high end. Extreme wealth holdings concentrated among billionaire and multi-millionaire households pull the average upward, making the median a more representative metric for typical households.
Does student loan debt cause negative net worth among young adults?
Yes. Young adults who carry large balances of student loan debt without holding appreciable assets (such as real estate or substantial retirement accounts) often register a negative net worth. As career earnings materialize, debt is amortized, and retirement contributions compound, net worth typically shifts positive into their 30s.
Practical Action Steps for Wealth Accumulation
Improving your household net worth percentile requires structural financial planning:
- Systematize Investment Contributions: Maximize employer-matched contributions to tax-advantaged accounts like 401(k)s or 403(b)s before funding taxable accounts.
- Eliminate High-Interest Consumer Debt: Prioritize paying off high-interest liabilities, such as credit cards or personal loans, which carry interest rates that outpace historical stock market returns.
- Build Real Estate or Market Equity: Move from relying solely on wage income to holding appreciating assets. Real estate ownership and diversified low-cost index fund investments historically form the foundation of middle and upper-percentile net worth expansion.
- Review Balance Sheets Annually: Track your net worth progress once or twice per year to evaluate debt reduction, capital appreciation, and asset allocation strategies.
Disclaimer: This analysis is provided for educational and informational purposes only and does not constitute formal tax, legal, or financial advice. Individual financial situations vary widely; consult a licensed Certified Financial Planner (CFP) or CPA regarding your specific circumstances.
Image Gallery
Select an image to open it in a new tab.





Mateo Castillo
Decentralized Finance and E-Payments Strategist
