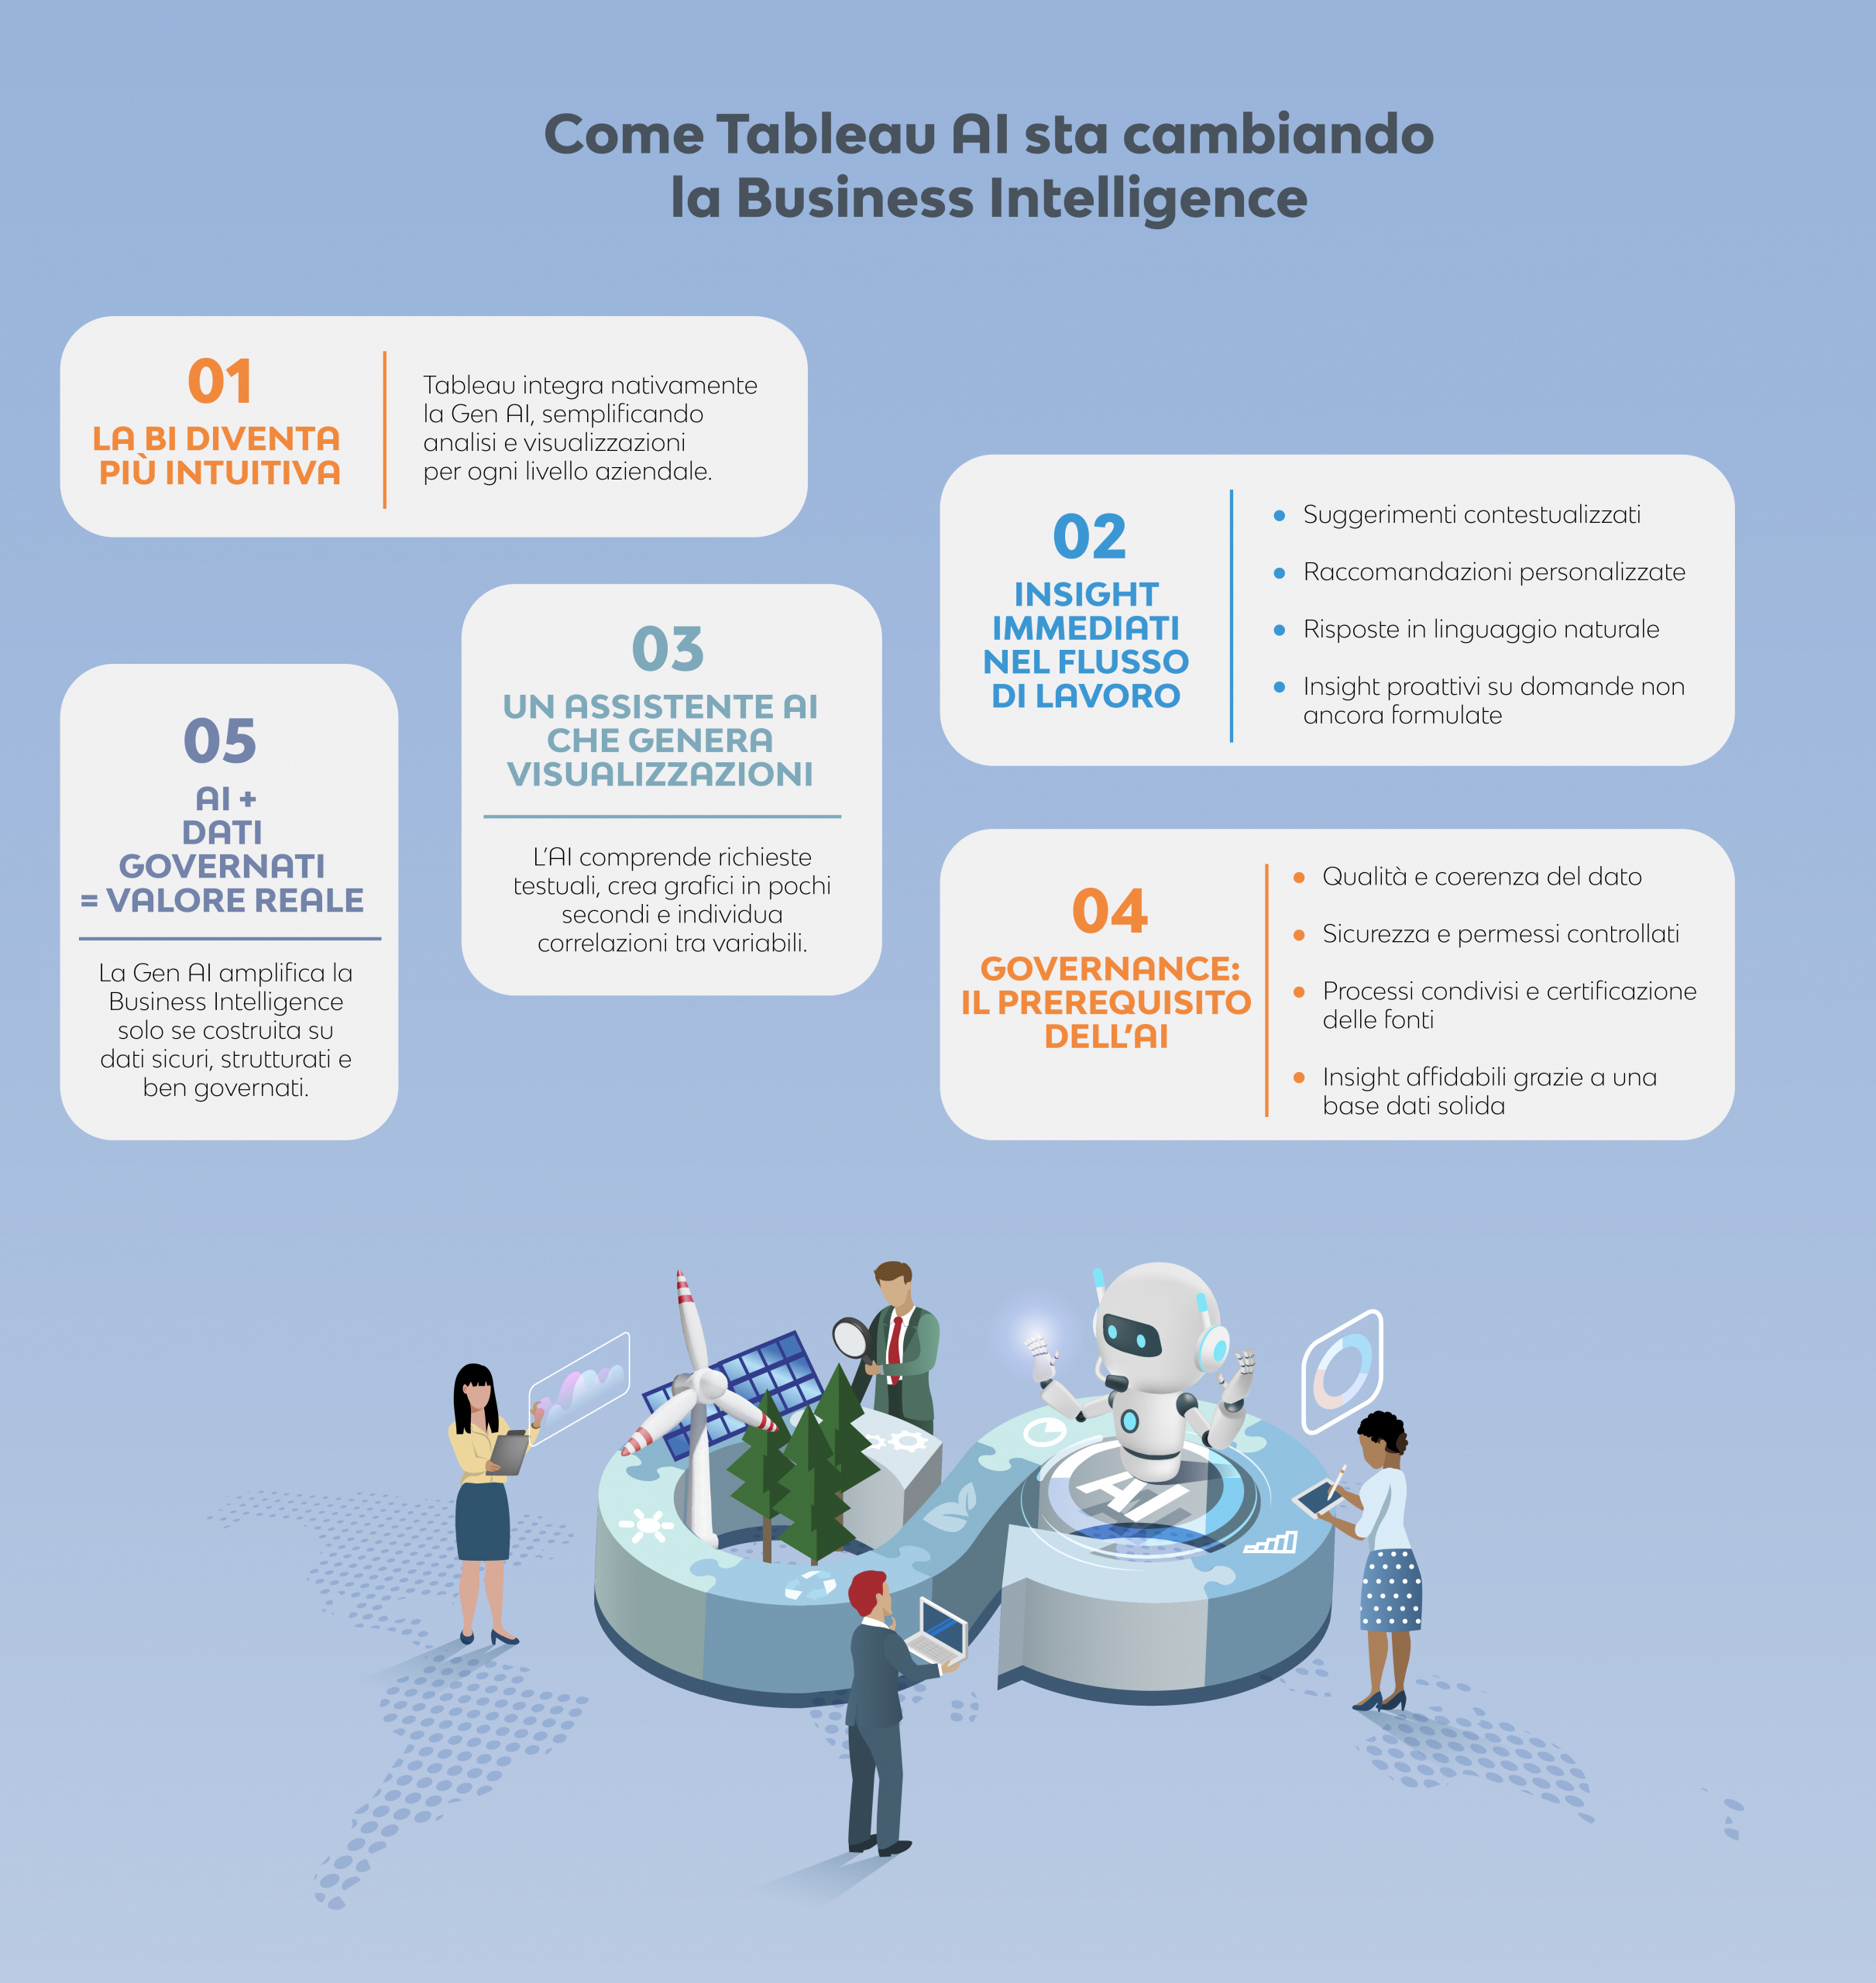
Organizations evaluating alternatives to Tableau often seek platforms that offer lower total cost of ownership, tighter cloud ecosystem integration, or more intuitive self-service reporting. Leading Tableau competitors include Microsoft Power BI, Looker, Qlik Sense, ThoughtSpot, Domo, and open-source platforms like Metabase and Apache Superset, each serving distinct technical architectures and business analytical needs.
Understanding Tableau's Market Position and Core Capabilities
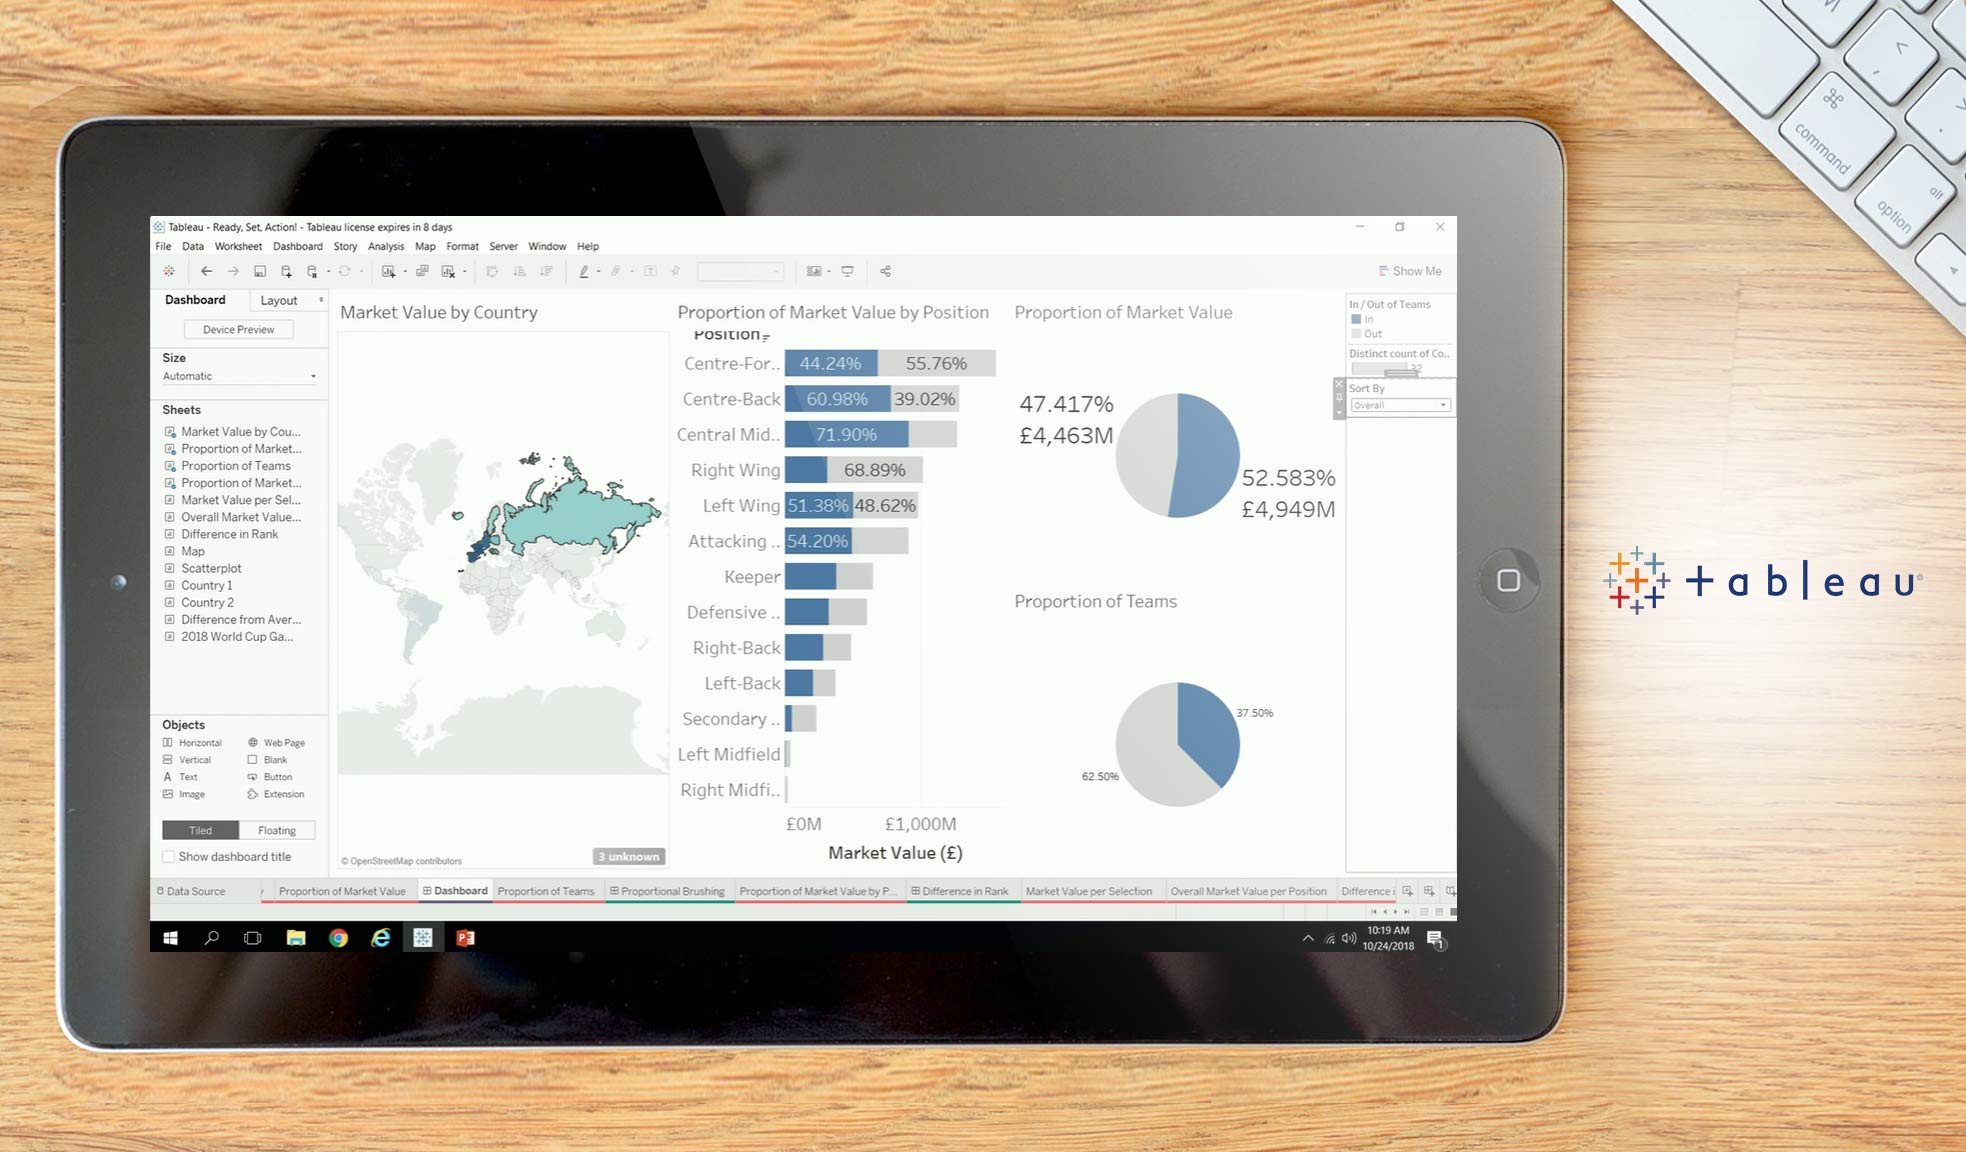
Tableau has long maintained a strong position in the business intelligence (BI) and data visualization software market. Built around its proprietary VizQL engine, Tableau translates drag-and-drop user actions into visual database queries, allowing data analysts to build sophisticated, interactive dashboards without writing code. Its ability to handle complex calculations, blend disparate data sources, and render customized visualizations made it the standard for data-driven enterprises.
However, shifts in enterprise data stacks and organizational priorities have led many IT leaders and analytical teams to explore alternative software platforms. Several recurring factors drive organizations to evaluate options outside the Tableau ecosystem:
- Total Cost of Ownership: Following Salesforce's acquisition of Tableau, enterprise licensing models—divided into Creator, Explorer, and Viewer tiers—can become costly when scaling across thousands of corporate users.
- Data Modeling and Governance: Tableau emphasizes visual analytics rather than a centralized, enterprise-wide semantic layer. Organizations seeking unified metric definitions across multiple departments often find Tableau's data source management difficult to govern at scale.
- Steep Learning Curve for Non-Technical Users: While Tableau is highly capable in the hands of experienced data analysts, casual business users often face a steep learning curve when attempting to perform custom ad-hoc analyses or construct new reports from scratch.
- Cloud Ecosystem Alignment: As organizations standardize on cloud data warehouses such as Snowflake, Google BigQuery, Databricks, or Amazon Redshift, they often prefer BI tools natively built for those specific cloud ecosystems or bundled with existing software agreements.
Enterprise-Grade Alternatives to Tableau
Enterprise BI solutions focus on high scalability, centralized governance, granular row-level security, and deep integration with enterprise application suites.
Microsoft Power BI: Best for Microsoft Ecosystems and Cost-Efficiency
Microsoft Power BI is Tableau's most direct market competitor. Built around the Analysis Services engine, Power BI offers robust analytical power, deep integration with Microsoft 365, enterprise data modeling via DAX (Data Analysis Expressions), and competitive per-user or capacity-based pricing.
| Core Strengths | Key Limitations |
|---|---|
| • Seamless Microsoft 365/Fabric | • Mac OS desktop app unavailable |
| • Cost-effective per-user pricing | • Dax formulas can be complex |
| • Strong tabular data handling | • Visual formatting limits |
Architecture and Data Modeling
Power BI uses Power Query (M language) for data transformation and DAX for analytical calculations. Data models in Power BI are typically structured as star schemas. The platform integrates directly into Microsoft Fabric, allowing organizations to connect Power BI reports to a unified data lakehouse (OneLake) without extracting data across physical boundary layers.
Pricing and Licensing
Power BI's licensing model is a major factor driving migrations from Tableau. Included in many Microsoft 365 E5 enterprise agreements or available as inexpensive standalone Pro and Premium Per User (PPU) licenses, Power BI offers a lower entry barrier for large enterprise seat counts. For massive deployments, organizations can license capacity-based nodes through Microsoft Fabric, decoupling per-user licensing for report consumers.
Ideal Use Case
Power BI is best suited for organizations heavily invested in the Microsoft stack (Azure, Teams, SharePoint, Office 365) that require enterprise data modeling alongside cost-effective deployment across broad business units.
Google Cloud Looker: Best for Data Governance and Cloud-Native Modeling
Looker, acquired by Google Cloud, takes a fundamentally different architectural approach than Tableau. Rather than extracting data into an in-memory visualization engine, Looker operates directly inside cloud data warehouses using SQL translation.
The LookML Semantic Layer
Looker's core technology is LookML (Looker Modeling Language), a code-based modeling layer where data engineers define relationships, dimensions, aggregates, and business logic in a centralized Git-versioned repository.
- Version Control: Changes to business metrics are managed through pull requests, avoiding metric duplication or conflicting calculations across departments.
- In-Database Execution: Looker converts visual user requests directly into optimized SQL queries executed within BigQuery, Snowflake, Redshift, or Databricks, keeping processing workloads inside the cloud warehouse.
Strengths and Trade-offs
Looker excels at governance, metrics consistency, and embedded analytics via modern web APIs. However, because Looker requires developer resources to build and maintain LookML models before business users can explore data freely, deployment timelines can be longer than Tableau's desktop drag-and-drop workflow. Additionally, Looker's visual customization options are less flexible than Tableau's formatting canvas.
Qlik Sense: Best for Associative Data Exploration and Hybrid Deployments
Qlik Sense is powered by the Qlik Associative Engine, which differs from traditional SQL-based relational querying engines used by most BI tools.
The Associative Engine Concept
Standard SQL tools evaluate data through pre-defined relational joins and dynamic WHERE clauses. Qlik indexes every data point and relationship in memory. When a user selects a filter in a Qlik dashboard, the system highlights related data points in white and unrelated data points in grey across all connected tables simultaneously. This allows analysts to uncover indirect patterns and data outliers that structured SQL queries might obscure.
Deployment Flexibility
Qlik Sense offers multi-cloud deployment options, including on-premises, private cloud, and Qlik-managed SaaS. It also provides built-in data integration features (formerly Qlik Replicate), making it a viable end-to-end platform for data pipeline management, data preparation, and visual analytics.
Modern AI-Driven and Self-Service Analytics Alternatives
As analytical demands move toward natural language querying and automated data preparation, specialized tools have emerged to address limitations in traditional dashboard-centric platforms.
ThoughtSpot: Best for Search-Driven and NLP Analytics
ThoughtSpot prioritizes a search-first analytical experience, replacing structured visual menus with a search bar powered by Natural Language Processing (NLP) and Large Language Model (LLM) integrations (ThoughtSpot Sage).
- User Search Input
- ThoughtSpot NLP / Sage
- Live Data Warehouse Query
- Dynamic Visualization
Operational Workflow
Users enter plain-language queries (e.g., "What were total sales by region in Q3 compared to target?"), and ThoughtSpot generates live SQL queries against connected cloud data warehouses like Snowflake or BigQuery. The engine dynamically chooses the optimal visualization format (bar chart, line graph, scatter plot) based on the structural attributes of the queried attributes.
Value Proposition
ThoughtSpot lowers the technical barrier for business stakeholders who lack SQL or BI tool training, reducing ad-hoc report requests sent to central data teams. However, success depends heavily on data engineers maintaining clean, well-indexed data models with accurate column naming conventions.
Domo: Best for All-in-One Cloud BI and Rapid Deployment
Domo is a cloud-native platform designed to unify data ingestion, ETL (Extract, Transform, Load), data storage, visualization, and workflow automation within a single managed SaaS application.
Key Features
- Pre-built Data Connectors: Domo provides over 1,000 pre-configured connectors to cloud applications (Salesforce, Google Ads, SAP, Workday), allowing non-engineering teams to aggregate operational data quickly.
- Magic ETL: A drag-and-drop graphical interface that lets non-technical users build data transformation pipelines without writing SQL or Python scripts.
- Mobile-First Design: Executive interfaces are optimized out-of-the-box for mobile device rendering and real-time push notifications.
Considerations
While Domo offers fast initial setup, its proprietary cloud architecture can lead to higher long-term storage and compute costs if used as a primary data warehouse, rather than linking directly to existing cloud data infrastructure.
Open-Source and Lightweight BI Alternatives
For organizations prioritizing data privacy, custom software integration, or zero licensing costs, open-source BI platforms offer modular alternatives to Tableau.
Metabase: Best for Small-to-Medium Businesses and Simple Self-Service
Metabase is an open-source analytics platform designed for rapid setup and user-friendly exploration.
| Strengths | Limitations |
|---|---|
| • Open-source & lightweight deployment | • Basic visualization customization |
| • Intuitive no-code query builder | • Limited advanced statistical modeling |
| • Native SQL editor for advanced users | • Enterprise governance requires paid commercial editions |
| • Quick setup via Docker container |
Core Capabilities
Metabase offers a non-technical "Question Builder" interface alongside a SQL editor. Users construct dashboards using standard visual interfaces, while developers can deploy the entire stack as a lightweight Docker container connected directly to production databases.
Ideal Fit
Metabase is effective for startups, engineering-led companies, and SMBs seeking simple operational dashboards without enterprise software costs or lengthy implementation schedules.
Apache Superset: Best for High-Scale Enterprise Engineering Teams
Apache Superset is a cloud-native, open-source data exploration platform capable of handling large-scale corporate data workloads. Originally developed at Airbnb, Superset is designed to integrate into modern infrastructure environments.
Technical Architecture
- Database Compatibility: Connects to any SQL-based data source via Python SQLAlchemy, including Trino, Druid, Pinot, Postgres, and ClickHouse.
- Granular Security: Provides fine-grained user permissions and Row-Level Security (RLS) integration tied to enterprise identity providers (OAuth, OpenID, LDAP).
- Customization: Offers an extensible visualization plugin architecture that allows web developers to build bespoke D3.js visual components directly into the platform.
Operational Considerations
Superset requires dedicated DevOps and software engineering resources to install, configure, scale, and maintain in production, making it better suited for technical engineering organizations than non-technical business departments.
Detailed Comparison Matrix: Tableau vs. Key Competitors
The following matrix compares Tableau against its major commercial and open-source alternatives across data architecture, target user profiles, and operational characteristics:
| BI Platform | Primary Target Audience | Data Architecture Approach | Data Modeling Method | Governance Model | Best Fit Enterprise Scenario |
|---|---|---|---|---|---|
| Tableau | Data Analysts & Business Intelligence Pros | In-Memory Extracts (Hyper) & Live Queries | VizQL / Workbook Data Sources | Decentralized / Workbook-Level | Complex visual data analytics and custom graphical reporting |
| Microsoft Power BI | Enterprise Business Analysts & IT Teams | In-Memory (VertiPaq) & DirectQuery | DAX & Power Query (Star Schema) | Centralized Workspace Governance | Microsoft 365 / Azure ecosystem users seeking cost efficiency |
| Google Cloud Looker | Data Engineers & Data-Savvy Analysts | 100% In-Database Execution | LookML (Code-based Semantic Layer) | Centralized Version-Controlled Metric Store | Enterprises standardizing on cloud data warehouses (BigQuery/Snowflake) |
| Qlik Sense | BI Analysts & Operational Teams | In-Memory Associative Engine | Qlik Scripting & Associative Indexing | Enterprise-Managed App Model | Complex data discovery uncovering non-obvious data relationships |
| ThoughtSpot | Non-Technical Business Executives & Managers | Live Cloud Data Warehouse Querying | ThoughtSpot Worksheet / Search Index | Centralized Worksheet Governance | Search-driven analytics and ad-hoc natural language querying |
| Domo | Executives & Operational Managers | Hybrid Cloud Storage & Live Federation | Magic ETL & Cloud Data Fusion | App-Level Managed Governance | Organizations needing rapid deployment across disparate SaaS APIs |
| Metabase | Startups, Product Managers & SMBs | Direct Database Querying | No-Code Question Builder & SQL | Basic Role-Based Access Control | Lightweight self-hosted BI with minimal administrative overhead |
| Apache Superset | Software Engineers & Data Engineers | Direct SQL Lakehouse Connectivity | SQL Lab & Semantic Datasets | Granular Row-Level & Feature-Based Access | Highly scalable open-source deployments managed by engineering |
Key Factors to Consider When Replacing or Evaluating Tableau
Migrating away from Tableau or selecting an alternative platform requires evaluating business requirements against platform capabilities across several technical dimensions.
- Architectural Evaluation Matrix
- Compute & Data Stack
- Governance & Modeling
- Licensing & User Skills
1. Compute and Storage Strategy: In-Memory vs. In-Database
Tableau relies heavily on its proprietary Hyper in-memory engine to achieve fast interactive filtering. When evaluating alternatives, determine whether your organization prefers in-memory data extracts or direct in-database processing:
- In-Memory Platforms (Power BI, Qlik, Tableau): Fast visual rendering performance, but requires routine data ingestion pipelines (extract refreshes) that duplicate data storage and create data latency.
- In-Database / Cloud-Native Platforms (Looker, Superset, ThoughtSpot): Queries run directly inside data warehouses like Snowflake, BigQuery, or Databricks. This guarantees real-time access to underlying tables and avoids extra data duplication, but query performance relies on the warehouse's indexing and execution capacity.
2. Semantic Layer and Metric Governance
Decentralized visual tools can create metric discrepancies across business units (e.g., Marketing and Finance calculating "Customer Lifetime Value" differently).
If unified business metrics are a primary goal, platforms featuring code-governed, centralized semantic layers—such as Looker (LookML) or Power BI (Semantic Models via Fabric)—provide better structural controls than Tableau's desktop workbook environment.
3. Total Cost of Ownership (TCO) and Scaling Dynamics
Licensing costs extend beyond base subscription fees. A thorough TCO calculation must account for:
- User Tier Costs: Per-user creator/developer seats versus read-only viewer seats.
- Infrastructure Costs: On-premises server hardware, cloud hosting nodes, or cloud data warehouse compute units used when processing live dashboard queries.
- Administrative Overhead: Dedicated administrative personnel needed to manage permissions, performance tuning, data modeling, and server upkeep.
4. Technical Skill Sets Across the User Base
The technical capabilities of your target audience determine platform viability.
- Data Engineers & SQL Analysts: Thriving in platforms like Looker, Apache Superset, or Metabase SQL Lab.
- Traditional BI Analysts & Excel Power Users: Transitioning easily into Microsoft Power BI or Tableau.
- Non-Technical Business Stakeholders: Benefiting from search-based or natural-language platforms like ThoughtSpot.
Step-by-Step Framework for Migrating from Tableau
Switching enterprise BI platforms requires a phased migration plan to avoid operational disruption, report downtime, or data discrepancies.
- Step 1: Audit
- Step 2: Layer Standards
- Step 3: Target PoC
- Step 4: Governance & Rollout
Step 1: Audit Existing Dashboards and Data Sources
Catalog all active Tableau workbooks across Tableau Server or Tableau Cloud. Categorize reports by:
- Usage metrics (views per month, active users).
- Underlying data sources (SQL databases, cloud warehouses, manual Excel uploads).
- Calculated fields, custom VizQL parameters, and embedded data blends.
Action: Decommission unused or redundant dashboards before starting migration development.
Step 2: Establish the Semantic Layer and Metric Definitions
Before building dashboards in the new target BI tool, standardize underlying metric logic in your data warehouse or centralized semantic layer. Define shared measures, dimension hierarchies, and row-level security parameters in SQL views, dbt models, or semantic frameworks to ensure analytical consistency across applications.
Step 3: Conduct a Controlled Proof-of-Concept (PoC)
Select 3–5 representative Tableau dashboards ranging from simple operational reports to complex analytical visualizations. Rebuild these dashboards in the targeted candidate platform (e.g., Power BI or Looker) to evaluate:
- Visual fidelity and formatting parity.
- Query execution performance and refresh latency.
- Ease of user security configuration.
- Total build time required per report.
Step 4: User Enablement and Phased Cutover
Roll out the new BI platform in phases by business department. Run legacy Tableau dashboards and the new software platform in parallel during a dual-validation period to verify data accuracy across systems. Provide role-based user training tailored separately to business consumers, self-service report builders, and platform administrators.
Frequently Asked Questions
What is the most cost-effective direct alternative to Tableau?
Microsoft Power BI is widely considered the most cost-effective commercial enterprise alternative to Tableau. Its integration into existing Microsoft 365 licensing agreements and lower standalone per-user pricing significantly reduce licensing expenditures for large enterprise seat deployments. For organizations seeking zero software licensing costs, open-source options like Metabase or Apache Superset provide free self-hosted solutions.
Is Microsoft Power BI better than Tableau for enterprise reporting?
Power BI often fits enterprise reporting environments better due to its centralized data modeling capabilities, direct integration with Microsoft Fabric and Azure, and cost-effective licensing models. However, Tableau maintains an advantage in highly complex data visualization, advanced spatial/geographic mapping, and granular control over visual layout formatting.
Can Google Cloud Looker completely replace Tableau?
Looker can replace Tableau for metric modeling, enterprise governance, direct data warehouse querying, and embedded reporting APIs. However, Looker takes a code-first modeling approach (LookML) rather than Tableau's visual drag-and-drop workflow. Organizations switching from Tableau to Looker must re-architect their analytics strategy around centralized semantic modeling and SQL execution.
How do open-source BI tools like Metabase compare to Tableau in security?
Open-source platforms like Metabase and Apache Superset offer enterprise-grade security features, including Role-Based Access Control (RBAC), Row-Level Security (RLS), and single sign-on (SSO) via SAML, OAuth, or LDAP. By hosting open-source platforms on self-managed cloud infrastructure, organizations maintain complete control over data privacy without routing analytical queries through third-party vendor clouds.
Which BI platform is best for search and natural language querying?
ThoughtSpot is designed specifically for search-driven and natural language analytics. Its search engine and AI integration (ThoughtSpot Sage) allow non-technical business users to query data warehouses directly using plain English, bypassing traditional static dashboard building workflows.
Final Verdict and Strategic Recommendation
Selecting a Tableau alternative depends on your organization's infrastructure maturity, data engineering capabilities, and financial constraints:
- Choose Microsoft Power BI if your organization operates primarily within the Microsoft ecosystem, uses Azure or Microsoft Fabric, and wants to lower per-user licensing costs across large deployments.
- Choose Google Cloud Looker if you maintain a modern cloud data warehouse (BigQuery, Snowflake, Databricks) and prioritize centralized metric governance, version-controlled business logic, and API-driven embedded analytics.
- Choose ThoughtSpot if your primary bottleneck is resolving custom ad-hoc report requests for non-technical executives who prefer search-driven interfaces over structured visual dashboards.
- Choose Metabase or Apache Superset if your team prioritizes self-hosted deployment, code-level platform customization, open-source compliance, or zero recurring software license fees.
Before executing a full migration, conduct a structured Proof-of-Concept using your organization's actual production data to confirm query performance, security compliance, and user adoption feasibility.
Image Gallery
Select an image to open it in a new tab.




Omar Farooq
EdTech Innovation and Virtual Pedagogy Journalist
