How to Design a Biography Infographic: A Comprehensive Guide to Visual Storytelling
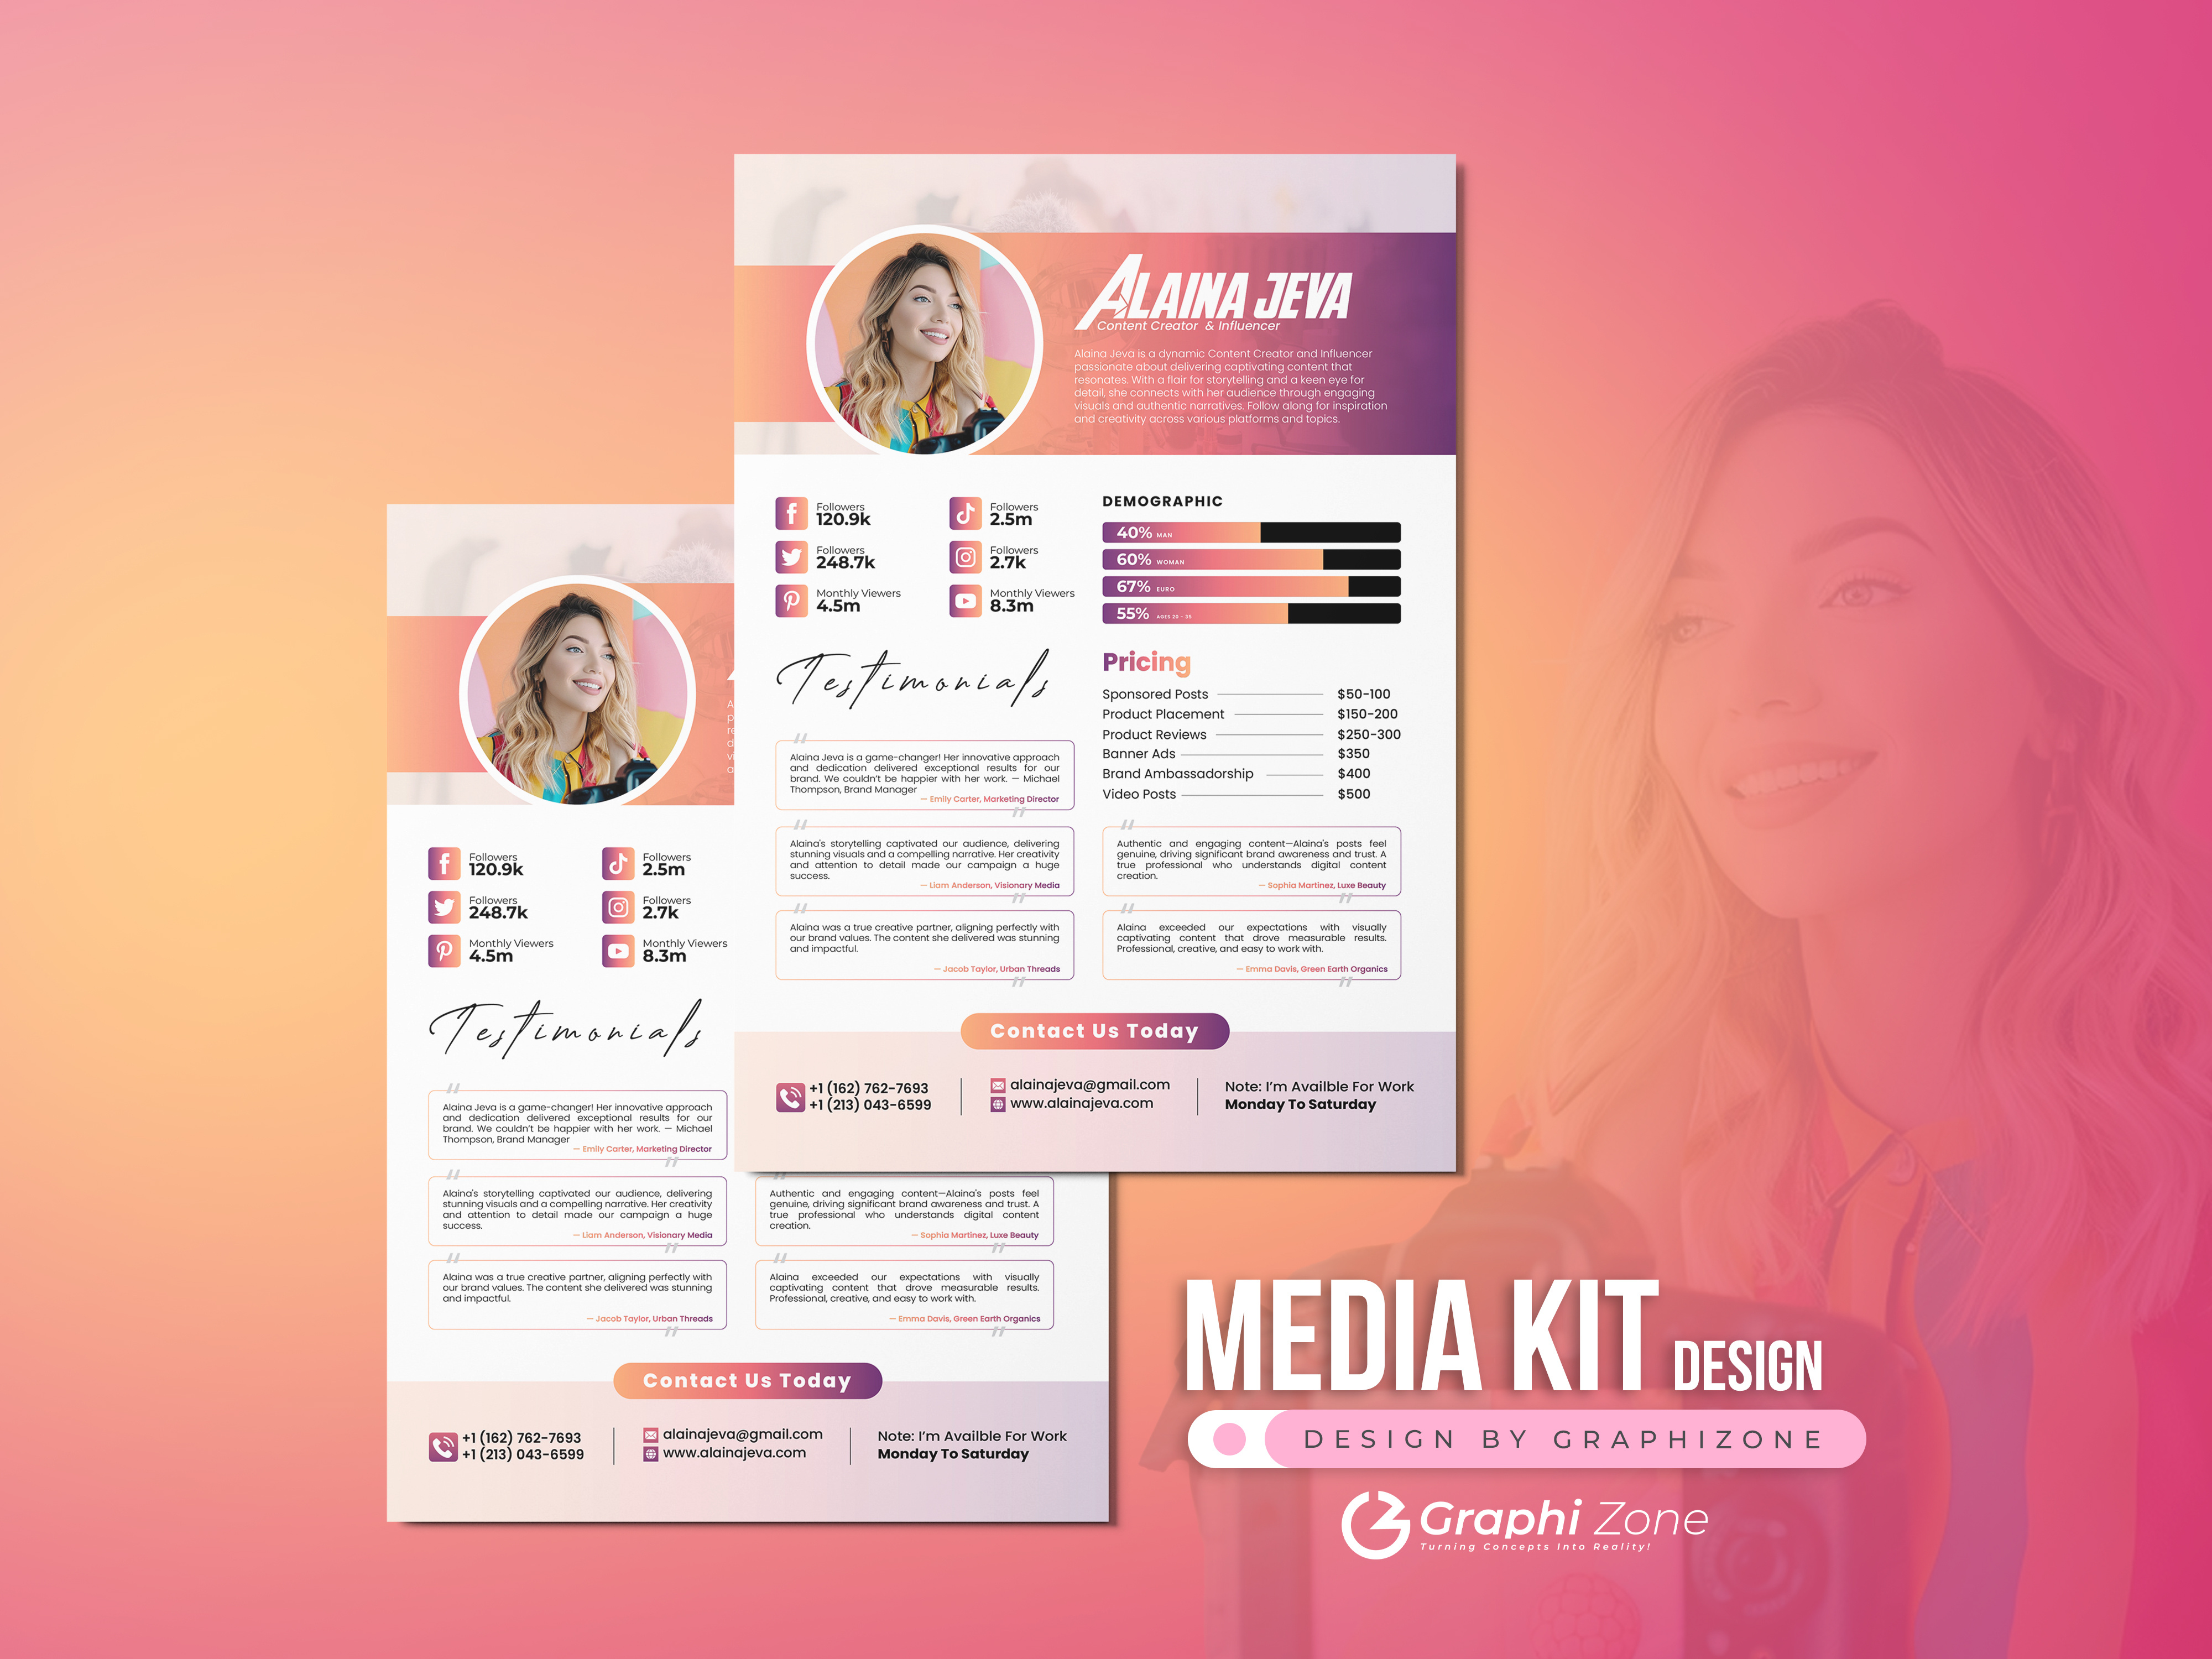
Designing a biography infographic involves synthesizing a narrative arc into a cohesive visual format by balancing biographical data with intentional design elements. To succeed, you must curate essential life milestones, select a logical structural layout—such as timelines or flowcharts—and apply visual hierarchy to ensure readability while maintaining the subject’s unique character and historical context.
The Purpose and Strategy of Biography Infographics
A biography infographic is a visual summary of a person’s life, career, or influence. Unlike a standard text-based curriculum vitae or a lengthy biography, these visual documents prioritize the "at-a-glance" understanding of a person's journey. They are widely used in educational settings, professional portfolios, and corporate history presentations to condense complex information into a digestible, engaging format.
The primary goal of these infographics is not merely to display facts but to reveal a narrative pattern. Before opening any design software, you must define the scope. Is this a chronological overview of a historical figure, a breakdown of a CEO's career trajectory, or a personal branding piece? Identifying the "core hook"—the defining element of the person’s life—will dictate the design choices that follow.
Data Collection and Structural Organization
Before designing, you must treat your research as a data-mining exercise. Biographical data can be overwhelming; effective design depends on your ability to discard the extraneous and highlight the vital.
- Define the Timeline: Establish the primary chronological spine. Common benchmarks include birth, education, entry into a field, significant breakthroughs, awards, and historical impact.
- Select Meaningful Milestones: Avoid the clutter of day-to-day existence. Focus on "inflection points"—events that fundamentally altered the trajectory of the subject's life.
- Group and Categorize: Organize your data into thematic buckets. For example, if you are profiling an inventor, separate their life into "Early Formative Years," "Technical Innovations," and "Societal Contributions."
Once organized, select a layout that supports this flow. Linear timelines work best for straightforward life stories, whereas radial or network-style infographics are better suited to illustrating how a person’s influence radiated across different industries or geographies.
Principles of Visual Hierarchy and Design
Visual hierarchy is the arrangement of elements in a way that implies importance. In a biography infographic, you want the reader’s eye to move naturally from the most critical information to the supporting details.
- Establishing Focal Points: The subject's name and primary photograph or illustration should serve as the anchor. Use large, high-contrast typography for the name and high-quality imagery to establish an immediate connection with the viewer.
- The Rule of Three: Limit your color palette to three or four main colors. Use a primary color for the background or main headers, a secondary color for data points, and a bold accent color for call-outs or critical statistics.
- Typography Balance: Stick to a maximum of two font families. Use a display font for headers that reflects the personality of the subject (e.g., a formal serif for a historical statesman, a clean sans-serif for a tech entrepreneur) and a highly readable body font for the biographical details.
Choosing the Right Tools and Formats
In 2026, the barrier to entry for professional-grade design is lower than ever, provided you choose the right tools for your skill level and requirements.
| Tool Category | Common Examples | Best Used For |
|---|---|---|
| All-in-One Design Platforms | Canva, Adobe Express | Rapid assembly, templates, non-designers. |
| Vector Illustration Software | Adobe Illustrator, Affinity Designer | Custom icons, complex layouts, print-ready. |
| Data-Driven Visualizers | Infogram, Venngage | Projects requiring dynamic data or charts. |
| Whiteboarding/Wireframing | Figma, Miro | Structuring flows before committing to final visuals. |
If you are working with complex data points (such as the growth of a company founded by the subject), prioritize tools with robust charting capabilities. If your focus is primarily narrative-driven with high-quality portraiture, focus on vector-based software that allows for better control over typography and layout composition.
Common Pitfalls and How to Avoid Them
Even with high-quality content, poor design execution can render an infographic ineffective. Avoid these common mistakes:
- Overcrowding: The "white space" (or negative space) is as important as the content. Avoid filling every inch of the canvas. If the reader feels overwhelmed, they will stop engaging with the content.
- Inconsistent Visual Language: Ensure that all icons and illustrations follow the same style. Mixing realistic photos with cartoonish clip-art creates a disjointed experience that damages the professionalism of the piece.
- Ignoring Accessibility: In 2026, accessibility is a baseline requirement. Ensure high color contrast between text and backgrounds (adhering to WCAG guidelines) and use sufficient font sizes. Avoid relying solely on color to convey information, as this excludes color-blind users.
- Ignoring the "Read Order": The human eye naturally travels from top-left to bottom-right in Western cultures. Arrange your narrative flow to respect this, or use intentional visual cues (like lines, arrows, or numbered steps) to guide the reader through non-linear layouts.
Workflow: From Concept to Export
To streamline your process, follow this structured workflow:
- Draft the Narrative Script: Write out the text for the infographic first. This prevents the "fill in the blank" design style, where you try to force text into ill-fitting boxes.
- Sketch the Wireframe: On paper or a whiteboard, map out where the text, icons, and photos will live. This ensures you have identified potential spacing issues before touching your design software.
- Assemble the Visual Elements: Begin with the grid and typography. Once the skeleton is set, add your images and supporting icons.
- Review for Narrative Continuity: Ask yourself if the story makes sense. If you remove the images, does the text still tell a cohesive story? If not, refine the text.
- Export for Target Media: If the infographic is for a social media feed, optimize for mobile (long vertical aspect ratio). If for a print presentation, ensure your file is in CMYK color mode and at least 300 DPI for clarity.
Frequently Asked Questions
What is the ideal length for a biography infographic? The ideal length depends on the platform. For web and mobile, "infographic-style" scrolling designs can be long, but keep the core message within the first 1,000 pixels. For printed documents, stick to a single page (A4 or US Letter) to ensure the content remains dense and impactful.
How do I handle subjects with controversial or complex lives? Focus on verifiable events. Use neutral, objective language and rely on primary sources or documented archives for dates and achievements. If you are highlighting a specific aspect of a complex life, explicitly label the infographic’s scope (e.g., "The Humanitarian Efforts of [Name]") to manage reader expectations.
Do I need professional design skills to create a biography infographic? No. With the rise of modular design templates, the focus has shifted toward curation and storytelling skills rather than manual drawing or complex software training. The value lies in your ability to synthesize information, not your ability to render complex graphics from scratch.
Should I include a bibliography or sources section? Yes. Especially if the biography covers historical or academic subject matter, including a small "Sources" block at the bottom of the infographic adds credibility and allows readers to verify your claims.
What is the best way to handle too much biographical data? If you have too much data, create a "Master List" and then curate. Select only the events that are essential to the narrative arc. If you absolutely must include more, consider using a multi-page carousel format for digital distribution, where each page covers a distinct era of the subject’s life.
Final Recommendation
To begin, start by creating a "Life Map." List every significant date, achievement, and failure on a single sheet of paper. Connect these points to see where the narrative flows. Once the story is clear, draft your text in a word processor to verify the word count and flow before moving to your design platform. This preparation ensures that your final visual product is as meaningful as it is aesthetic.

Image Gallery
Select an image to open it in a new tab.


Omar Farooq
EdTech Innovation and Virtual Pedagogy Journalist
