
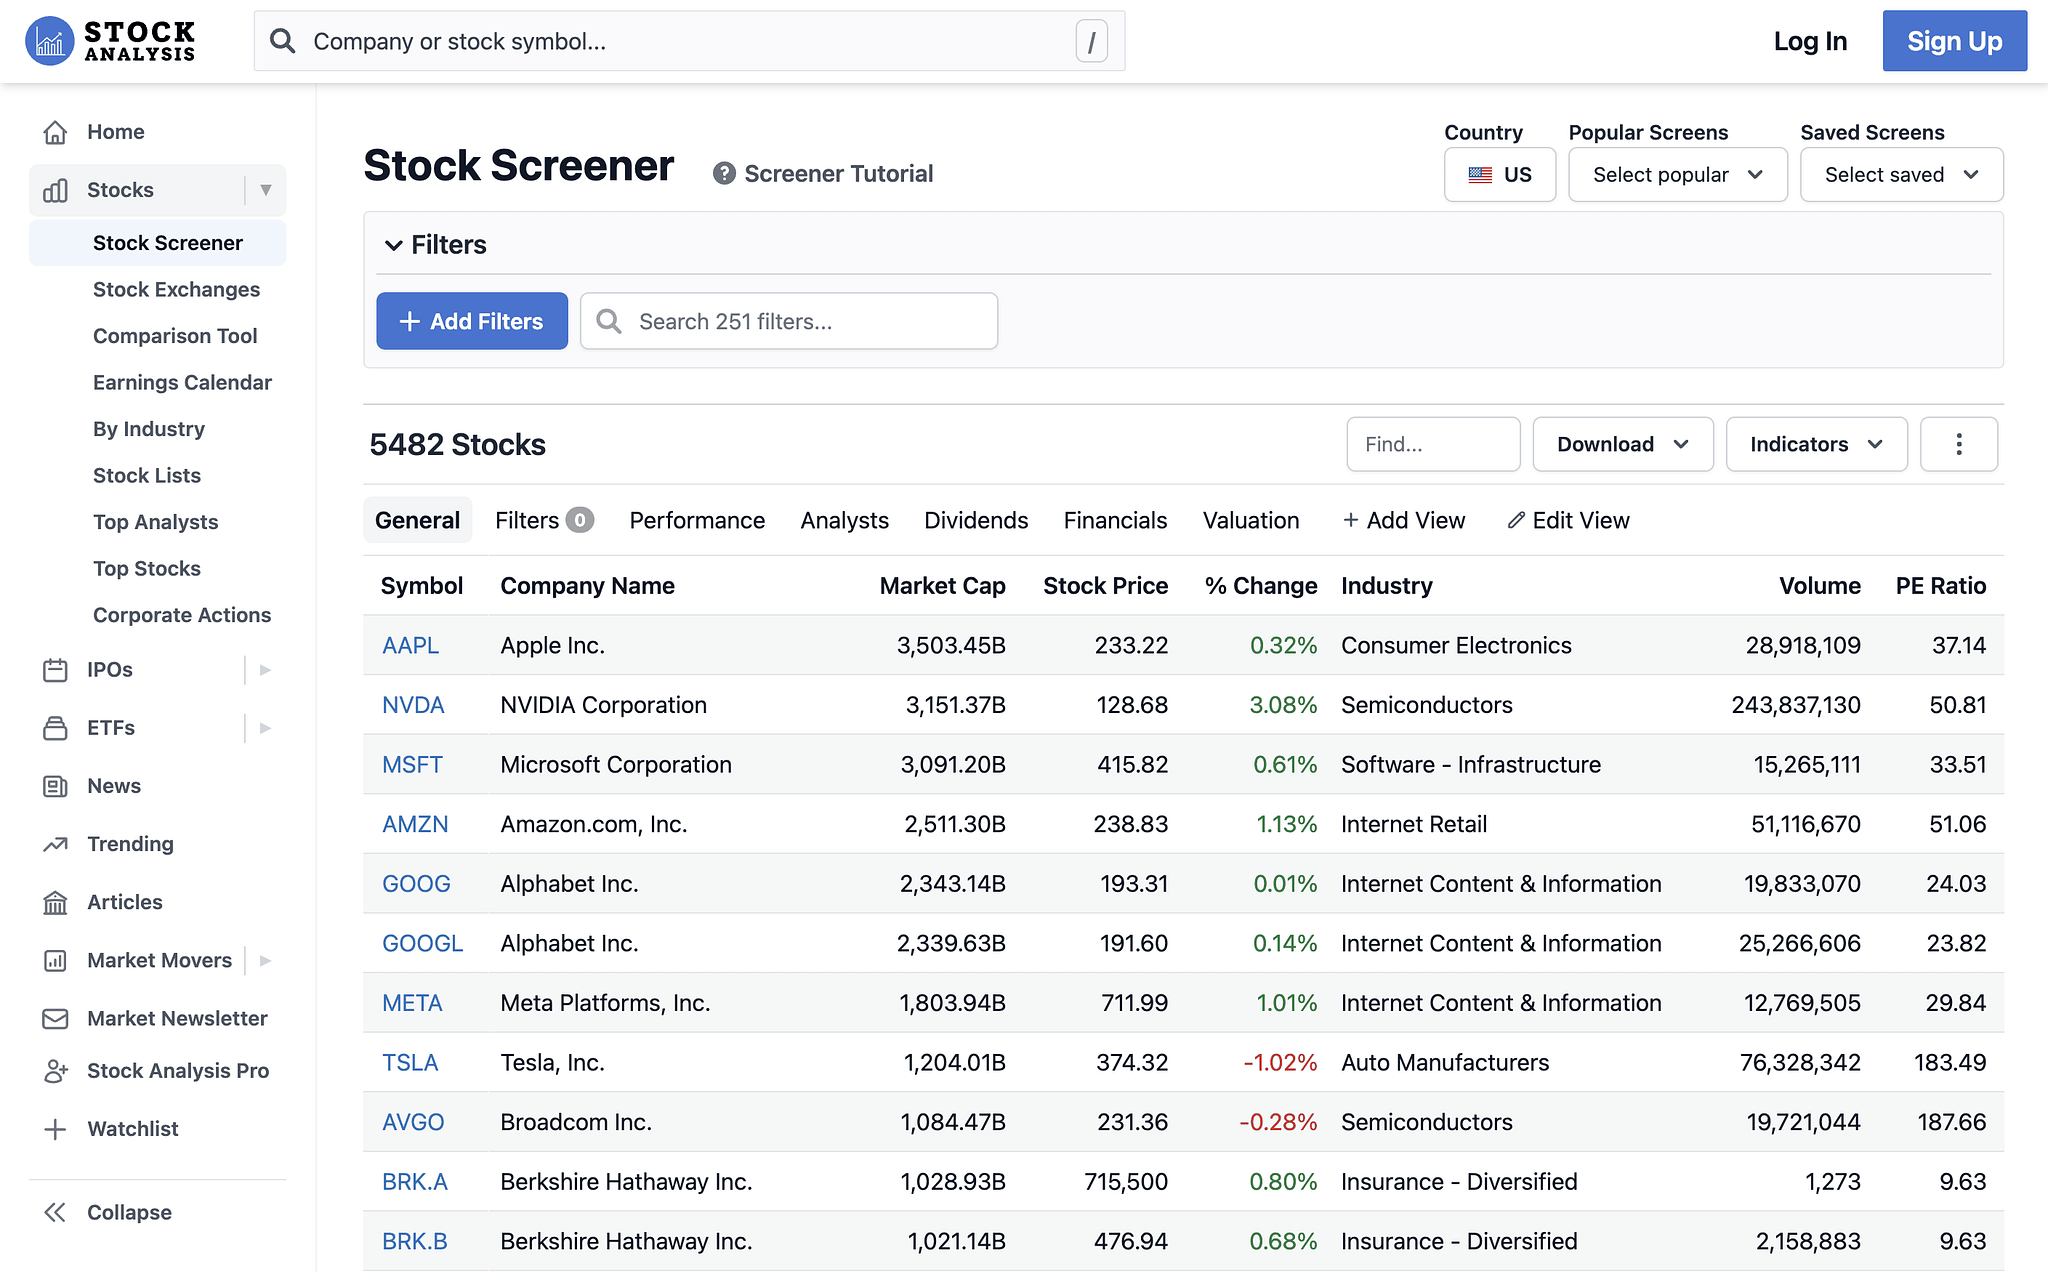
Free stock screeners serve as the primary gateway for retail investors to navigate the complexities of the equity markets, yet they consistently impose restrictions on data speed, filter depth, and historical reach. These limitations exist because high-quality financial data remains expensive to license from exchanges, and providers utilize a "freemium" business model to convert casual users into paying subscribers.
For any investor active in 2026, the stock screener is an indispensable tool. Whether you are a value investor looking for low P/E ratios or a day trader hunting for momentum, the ability to filter thousands of stocks into a manageable shortlist is vital. However, if you have spent any time using the free versions of popular platforms like Finviz, TradingView, or Yahoo Finance, you have likely encountered the "paywall" or the "delayed data" notification. To understand why these limits persist despite the advancement of technology and AI, one must look at the underlying economics of the financial data industry.
The Economics of Financial Data Licensing
The most fundamental reason free stock screeners have limits is the sheer cost of the data itself. Stock exchanges, such as the New York Stock Exchange (NYSE) and the NASDAQ, do not provide their data for free. They treat market data as a proprietary product, charging significant licensing fees to any platform that wishes to redistribute that data to the public.
In 2026, these exchange fees remain a major overhead for fintech companies. For a screener to provide real-time data, they must pay "professional" or "non-professional" user fees for every single person accessing the stream. To offer a free service to millions of users, screeners often opt for delayed data (usually 15 to 20 minutes) or BATS (Better Alternative Trading System) data, which is cheaper but may not reflect the total volume of the entire market.
By limiting the free tier to delayed data, the provider avoids the massive per-user costs associated with real-time feeds. This creates a clear boundary: casual researchers can use the free tool for end-of-day analysis, while active traders who require second-by-second accuracy are incentivized to pay for a premium subscription that covers the exchange licensing costs.
Depth of Filtering and Proprietary Metrics
While a free screener might allow you to filter by basic metrics—such as market capitalization, sector, or current price—it will often gate "advanced" or "proprietary" filters. In 2026, many platforms have developed their own algorithmic scoring systems, such as "Growth Scores," "Sustainability Ratings," or "AI-Driven Sentiment Analysis."
Basic vs. Advanced Fundamental Data
Free screeners typically provide standardized data points found in SEC filings, such as the Price-to-Earnings (P/E) ratio or Dividend Yield. However, sophisticated investors often require "normalized" or "adjusted" data. This involves removing one-time charges or accounting anomalies to see the true operating performance of a company.
Paid screeners employ teams of analysts or advanced AI agents to scrub financial statements and provide these adjusted metrics. Because this "clean" data requires human or high-level computational labor, it is rarely offered for free. If you are looking for a screener that can filter for "Free Cash Flow Yield adjusted for stock-based compensation," you will almost certainly find that feature locked behind a pro-tier subscription.
Technical Analysis Constraints
For technical traders, free screeners often limit the number of indicators that can be applied simultaneously. You might be able to screen for stocks crossing above their 50-day Moving Average, but if you want to combine that with a Relative Strength Index (RSI) divergence, a Bollinger Band squeeze, and specific candlestick patterns, the free version will likely stop you. This is a deliberate "feature ceiling" designed to ensure that professional traders, who rely on complex multi-factor setups, contribute to the platform's revenue.
The Barrier of Historical Data and Backtesting
One of the most significant limits of free stock screeners is the "look-back" period. In 2026, the ability to see how a specific screening strategy would have performed over the last 10, 15, or 20 years is a high-value feature known as backtesting.
Free screeners usually restrict historical data to the last 3 to 5 years. This limitation is critical because:
- Economic Cycles: A 3-year window might only show a bull market or a period of high inflation, providing a skewed view of a strategy's effectiveness.
- Data Storage Costs: Maintaining decades of granular, "point-in-time" data (data as it appeared on a specific day in the past, without survivorship bias) requires massive server infrastructure.
- Intellectual Property: Historical data is a goldmine for quantitative hedge funds and institutional investors. Platforms protect this data to ensure they can sell it at a premium to those who use it for algorithmic modeling.
Without access to long-term historical data, free users are essentially "flying blind" regarding how their filters perform during different market regimes, such as a recession or a sudden interest rate pivot.
Technical Infrastructure and Export Limitations
Operational costs extend beyond data licensing to include server bandwidth and computational power. When a user runs a complex screen across 10,000+ global equities, it puts a load on the provider's database.
The CSV and API Export Paywall
A common frustration for free users is the inability to export data. You might find 50 stocks that meet your criteria, but if you want to download that list into Excel or Google Sheets for further modeling, you will often find the "Export to CSV" button is disabled for free accounts.
Similarly, API (Application Programming Interface) access is almost never free. APIs allow a user's own software or spreadsheets to "talk" to the screener's database directly. Since this allows users to bypass the platform's advertisements and potentially build their own competing tools, providers keep API keys reserved for high-paying enterprise or "Pro" users.
Mobile Alerts and Notifications
In the 2026 market environment, volatility can strike at any hour. Many free screeners allow you to save a certain number of screens, but they will not send you real-time push notifications or SMS alerts when a new stock enters that screen. Monitoring and sending millions of automated alerts requires significant messaging infrastructure and costs. Consequently, "unlimited alerts" or "instant notifications" remain one of the most effective upsells for premium financial services.
Comparison Table: Free vs. Paid Stock Screener Features (2026)
| Feature | Free Tier Limitation | Paid/Pro Tier Benefit | Primary Reason for Limit |
|---|---|---|---|
| Data Latency | 15–20 Minute Delay | Real-time / Tick-by-tick | Exchange Licensing Fees |
| Historical Data | 3–5 Years | 20+ Years / Max Available | Storage & Data Integrity Costs |
| Exporting | Web view only | CSV, Excel, PDF Export | Monetization of "Data Portability" |
| Backtesting | None or very basic | Full strategy simulation | High Computational Load |
| Alerts | 1–3 Basic Alerts | Unlimited Real-time Alerts | Server & Notification Costs |
| Global Reach | Local markets only | 100+ International Exchanges | International Data Sourcing Costs |
| Technical Support | Community / Help Docs | Priority Email/Phone Support | Human Labor Costs |
The 2026 Perspective: AI and the "Compute" Limit
By 2026, many free stock screeners have integrated basic AI chat interfaces, allowing users to ask, "Show me undervalued tech stocks." While this has made screening more accessible, it has introduced a new type of limit: compute tokens.
Processing natural language queries and scanning global databases in real-time requires significant GPU (Graphics Processing Unit) power. Most "free" AI screeners now limit the number of "deep dives" or "AI queries" a user can perform per day. If you want the AI to perform a multi-step analysis—such as "Compare the inventory turnover of these 10 companies against the industry average over 10 years and identify the outlier"—the computational cost is high enough that it is restricted to paying subscribers.
User Experience: Ads and the Engagement Trap
Finally, we must consider the user experience (UX). Free stock screeners are often cluttered with advertisements, ranging from banner ads to "sponsored" stock picks. These ads are the primary way the provider offsets the cost of the "free" data they are giving you.
Furthermore, free versions are designed to be "sticky" but limited, often referred to as "crippleware" in the software industry. By giving you just enough functionality to see the value of the tool but not enough to execute a professional-grade strategy, the provider creates a psychological bridge to the paid version. You might find a great stock on a free screener, but you'll need the paid version to see the "Analyst Price Targets" or the "Institutional Ownership" breakdown that confirms your thesis.
Frequently Asked Questions
Why can't I see real-time prices on my free screener?
Real-time price data is a premium product sold by stock exchanges. If a screener provided this to you for free, they would likely lose money on your account due to the licensing fees they must pay to the NYSE or NASDAQ on your behalf. Most free screeners provide data that is delayed by at least 15 minutes to avoid these "per-user" fees.
Is the data on free screeners less accurate than paid ones?
Generally, the data is accurate but incomplete or delayed. While the P/E ratio you see on a free site is usually correct based on the last closing price, it may not account for a massive price swing that happened five minutes ago. Furthermore, free sites may use a smaller subset of data (like the BATS exchange) which might show slightly different trading volumes than the total market.
Why do some free screeners limit the number of saved portfolios?
Saving portfolios requires database storage and continuous tracking of those specific tickers to provide updates. To manage server load and encourage users to upgrade, providers limit free accounts to a small number of "watchlists" or "saved screens."
Can I get around these limits using multiple free tools?
You can "stack" tools—using one for technical charts and another for fundamental filtering—but you will still face the core issues of data latency and the inability to export data for unified analysis. The time spent manually moving data between different free tools often outweighs the cost of a single premium subscription for serious investors.
Are there any truly unlimited free stock screeners in 2026?
"Truly unlimited" is a misnomer in financial services. Some newer platforms might offer more features for free to gain market share, but they usually compensate by selling user data to hedge funds (payment for order flow logic) or eventually introducing a paid tier once they have a large enough user base.
Practical Recommendation for Navigating Limits
If you are a beginner, start with a robust free screener like Finviz or TradingView to learn the basics of ratios and technical indicators. However, as your capital at risk increases, the "cost" of a 15-minute delay or the lack of deep historical backtesting becomes much higher than the price of a monthly subscription.
For investors managing a significant portfolio in 2026, the best approach is to identify the one specific limitation that hinders your strategy most. If you need historical depth, look for a fundamental-heavy tool like WallStreetZen or Seeking Alpha. If you need real-time speed and technical alerts, a pro-tier TradingView or TC2000 subscription is often the better investment. Use free tools for broad discovery, but rely on professional-grade data for the final execution of your trades.
Image Gallery
Select an image to open it in a new tab.
Lars Thomsen
Global Labor Markets and Economic Strategy Editor
