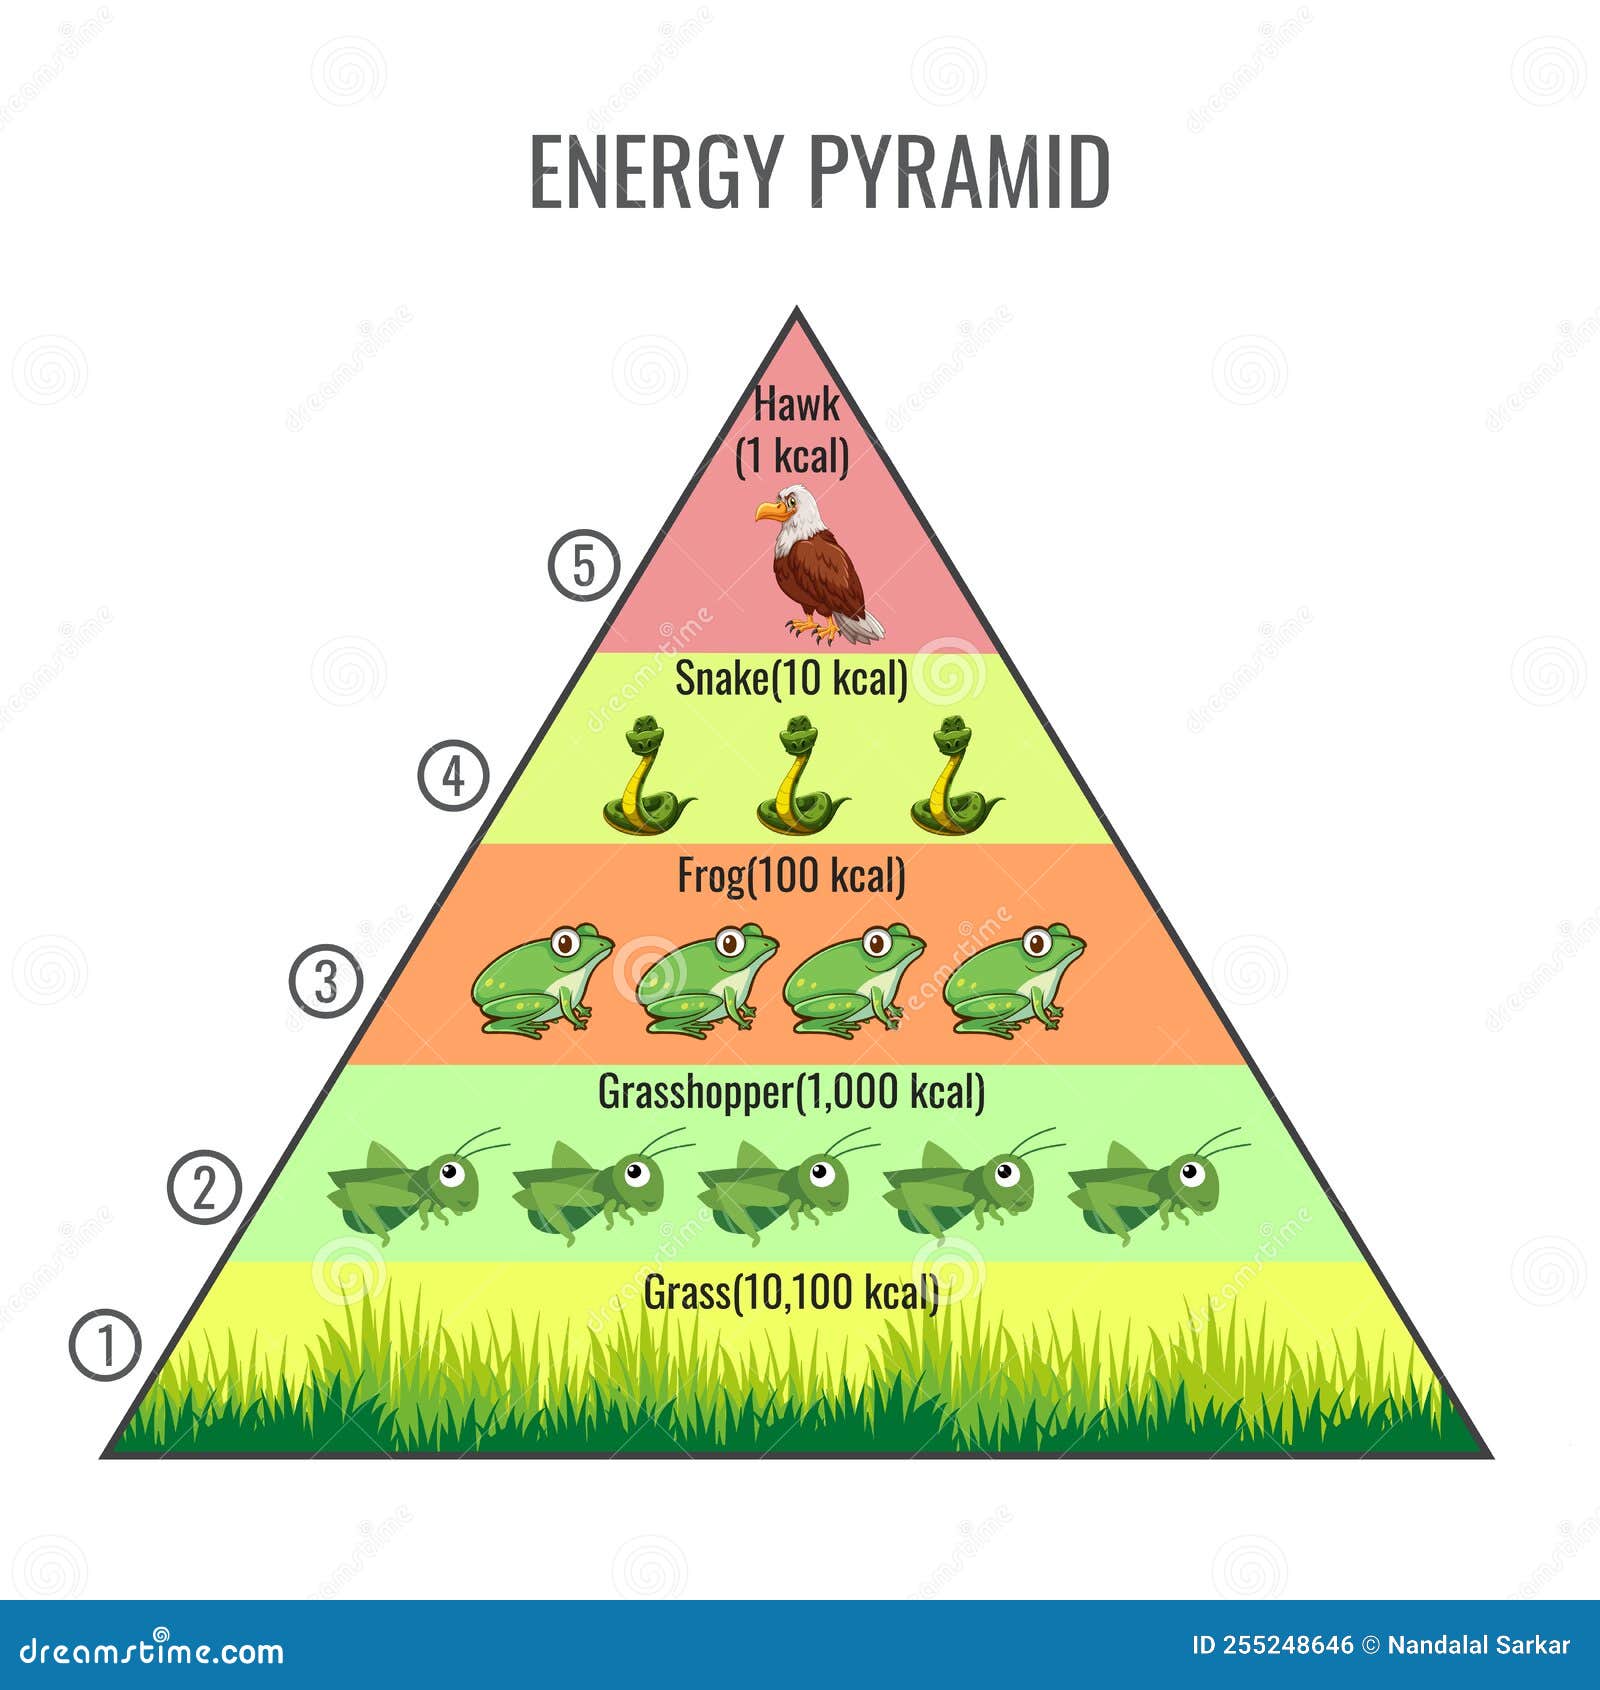
Creating an energy pyramid project involves constructing a physical or digital model that visually demonstrates how energy flows through an ecosystem's trophic levels, typically illustrating the 10% rule where only a fraction of energy passes from one level to the next. This foundational ecological concept requires careful planning, appropriate material selection, and accurate data representation to ensure both scientific precision and visual appeal.
Understanding the Ecological Principles of the Energy Pyramid
Before beginning construction on any ecological model, it is necessary to examine the biological and thermodynamic principles that govern energy pyramids. An energy pyramid is a graphical representation designed to show the flow of energy through each trophic level in a given ecosystem. Unlike biomass or numbers pyramids, which can occasionally be inverted under unique ecological conditions, an energy pyramid is always upright. This immutable rule is a direct consequence of the First and Second Laws of Thermodynamics.
Energy enters nearly all ecosystems via primary producers—typically autotrophs like plants, phytoplankton, and cyanobacteria—which convert solar radiation into chemical energy through photosynthesis. These producers occupy the broad base of the pyramid. As consumers ingest these organisms, energy is transferred upward through successive trophic levels: primary consumers (herbivores), secondary consumers (carnivores and omnivores), and tertiary consumers (apex predators).
However, this transfer is inherently inefficient. At each transition from one trophic level to the next, approximately 90% of the available energy is lost to the environment. This loss occurs primarily through metabolic heat production, cellular respiration, movement, and unconsumed or undigested matter. Consequently, only about 10% of the energy is stored as biomass and made available to the next higher level. This biological reality, often termed the 10% rule, explains why food chains rarely extend beyond four or five trophic levels; there simply is not enough cumulative energy remaining to sustain populations of higher-order predators.
Choosing the Right Format and Materials for Your Project
Selecting an appropriate format depends heavily on your target setting, whether it is a middle school science fair, a high school biology presentation, or an advanced university ecology exhibition. Projects generally fall into three structural categories: 3D physical models, digital presentations, and interactive displays.
3D Physical Models
Three-dimensional physical models are the most traditional and frequently assigned format for hands-on learning. They allow students to manipulate textures, demonstrate scale, and construct physical representations of living organisms.
- Styrofoam or Cardboard Blocks: Stacking graduated blocks or cutting nested foam squares creates a literal pyramid structure. Each tier represents a distinct trophic level.
- Recycled and Natural Materials: Utilizing items such as cardboard boxes, shoe boxes, egg cartons, or wood scraps provides an eco-friendly approach. Natural items like twigs, moss, dried leaves, and pebbles can add realistic textures to terrestrial or aquatic biomes.
- Clay and Paper Mache: Molding animals and plants out of air-dry clay or paper mache adds a sculptural element, making the specific organisms clearly identifiable.
Digital and Poster Formats
If space or resources are limited, digital infographics or traditional poster boards offer a clean, highly informative alternative. These formats excel at displaying complex data sets, scientific calculations of kilocalories (kcal), and detailed flowcharts without the structural instability of physical builds.

Step-by-Step Guide to Building a 3D Energy Pyramid Model
Constructing a structurally sound and scientifically accurate 3D energy pyramid requires a systematic approach. Rushing into assembly without a blueprint often results in unstable tiers or inaccurate proportional representations.
Step 1: Research and Data Calculation
Begin by selecting a specific ecosystem, such as a temperate deciduous forest, a marine coral reef, or an African savanna. Gather baseline energy data or establish a hypothetical baseline using standard ecological measurements. For example, assign the primary producers a starting value of 10,000 kilocalories ($10,000\text{ kcal}$). Calculate the subsequent levels based on the 10% rule:
- Primary Producers (Base): $10,000\text{ kcal}$ (Grass, trees, phytoplankton)
- Primary Consumers (Tier 2): $1,000\text{ kcal}$ (Rabbits, grasshoppers, zooplankton)
- Secondary Consumers (Tier 3): $100\text{ kcal}$ (Frogs, small birds, small fish)
- Tertiary Consumers (Apex Tier): $10\text{ kcal}$ (Hawks, wolves, sharks)
Step 2: Constructing the Base Structure
Cut your structural material—such as sturdy corrugated cardboard or foam board—into graduated squares or triangular panels. If you are building a four-sided pyramid, you will need four identical triangular faces or a series of stacked, progressively smaller cubes or rectangular boxes.
Stacking boxes is often the easiest method for beginners, as it creates flat platforms on each level where model organisms or descriptive labels can rest securely. Ensure that the footprint of each successive tier is visibly smaller than the one beneath it, accurately reflecting the tapering geometry of ecological efficiency.
Step 3: Populating the Trophic Levels
Decorate each level to represent the chosen ecosystem accurately. Paint the background or wrap each tier in colored construction paper corresponding to the biome (e.g., earthy greens and browns for forests, deep blues for marine environments).
Place representative organisms on each tier. You can use printed and cut-out pictures, plastic figurines, or handmade clay models. Ensure that the organisms placed on each tier strictly belong to that specific trophic level. Placing a tertiary consumer like a lion on the primary producer level is a common error that compromises the educational validity of the project.
Step 4: Adding Labels, Arrows, and Data
A complete energy pyramid project must communicate scientific data clearly. Incorporate the following labeling elements:
- Trophic Level Names: Clearly label each tier (Primary Producers, Primary Consumers, Secondary Consumers, Tertiary Consumers).
- Energy Values: Display the calculated kilocalorie or Joule values on each level to demonstrate the 10% rule in action.
- Loss Indicators: Add annotations or secondary arrows pointing outward from the tiers to indicate energy lost as metabolic heat during respiration.
Comparison of Energy Pyramid Formats
| Format | Primary Advantages | Best Suited For | Common Challenges |
|---|---|---|---|
| Stacked Box 3D Model | Highly visual, sturdy platforms for figures, easy to source materials. | Middle school science fairs, hands-on classrooms. | Can become bulky; requires precise cutting for stability. |
| Hollow Triangular Pyramid | Geometrically accurate shape, lightweight, sleek aesthetic. | High school biology projects, competitive exhibitions. | Internal space is unusable; fragile if made of thin poster board. |
| Digital Infographic | Unlimited detail, easy to edit, incorporates rich media and charts. | Remote learning, science communication, modern presentations. | Lacks tactile, physical presence; requires graphic design software. |
| Flat Poster Board | Cost-effective, simple layout, excellent for detailed text explanations. | Standard classroom assignments, budget-constrained projects. | Two-dimensional limitations; less eye-catching from a distance. |
Common Mistakes to Avoid When Creating Your Project
Even advanced students occasionally commit conceptual errors that undermine the scientific accuracy of their models. Avoiding these pitfalls ensures your project stands up to rigorous academic evaluation.
Confusing Energy Pyramids with Biomass or Numbers Pyramids
The most frequent mistake is mixing up ecological pyramids. While a pyramid of numbers can sometimes be inverted—such as a single large oak tree supporting thousands of insects—an energy pyramid can never be inverted. Energy is always lost at each transfer; therefore, the total energy available at the producer level must always be greater than the energy at any consumer level.
Miscalculating the 10% Transfer Rate
Check your mathematical calculations carefully. If your primary producers start at $5,000\text{ kcal}$, the primary consumers must receive $500\text{ kcal}$ (not $2,500\text{ kcal}$ or $50\text{ kcal}$). Maintaining consistent mathematical scaling across all tiers is critical for demonstrating an understanding of thermodynamic efficiency.
Overcrowding Trophic Levels
Avoid placing too many organisms on a single tier, particularly on the upper levels. Because tertiary consumers exist in much smaller populations in nature, piling dozens of apex predators onto a tiny top tier misrepresents ecological carrying capacity and population dynamics.
Frequently Asked Questions
What is the 10% rule in an energy pyramid?
The 10% rule states that when energy is passed in an ecosystem from one trophic level to the next, only about 10% of the energy is passed on. The remaining 90% is largely lost to the surrounding environment as heat during metabolic processes, respiration, and movement.
Can an energy pyramid ever be inverted?
No. Unlike pyramids of numbers or biomass—which can occasionally feature a larger number of consumers than producers, such as insects feeding on a single tree—energy pyramids are strictly upright. Thermodynamics dictates that usable energy decreases monotonically as it moves up the food chain.
What materials are best for a school science project?
Sturdy corrugated cardboard, foam board, and air-dry clay are among the best materials. Cardboard provides a strong structural foundation for stacking tiers, while clay or printed cutouts allow you to populate each level with recognizable plants and animals.
How do I calculate the energy values for my model?
Choose a realistic baseline number for your primary producers, such as $10,000\text{ kcal}$ or $1,000\text{ Joules}$. Multiply that number by 0.10 (or divide by 10) for each subsequent trophic level as you move upward toward the apex predators.
Why do food chains stop after three or four consumer levels?
Food chains are naturally limited because the rapid depletion of energy at each trophic level leaves insufficient energy to sustain viable populations of higher-order predators beyond the fourth or fifth tier.
Next Actions and Final Polish
To finalize your energy pyramid project, review your work against your assignment rubric or project guidelines. Ensure that all labels are spelled correctly, mathematical calculations are double-checked for accuracy, and structural elements are securely glued or fastened. If presenting orally, practice explaining the flow of energy and the significance of the 10% rule in your chosen ecosystem, as verbal comprehension completes a successful scientific presentation.
Image Gallery
Select an image to open it in a new tab.


Simon Caldwell
Enterprise Technology and Systems Editor
