Understanding High R-Squared in Statistical Analysis: Definition, Context, and Interpretation
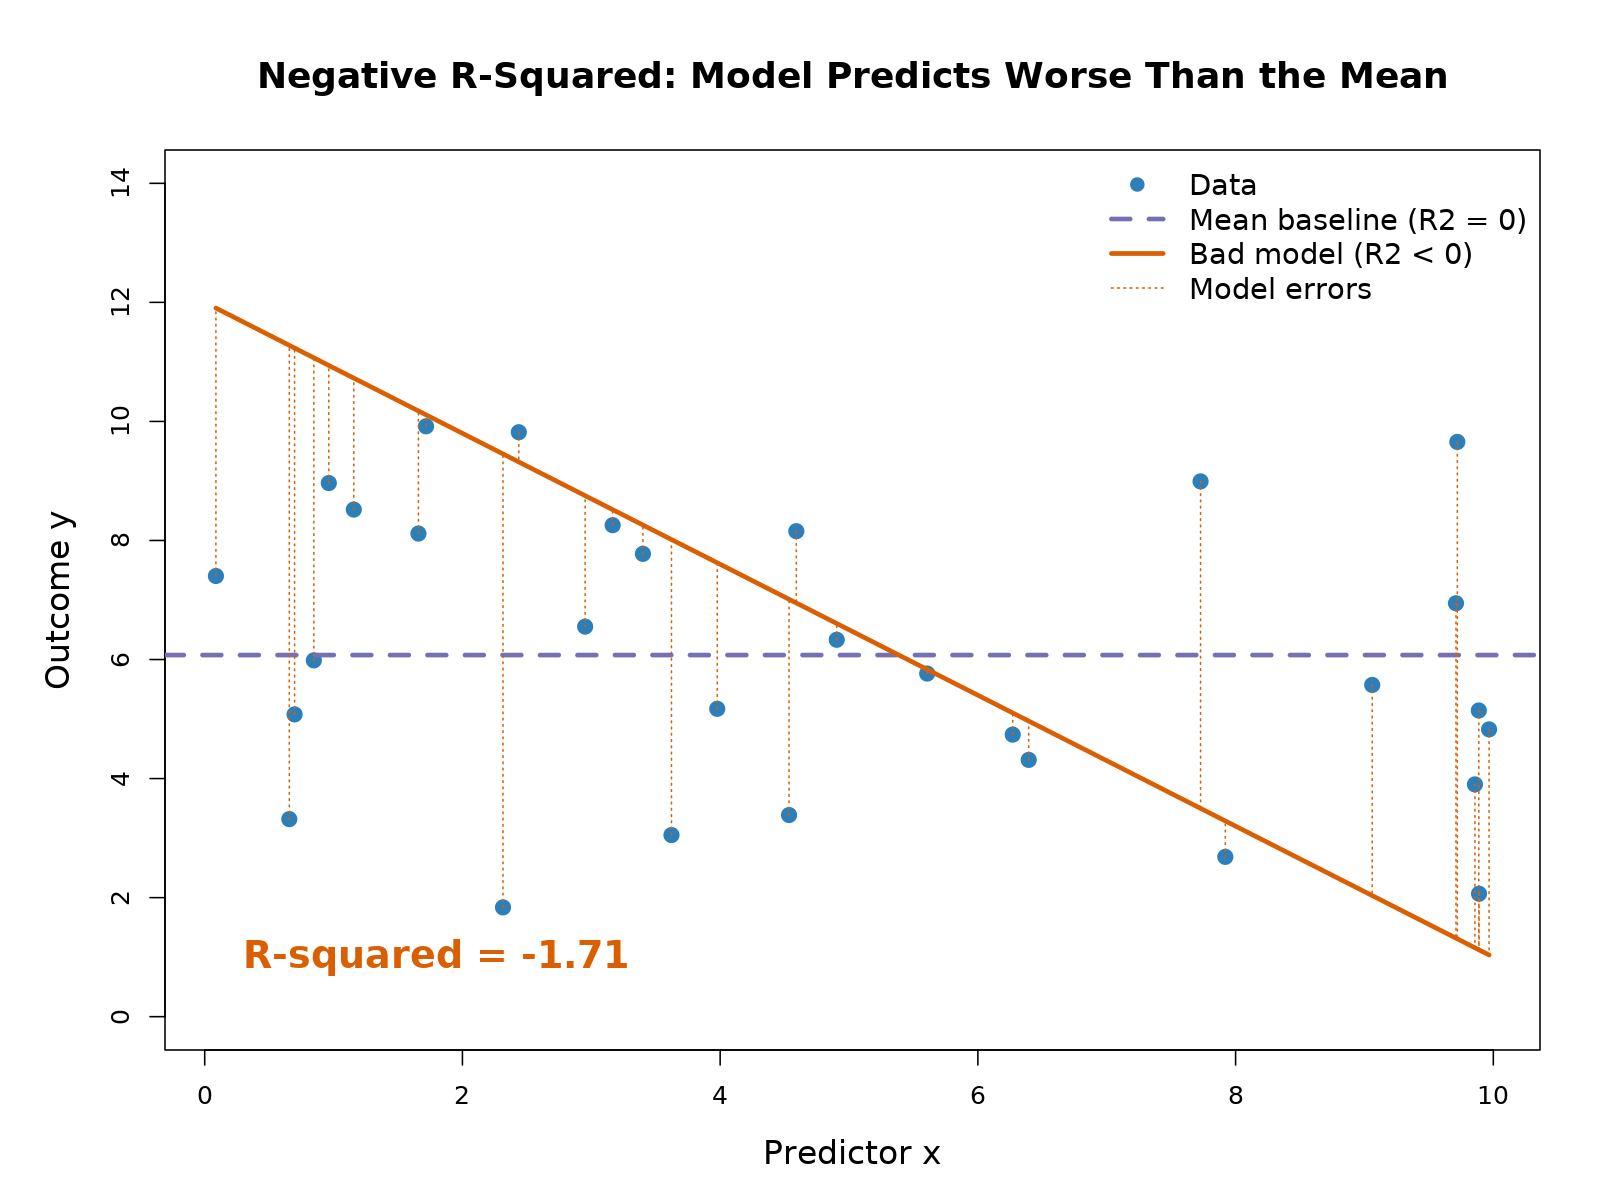
In statistical analysis, a high R-squared indicates that a large proportion of the variance in the dependent variable is explained by the independent variables within a regression model. Specifically, it suggests a strong fit between the observed data points and the fitted regression line, though it does not inherently prove a causal relationship or model accuracy.
R-squared ($R^2$), also known as the coefficient of determination, is one of the most frequently cited statistics in regression analysis. Whether you are working in social science, finance, or engineering in 2026, the quest for a "high" R-squared often dominates the modeling process. However, the interpretation of what constitutes a high value—and whether that value is actually desirable—is a nuanced topic that requires a deep understanding of statistical theory and the specific context of the data being analyzed.
The Fundamental Mechanics of R-Squared
To understand what a high R-squared means, one must first understand how it is calculated. At its core, R-squared measures the strength of the relationship between your model and the dependent variable on a convenient 0 – 100% scale (or 0.0 to 1.0).
The mathematical formula is generally expressed as: $$R^2 = 1 - \frac{SS_{res}}{SS_{tot}}$$
Where:
- $SS_{res}$ (Sum of Squares Residuals): This represents the sum of the squares of the vertical deviations from each data point to the fitted line. In simpler terms, it is the "error" or the variance the model failed to capture.
- $SS_{tot}$ (Total Sum of Squares): This represents the total variance in the dependent variable, calculated as the sum of the squares of the differences between each observation and the mean of the dependent variable.
When you achieve a high R-squared, the $SS_{res}$ is very small compared to the $SS_{tot}$. This means the distance between the actual data points and the regression line is minimal. From a purely mathematical standpoint, the model has "accounted for" the movement of the data. However, as we will explore, "accounting for" variance is not the same as discovering a universal truth.
What Defines a "High" R-Squared?
There is no universal threshold for a "high" R-squared. The definition of a "good" or "high" value is entirely dependent on the field of study and the complexity of the phenomenon being modeled. In 2026, as automated machine learning (AutoML) tools become more prevalent, the temptation to chase a high $R^2$ is stronger than ever, but professional analysts must remain grounded in domain-specific standards.
High R-Squared in Physical Sciences and Engineering
In fields like physics, chemistry, or mechanical engineering, where the laws of nature are relatively constant and measurement error is often low, a high R-squared is typically expected to be 0.90 or greater. If an engineer is measuring the relationship between temperature and the expansion of a specific metal alloy, an $R^2$ of 0.98 is common. Anything significantly lower might suggest an experimental error, a faulty sensor, or a missing physical variable.
High R-Squared in Social Sciences and Economics
In contrast, social sciences deal with human behavior, which is notoriously unpredictable and influenced by an infinite array of variables. In fields like psychology, sociology, or market research, an R-squared of 0.30 to 0.50 might be considered remarkably high. If you are predicting consumer spending habits based on income levels, you are ignoring thousands of other factors (personality, location, family size, debt). In these cases, a "low" R-squared can still be statistically significant and provide valuable insights into trends, even if it doesn't explain all the variance.
High R-Squared in Finance and Modern Analytics
In the financial markets of 2026, high R-squared values are often sought in "index tracking" or "beta" analysis. If a mutual fund is designed to mirror the S&P 500, a high R-squared (0.95+) is a sign of success, indicating the fund’s price movements are highly correlated with the index. Conversely, for an "alpha-seeking" hedge fund, a high R-squared relative to a benchmark might actually be a negative sign, suggesting the manager isn't providing the unique, uncorrelated returns they promised.
The Difference Between Correlation and Explanation
A high R-squared confirms that your independent variables are correlated with the dependent variable, but it is not a certificate of causality. This is a critical distinction in analysis. You can find a high R-squared between two variables that have absolutely no logical connection—a phenomenon known as spurious correlation.
For example, a model might show a high R-squared between the number of swimming pools in a city and the number of library cards issued. While the math suggests one "explains" the other, the reality is likely a third "lurking" variable, such as population growth or neighborhood wealth, that drives both. A high R-squared in a model that lacks a logical theoretical framework is essentially meaningless.
When a High R-Squared is Misleading: Common Pitfalls
It is a common mistake for junior analysts to assume that a higher R-squared always equals a better model. There are several scenarios where a high R-squared is actually a "red flag" for a flawed analysis.
1. Overfitting the Model
Overfitting occurs when a model is too complex and begins to "memorize" the noise in the data rather than the underlying trend. If you add enough independent variables to a regression equation, you can almost always force the R-squared to approach 1.0. In 2026, with the sheer volume of "Big Data" available, it is easy to include 50 different variables to predict a single outcome. While this creates a high R-squared on your current dataset, the model will likely fail miserably when applied to new, unseen data because it has captured random fluctuations that won't repeat.
2. The Problem of Multicollinearity
A high R-squared can sometimes be the result of multicollinearity, which happens when two or more independent variables are highly correlated with each other. For instance, if you are predicting home prices and include both "square footage" and "number of rooms" as independent variables, they likely provide redundant information. This can inflate the R-squared while making the individual coefficients of the variables unstable and difficult to interpret.
3. Autocorrelation in Time Series Data
In time series analysis (tracking data over time), it is very common to see extremely high R-squared values (e.g., 0.98 or 0.99). This often happens because the variable today is highly dependent on what it was yesterday. For example, the price of a stock at 10:00 AM is highly correlated with its price at 9:59 AM. This high R-squared doesn't mean your model has "solved" the stock market; it simply reflects the inherent continuity of the data. Analysts often use "First Differencing" (measuring the change from one period to the next) to remove this bias.
Moving Beyond R-Squared: Adjusted R-Squared and Other Metrics
To combat the limitations of a standard R-squared, professional analysts rely on more robust metrics. The most important of these is Adjusted R-squared.
Unlike the standard R-squared, the Adjusted R-squared accounts for the number of predictors in the model. It only increases if the new variable improves the model more than would be expected by chance. If you add a useless variable, the Adjusted R-squared will actually decrease. This makes it a far more reliable indicator of model quality, especially in multiple regression.
| Metric | Purpose | When to Use |
|---|---|---|
| Standard R-Squared | Measures goodness-of-fit for simple models. | Initial exploratory data analysis. |
| Adjusted R-Squared | Penalizes for unnecessary variables. | Comparing models with different numbers of predictors. |
| Predicted R-Squared | Indicates how well the model predicts new data. | Determining if a model is overfit. |
| P-Value | Measures statistical significance of variables. | Deciding which variables actually matter. |
| RMSE (Root Mean Square Error) | Measures the average distance from the line. | When the magnitude of error is more important than the ratio. |
Practical Steps for Verifying Your Regression Model
If you find yourself with a high R-squared, do not celebrate immediately. Follow these verification steps to ensure your analysis is sound:
- Check the Residual Plots: This is the most important step. A residual plot shows the difference between the observed value and the predicted value. If the residuals are randomly scattered around the zero line, your model is likely good. If you see a pattern (like a "U" shape or a cone shape), your model is missing a key relationship, and the high R-squared is misleading.
- Evaluate the P-Values: Ensure that your independent variables are statistically significant. A high R-squared with high P-values (usually > 0.05) suggests that your model is "fishing" for correlations that aren't actually there.
- Perform Cross-Validation: Split your data into a "training" set and a "testing" set. Build the model on the training set and see if the R-squared remains high when applied to the testing set. If it drops significantly, you have overfit your model.
- Look for Outliers: A few extreme data points can sometimes artificially inflate or deflate an R-squared value. Removing or investigating these outliers is essential for a clean analysis.
Comparisons of R-Squared Across Contexts
To help visualize how the definition of "high" changes, consider the following table based on standard analytical practices as of 2026.
| Field of Analysis | "High" R-Squared Threshold | Typical Reasoning |
|---|---|---|
| Laboratory Physics | > 0.95 | Controlled environments with minimal external noise. |
| Quality Control (Mfg) | > 0.85 | Precise machinery produces highly predictable outputs. |
| Real Estate Appraisal | 0.70 - 0.85 | Prices are driven by clear factors like size, age, and location. |
| Corporate Finance | 0.50 - 0.70 | Market sentiment and macro-trends introduce variability. |
| Behavioral Psychology | 0.20 - 0.40 | Human behavior is influenced by thousands of unmeasured variables. |
| Political Science | 0.10 - 0.30 | Complex social dynamics make precise prediction very difficult. |
Frequently Asked Questions
Can a high R-squared be a bad thing?
Yes. A high R-squared can be a sign of overfitting, meaning the model has captured random noise rather than the actual trend. It can also be caused by multicollinearity (redundant variables) or data leakage (where the model accidentally has access to the "answer" during training). Always validate a high R-squared with residual analysis.
Is it possible to have a low R-squared but a good model?
Absolutely. In fields like medicine or social science, researchers often look for "small but significant" effects. For example, a new medication might only explain 5% of the variance in patient recovery ($R^2 = 0.05$), but if that 5% represents thousands of lives saved, the model is incredibly valuable. As long as the independent variables are statistically significant (low P-values), a low R-squared is not a deal-breaker.
How does R-squared differ from Correlation (r)?
Correlation ($r$) measures the strength and direction of a linear relationship between two variables. R-squared ($R^2$) is the square of the correlation coefficient. While $r$ ranges from -1 to 1, $R^2$ ranges from 0 to 1 and tells you how much of the variance in one variable is explained by the other.
Does a high R-squared mean the model is accurate?
Not necessarily. R-squared measures "fit," not "accuracy." A model could have a high R-squared but still be biased. For example, if you use a linear model for data that is actually curved (non-linear), you might still get a high R-squared even though the model will give poor predictions at the extremes.
Why did my R-squared increase when I added a random variable?
This is a mathematical property of R-squared. Because the calculation is based on the Sum of Squares, adding any variable—even one consisting of random numbers—will usually decrease the residuals by a tiny amount, thus increasing the R-squared. This is why you should always use Adjusted R-squared for models with multiple variables.
Summary and Next Actions
A high R-squared is a signal that your independent variables are effectively capturing the variance of your dependent variable, but it is not a final confirmation of a successful model. In the analytical landscape of 2026, the key to professional success is moving beyond this single number to look at the "health" of the entire model.
If you have achieved a high R-squared in your current analysis, your next steps should be:
- Validate with Adjusted R-squared to ensure you haven't simply added too many variables.
- Inspect residual plots for non-random patterns that suggest a poor model fit.
- Check for multicollinearity using Variance Inflation Factor (VIF) scores to ensure your predictors are independent.
- Confirm domain relevance by asking if the high correlation makes sense in a real-world context.
By treating R-squared as a single piece of a larger puzzle rather than the ultimate goal, you ensure that your statistical analysis is both robust and meaningful.
Image Gallery
Select an image to open it in a new tab.
Omar Farooq
EdTech Innovation and Virtual Pedagogy Journalist
