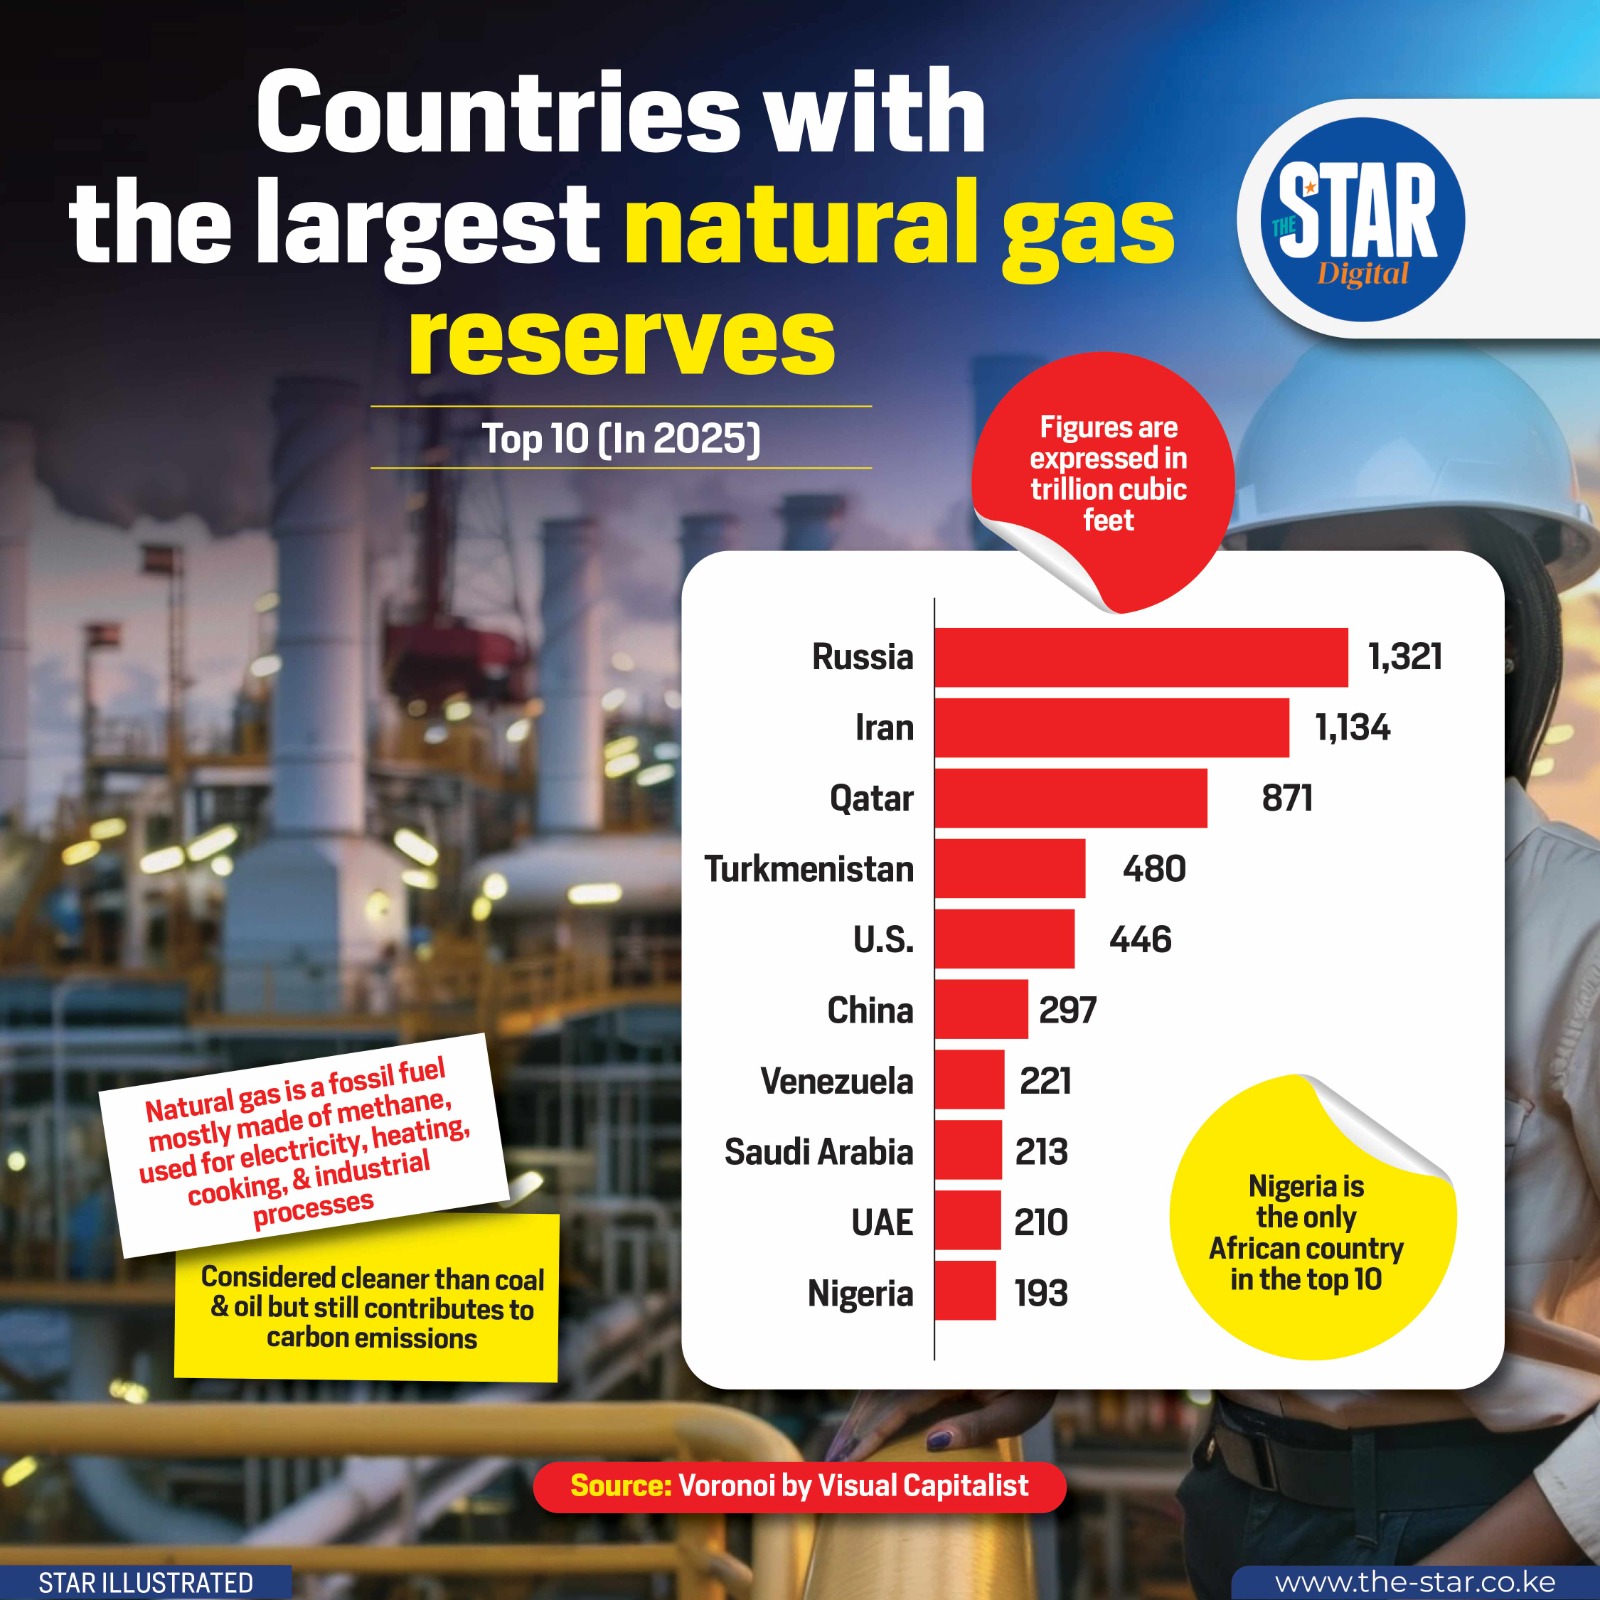
Natural gas reserves represent the estimated quantities of natural gas that geological and engineering data demonstrate with reasonable certainty to be recoverable in the future from known reservoirs under existing economic and operating conditions. As of 2026, global energy dynamics continue to hinge on these underground assets, with Russia, Iran, and Qatar dominating the list.
The assessment of natural gas reserves is a critical component of global energy security, economic planning, and geopolitical strategy. For an investor, policymaker, or curious observer, "the list" of countries by natural gas reserves is more than just a ranking; it is a snapshot of future energy potential and current industrial leverage. However, understanding this list requires a deep dive into how these figures are calculated, why they fluctuate, and the technical distinction between "proven" and "unproven" resources.
Defining "Proven" Natural Gas Reserves
To interpret any list of gas-rich nations, one must first grasp the terminology used by organizations like the Energy Institute (formerly BP) or the U.S. Energy Information Administration (EIA). Reserves are typically categorized into three tiers based on the probability of extraction:
- Proven Reserves (1P): These have a 90% or greater probability of being extracted profitably under current economic conditions and with existing technology. This is the figure most commonly used in international rankings.
- Probable Reserves (2P): These have a 50% probability of extraction. They represent gas that is likely to be recovered but carries more technical or economic risk than 1P reserves.
- Possible Reserves (3P): These have a 10% probability of extraction. These are highly speculative and rarely included in the standard "top country" lists.
The "list" we refer to globally is almost always the Proven Reserves list. It is important to note that these numbers are not static. As gas prices rise, previously "unprofitable" gas becomes "proven." Conversely, as technology improves—such as the advancements in hydraulic fracturing (fracking) seen over the last two decades—deposits once thought unreachable are added to the official tally.
The Global Leaders: A Breakdown of the Top Reserve Holders
As we look at the landscape in 2026, the distribution of natural gas remains highly concentrated. A handful of nations control the vast majority of the world’s supply, granting them significant influence over global energy markets and the transition toward lower-carbon fuels.
1. Russia
Russia consistently holds the world's largest proven natural gas reserves, estimated at over 1,600 trillion cubic feet (Tcf). Most of these reserves are concentrated in the Yamal Peninsula and the West Siberian Basin. Russia’s state-owned giant, Gazprom, manages the lion's share of these assets. Despite the geopolitical shifts of the early 2020s, Russia remains a "gas superpower" because its extraction costs are relatively low and its infrastructure, though pivoting toward Asia, remains the most extensive in the world.
2. Iran
Holding the second-largest reserves globally (roughly 1,100–1,200 Tcf), Iran’s potential is centered on the South Pars field, which it shares with Qatar. Iran’s gas is predominantly "non-associated," meaning it is found independently of oil fields. While Iran’s reserves are massive, international sanctions and a lack of investment in liquefaction technology (LNG) have historically limited its ability to export gas to the same extent as its neighbors.
3. Qatar
Qatar sits on approximately 840 Tcf of gas, nearly all of which is located in the "North Field." Unlike Russia or Iran, Qatar has successfully transformed its reserves into global market dominance by becoming the world’s leading exporter of Liquefied Natural Gas (LNG). In 2026, Qatar’s ongoing North Field Expansion projects continue to increase its capacity to move these reserves from the ground to the global market, particularly to energy-hungry markets in Europe and East Asia.
4. The United States
The U.S. presents a unique case in the list of gas reserves. While it often ranks 4th or 5th in total reserves (approx. 450–600 Tcf), it is frequently the world’s top producer. This is due to the "Shale Revolution." The U.S. has a high turnover of reserves; it finds and proves new gas almost as quickly as it extracts it. Major reserves are located in the Appalachian Basin (Marcellus Shale), the Permian Basin, and the Haynesville Shale.
5. Turkmenistan
Turkmenistan is often the "dark horse" of the energy world. It holds the Galkynysh gas field, one of the largest onshore fields globally. With reserves estimated between 350 and 600 Tcf, Turkmenistan’s primary challenge is geography. Landlocked and distant from major sea lanes, it relies heavily on pipelines to China.

Comprehensive Comparison of Top Reserve Holders
The following table provides a snapshot of the top countries by proven natural gas reserves as of the mid-2020s data cycle. Note that "Tcf" stands for Trillion Cubic Feet, and "Share of Global Total" highlights the concentration of resources.
| Country | Estimated Reserves (Tcf) | Share of Global Total (%) | Primary Region |
|---|---|---|---|
| Russia | 1,688 | 24.3% | Eurasia |
| Iran | 1,201 | 17.3% | Middle East |
| Qatar | 842 | 12.1% | Middle East |
| United States | 465 | 6.7% | North America |
| Turkmenistan | 350 | 5.0% | Central Asia |
| Saudi Arabia | 322 | 4.6% | Middle East |
| United Arab Emirates | 210 | 3.0% | Middle East |
| Nigeria | 203 | 2.9% | Africa |
| Venezuela | 197 | 2.8% | South America |
| Algeria | 159 | 2.3% | Africa |
Data based on standardized reporting from the Energy Institute and EIA for the 2024-2026 period.
Understanding Units: Tcf vs. Bcm
One of the most common points of confusion when reading lists of gas reserves is the unit of measurement. Different regions and organizations use different standards:
- Tcf (Trillion Cubic Feet): Primarily used in the United States and by many international financial analysts.
- Bcm (Billion Cubic Meters): The standard metric unit used in Europe, Asia, and by major international bodies like the International Energy Agency (IEA).
The Conversion Factor: 1 Billion Cubic Meters (Bcm) is approximately equal to 35.31 Trillion Cubic Feet (Tcf).
When comparing lists, ensure the units are consistent. For example, Russia's 47-48 trillion cubic meters (Tcm) of gas sounds much smaller than 1,688 Tcf until you apply the conversion. Always verify the unit before concluding which country has "more" gas.
Why Reserve Estimates Change Every Year
A country’s position on the list can shift without a single drill bit touching the ground. This occurs due to several factors that complicate the "Understanding" of these lists:
Economic Fluctuations
Natural gas is only a "reserve" if it can be sold for more than the cost of getting it out of the ground. If global gas prices crash, high-cost extraction projects (like deepwater drilling or complex shale formations) might be removed from the "Proven" category because they are no longer economically viable. If prices rise, those same deposits are added back to the list.
Technological Advancement
The most famous example of this is the development of horizontal drilling and hydraulic fracturing. Before 2005, much of the gas in U.S. shale formations was considered a "resource" but not a "reserve." Once the technology made extraction profitable, the U.S. reserve numbers skyrocketed. In 2026, we are seeing similar technological shifts in subsea extraction and "green" methane capture that may further alter global rankings.
Political and Regulatory Factors
In some nations, gas reserves are treated as state secrets or used as political tools. Governments may overstate reserves to attract foreign investment or understate them to manage domestic expectations. Furthermore, environmental regulations can "strand" assets. If a country passes a law banning certain types of extraction for environmental reasons, those reserves may be removed from the "Proven" list because they can no longer be legally produced.
The Role of Associated vs. Non-Associated Gas
When analyzing the list, it is helpful to distinguish between how the gas is found.
- Associated Gas: Gas that is found in the same reservoir as crude oil. Often, this gas was once flared (burned off), but it is now increasingly captured and sold. Countries like Saudi Arabia and Iraq have high levels of associated gas.
- Non-Associated Gas: Gas found in reservoirs where there is little to no oil. This is "pure" gas production. Qatar and Turkmenistan are primary examples of non-associated gas leaders.
This distinction matters because associated gas production is tied to oil production. If OPEC+ decides to cut oil production, the "associated" gas supply often drops as well, regardless of the demand for gas.
Geopolitical Implications of the Reserve List
The concentration of natural gas reserves in a few geographic "hubs" creates a complex web of dependency.
- Energy Pipelines: Russia’s reserves have historically fed Europe through a vast network of pipelines (Nord Stream, Yamal-Europe, etc.). The control of these "taps" provides significant geopolitical leverage.
- LNG Dominance: Qatar, the U.S., and Australia have pivoted toward Liquefied Natural Gas. By chilling gas to -162°C (-260°F), it turns into a liquid that can be shipped across oceans. This "untethered" gas allows countries with large reserves to sell to the highest bidder anywhere in the world, reducing the power of pipeline-based monopolies.
- Energy Transition: In 2026, natural gas is often viewed as a "bridge fuel" to move away from coal toward renewables. Countries with high reserves are positioning themselves as the reliable partners for this multi-decadal transition.
Frequently Asked Questions
Which country has the most natural gas in the world?
As of 2026, Russia holds the largest proven natural gas reserves, estimated at approximately 1,688 trillion cubic feet. This represents nearly one-quarter of the world’s known gas supply. Russia’s dominance is largely due to the massive fields in its Arctic and Siberian regions.
Is the U.S. running out of natural gas?
No. While the U.S. produces gas at a higher rate than almost any other country, its "proven reserves" have remained stable or increased over the last decade. This is because exploration and technology continue to unlock new unconventional sources (shale) that replace the gas being extracted.
How long will the world's natural gas reserves last?
At current consumption rates, the world has approximately 50 to 60 years of proven natural gas reserves. However, this "Reserves-to-Production" (R/P) ratio is a moving target. As new gas is discovered and technology improves, this timeframe often extends, even as consumption increases.
What is the difference between gas "resources" and gas "reserves"?
"Resources" refers to the total amount of gas thought to exist in the ground, regardless of whether we can get it out. "Reserves" are a much smaller subset of resources that we know exactly where they are and have the technology and money to extract them profitably right now.
Why does the Middle East have so much gas?
The Middle East, particularly the Persian Gulf, sits on a unique geological formation created millions of years ago. The Tethys Ocean once covered this area, leading to the accumulation of massive amounts of organic matter which, under specific heat and pressure conditions, turned into the world's largest oil and gas deposits.
Practical Recommendation for Further Research
When "understanding the list of countries by natural gas reserves," do not rely on a single source. Instead, cross-reference the Energy Institute’s Statistical Review of World Energy with the U.S. Energy Information Administration (EIA) international data.
If you are analyzing these numbers for investment or policy, look beyond the raw Tcf/Bcm numbers. Investigate the "Reserve-to-Production Ratio" (R/P ratio). A country like the U.S. has a lower R/P ratio (meaning they use their reserves quickly), while a country like Qatar has a very high R/P ratio (meaning their reserves will last for over a century at current rates). Understanding this "burn rate" is just as important as knowing the total volume in the ground.
Image Gallery
Select an image to open it in a new tab.
Declan O'Connor
Higher Education and Campus Culture Reporter
