How to Debug Visual Studio Projects
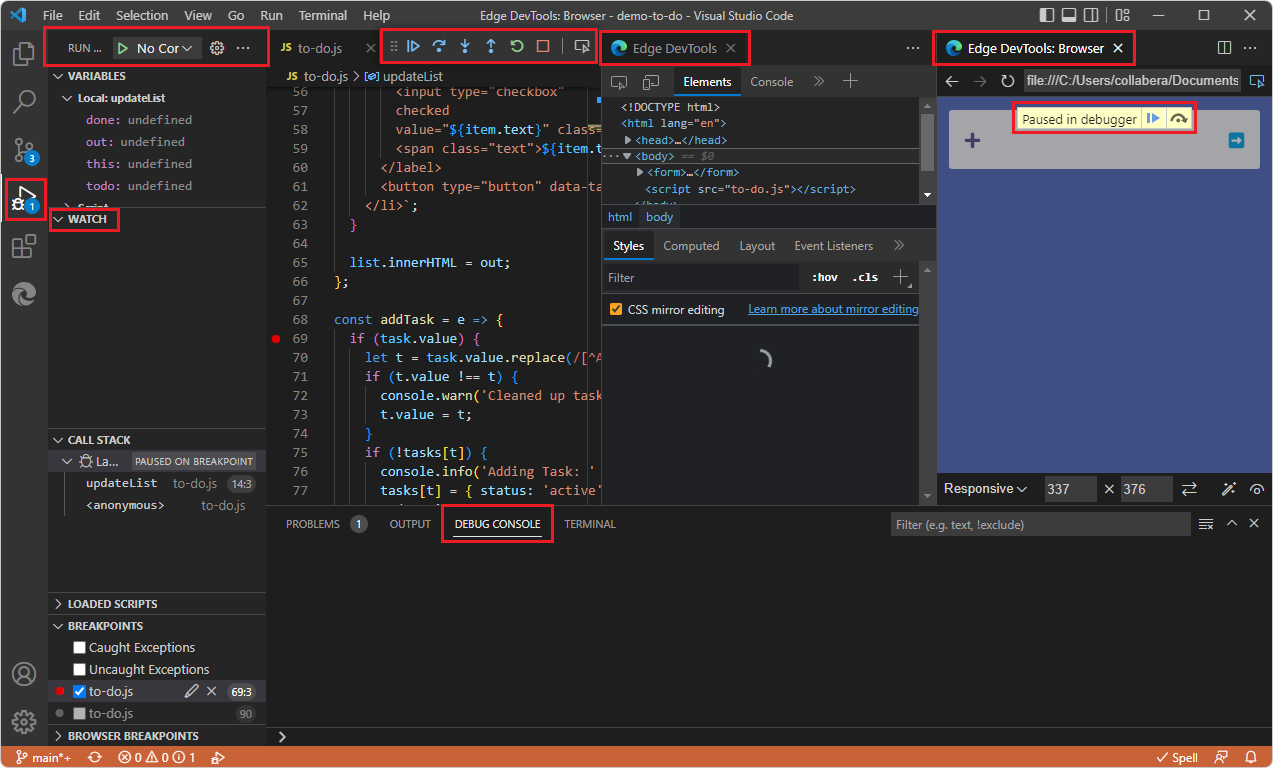
Debugging Visual Studio projects is an essential software development workflow that involves identifying, isolating, and resolving defects, logic errors, and performance bottlenecks within C#, C++, Visual Basic, and web applications. By utilizing breakpoints, watch windows, call stacks, and diagnostic tools, developers can pause execution, inspect runtime state, and trace variable mutations line by line to ensure application reliability.
Debugging Visual Studio projects requires a solid understanding of integrated development environment (IDE) configurations, symbols management, and runtime environments. Whether you are troubleshooting a null reference exception in an enterprise backend or diagnosing a memory leak in a desktop client, mastering the debugging toolset transforms hours of guesswork into a systematic, reproducible investigation.
Prerequisites and Environment Setup
Before you begin an active debugging session in Visual Studio, your project configuration must be set up properly to expose runtime details, manage symbols, and prevent compiler optimizations from obscuring variable states.
Configuring Debug vs. Release Configurations
Visual Studio manages build outputs through configurations, primarily Debug and Release.
- Debug Configuration: Disables compiler optimizations and emits full symbolic debugging information (.pdb files). This ensures that every line of source code maps directly to compiled machine instructions, allowing you to step through logic without unexpected jumps or missing local variables.
- Release Configuration: Enables aggressive compiler optimizations, loops unrolling, and variable inline expansion. While you can debug a Release build, optimized variables may be reported as unavailable or optimized out, making deep inspection significantly harder.
To verify your configuration, look at the Standard toolbar or navigate to Build > Configuration Manager. Ensure your active solution configuration is set to Debug for standard troubleshooting tasks.
Understanding Symbol Files (.pdb)
Program Database (.pdb) files store debugging information, including source file names, line numbers, and variable names. Without matching .pdb files, Visual Studio cannot map memory addresses back to your human-readable code. For third-party libraries or .NET runtime components, you can configure Just My Code under Tools > Options > Debugging > General. Enabling Just My Code instructs the debugger to automatically step over external code, keeping your call stack focused strictly on your project files.
Setting and Managing Breakpoints
Breakpoints are the foundational building blocks of interactive debugging. They tell the Visual Studio debugger to suspend execution when a specific line of code is reached.
Basic and Conditional Breakpoints
To set a basic breakpoint, click the left margin next to a line of code or press F9. When execution hits this line, the application pauses, and the line is highlighted in yellow.
For complex loops or multi-threaded applications, basic breakpoints can trigger too frequently. Conditional breakpoints allow you to specify exact criteria before execution pauses:
- Right-click an existing breakpoint red dot and select Conditions.
- Choose Conditional Expression, Hit Count, or Filter.
- Enter your logic (e.g.,
userId == 42orcounter >= 100). The debugger will only break when that specific condition evaluates to true.
Function and Data Breakpoints
- Function Breakpoints: Instead of targeting a specific line number—which can shift when code changes—you can set a breakpoint on a function name by going to Debug > New Breakpoint > Function Breakpoint. This is useful when debugging overloaded methods or library entry points.
- Data Breakpoints: Available primarily for native C++ projects or .NET applications with specific memory settings, data breakpoints pause execution when the value of a specific memory address or global variable changes.
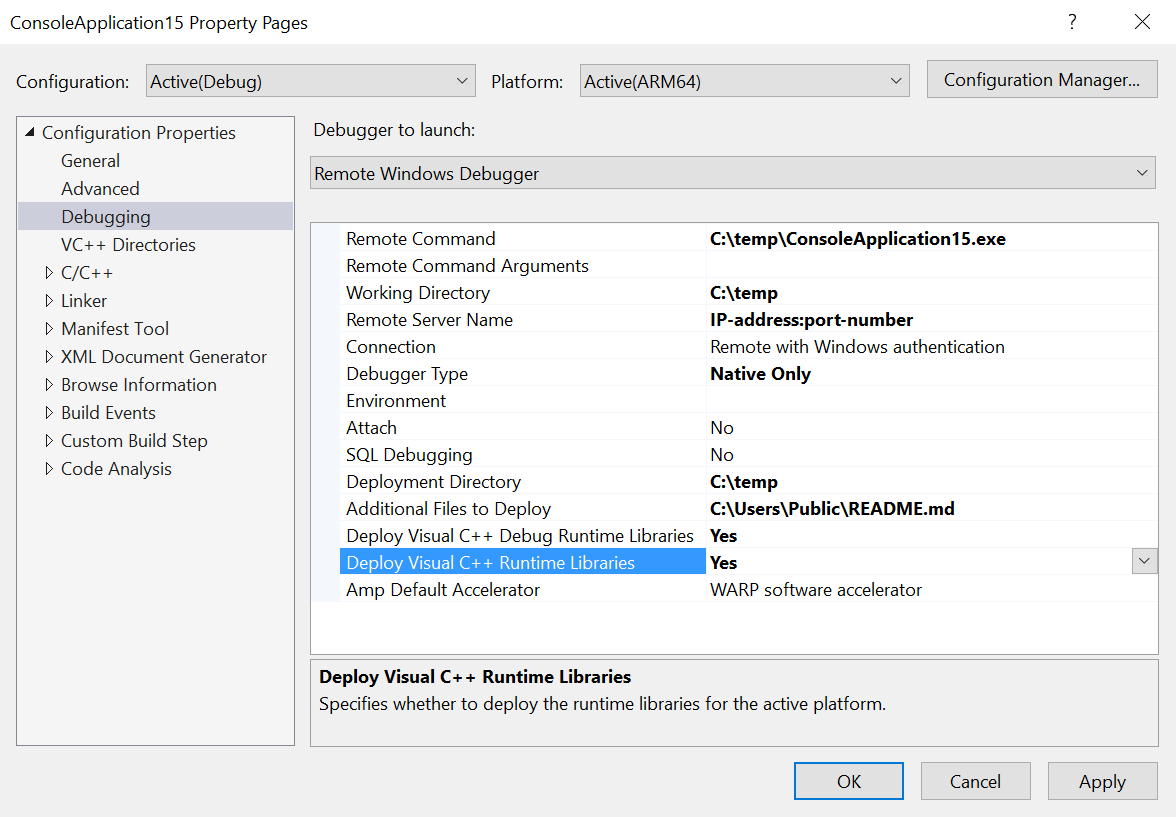
Navigating Code Execution in Real Time
Once a breakpoint halts execution, you enter break mode. At this stage, you control the flow of execution using dedicated keyboard shortcuts and toolbar commands.
Execution Control Options
| Action | Shortcut | Description |
|---|---|---|
| Continue | F5 |
Resumes running the application until the next breakpoint is hit or the app exits. |
| Step Over | F10 |
Executes the next line of code as a single block. If the line contains a function call, it does not enter the function. |
| Step Into | F11 |
Steps directly into the function call on the current line, allowing you to debug inside external or user-defined methods. |
| Step Out | Shift + F11 |
Finishes executing the current function and breaks immediately after returning to the calling method. |
| Run to Cursor | Ctrl + F10 |
Executes code continuously from the current execution pointer down to the line where your text cursor is placed. |
These commands allow you to isolate anomalies down to a single instruction. If a method behaves unexpectedly, using F11 (Step Into) helps you track the inputs as they cross method boundaries.
Inspecting Runtime State and Variables
Pausing execution is only useful if you can inspect what is happening inside the application's memory space. Visual Studio provides multiple specialized windows for this purpose.
Locals, Autos, and Watch Windows
- Locals Window: Automatically displays all variables declared within the current scope along with their types and values. As you step through code, modified variables flash in red to highlight recent state changes.
- Autos Window: Displays variables used in the current line and the immediately preceding line, attempting to predict what data is relevant to your current instruction.
- Watch Windows: Allow you to type custom expressions, property paths, or LINQ queries to monitor their evaluated values across execution steps. You can pin frequently checked watch items directly to the source code editor as Data Tips.
The Immediate Window and Object ID Assignment
If you need to execute ad-hoc methods or evaluate complex LINQ statements without altering your source code, open the Immediate Window (Ctrl + Alt + I). You can type C# expressions directly, query object collections, or modify variable values on the fly.
If you are dealing with complex object graphs and need to track a specific instance across multiple methods, right-click the object in a watch window and select Make Object ID. Visual Studio assigns an identifier like $1, which remains valid throughout the debugging session even if the variable goes out of scope.
Advanced Debugging Techniques
When basic breakpoints and variable inspection are insufficient, Visual Studio provides enterprise-grade tools to diagnose deeply hidden defects.
Exception Settings
Uncaught exceptions can crash applications abruptly. You can configure Visual Studio to break execution the exact moment an exception is thrown, long before it bubbles up to a catch block.
- Open Debug > Windows > Exception Settings (
Ctrl + Alt + E). - Expand categories such as Common Language Runtime Exceptions or C++ Exceptions.
- Check specific exception types (e.g.,
System.NullReferenceException) to force the debugger to break when that exception occurs.
Diagnostic Tools and Performance Profiling
During debugging sessions, the Diagnostic Tools window opens automatically on the right side of the IDE, displaying real-time graphs for CPU Usage and Memory Usage.
- CPU Usage: Helps you identify performance bottlenecks by recording a function call tree and measuring execution time percentages.
- Memory Usage: Allows you to take memory snapshots, compare heap allocations between two points in time, and track down memory leaks or unmanaged resource retention.
Common Debugging Mistakes and Troubleshooting
Even experienced developers encounter friction when setting up debugging environments. Avoiding common pitfalls saves hours of troubleshooting.
Debugging Optimized Release Builds
If your breakpoints show hollow red circles with warning messages stating that "The breakpoint will not currently hit. No symbols have been loaded for this document," you are likely attempting to debug an optimized binary or missing matching .pdb files. Always verify that your build configuration matches the output files loaded by the process.
Attached Processes and Permissions
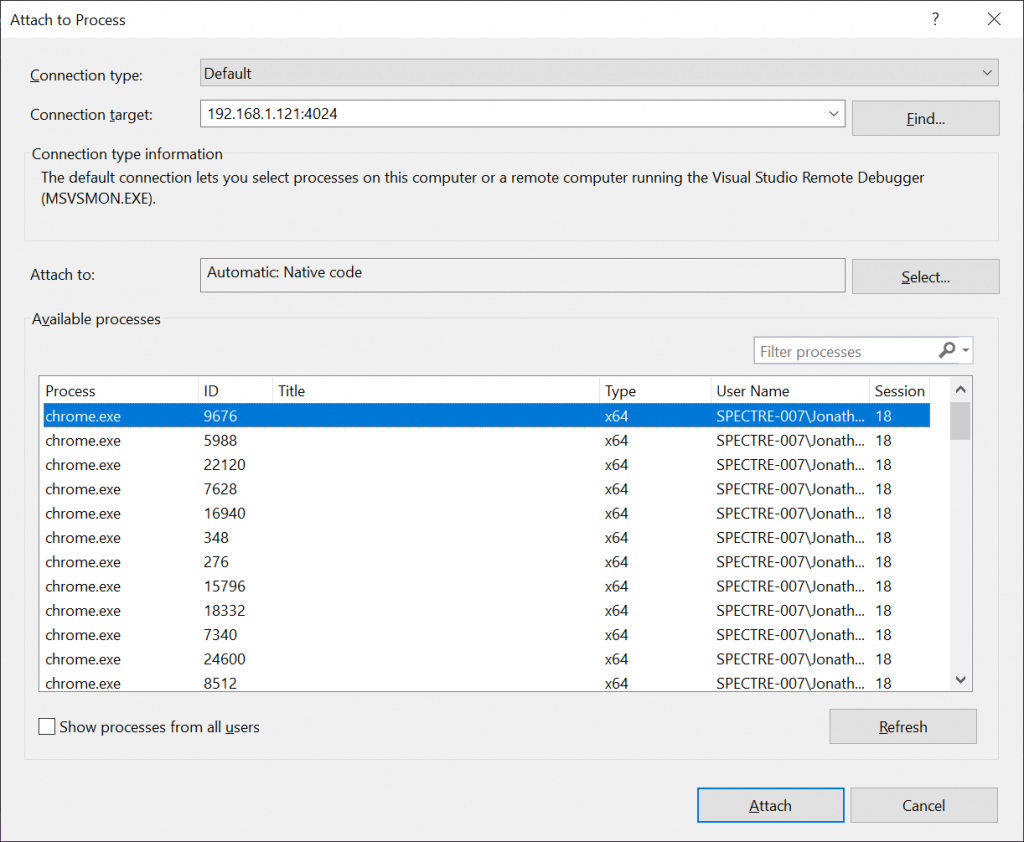
When debugging web applications, microservices, or Windows services, you may need to attach the Visual Studio debugger to an already running process using Debug > Attach to Process (Ctrl + Alt + P). Ensure that you are running Visual Studio with administrative privileges if you are attempting to debug processes owned by system accounts or Internet Information Services (IIS) application pools.
Frequently Asked Questions
Why are my breakpoints not hitting in my Visual Studio project?
Breakpoints often fail to hit due to mismatched source code and compiled binaries, running a Release build instead of a Debug build, or missing .pdb symbol files. Ensure your project is rebuilt entirely via Build > Rebuild Solution and verify that Just My Code settings are configured correctly for your environment.
How can I debug asynchronous and multithreaded code effectively?
Visual Studio includes specialized windows such as Threads (Ctrl + Alt + J) and Parallel Stacks (Ctrl + Shift + D, S). These tools allow you to freeze, thaw, and switch execution contexts between different operating system threads or task-based asynchronous operations (async/await).
What is the difference between Step Over and Step Into?
Step Over (F10) executes the current line of code as a single operation without looking inside called functions. Step Into (F11) enters the function called on that line so you can trace execution inside external or custom methods line by line.
Can I change variable values while debugging is paused?
Yes. You can directly edit values inside the Locals, Autos, or Watch windows by double-clicking the value field and typing a new value. Alternatively, you can use the Immediate Window to assign new states to objects before resuming execution.
How do I debug code running inside a Docker container or remote server?
Visual Studio supports remote debugging and containerized workflows. You can configure Docker Compose as your startup project or use the Remote Tools for Visual Studio package to attach the debugger to a remote Linux or Windows server securely over TCP/IP.
Conclusion and Next Actions
Mastering the debugging tools inside Visual Studio dramatically accelerates software delivery by replacing manual print-statement tracing with precise runtime inspection. To refine your skills further, practice setting conditional breakpoints on complex loops, explore memory heap snapshots to eliminate leaks, and experiment with exception settings to catch runtime errors at their source.
Image Gallery
Select an image to open it in a new tab.
Akira Tanaka
International Academic Trends Correspondent
