Cloud native observability for security bridges the gap between traditional runtime monitoring and modern threat detection by combining metrics, logs, and traces (the three pillars of observability) with continuous behavioral analysis to identify sophisticated vulnerabilities and unauthorized access in containerized, microservices-based architectures.
Cloud native architectures—characterized by ephemeral containers, complex Kubernetes orchestrations, service meshes, and dynamic serverless functions—have fundamentally altered the threat landscape. Traditional security information and event management (SIEM) systems and perimeter-based firewalls often fail to capture the transient, distributed context of modern applications. To maintain robust security posture management and rapid incident response, organizations must look beyond traditional logging and embrace observability for security in cloud native environments. This paradigm shift merges operational telemetry with security analytics, transforming raw operational data into actionable security insights.
The Evolution of Cloud Native Security and Observability
Historically, information security relied heavily on static boundaries, perimeter defenses, and signature-based detection mechanisms deployed on monolithic servers or virtual machines. These legacy approaches assumed a clear distinction between internal and external networks, treating infrastructure as stable and long-lived.
In contrast, cloud native ecosystems are ephemeral. Containers spin up and tear down within seconds, workloads scale automatically across multi-cloud clusters, and communication between microservices occurs over encrypted internal networks (service meshes). In this dynamic environment, a security alert stating that an IP address performed an unauthorized action lacks sufficient context if the underlying container has already terminated.
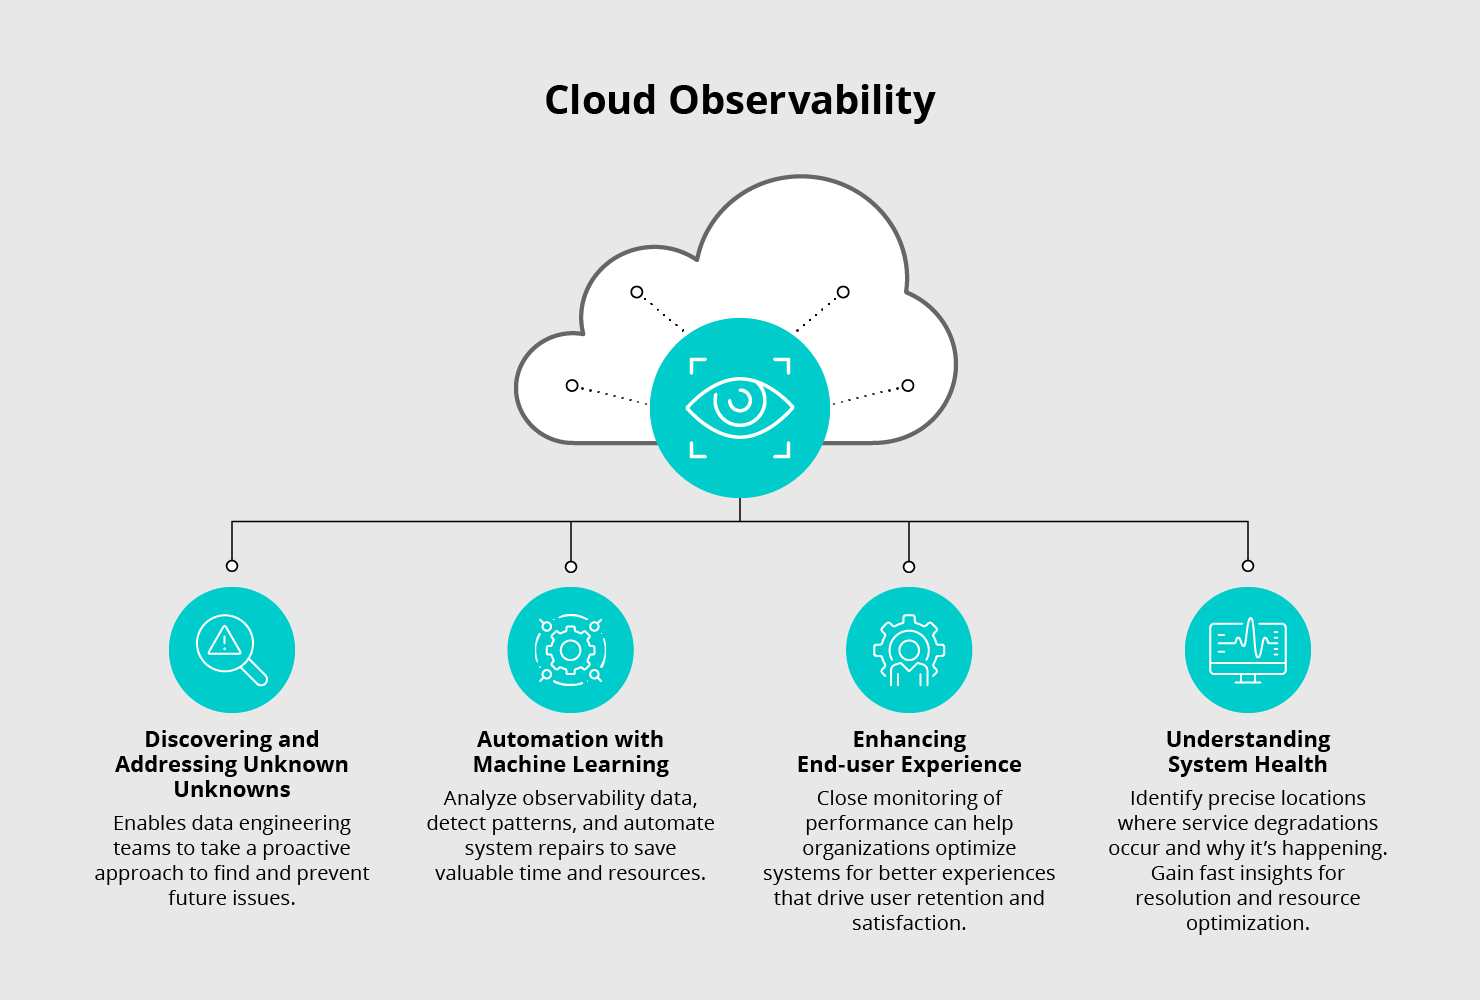
Observability solves this visibility gap by capturing deep runtime context. While monitoring answers the question "Is the system working correctly?", observability asks "Why is the system behaving this way?" When applied to security, observability provides the granular telemetry required to reconstruct multi-step attack chains across distributed services. By leveraging high-cardinality metrics, structured JSON logging, and distributed tracing, security teams can inspect internal application states without modifying code, detecting anomalies such as privilege escalation, unauthorized API access, and lateral movement in real time.
Core Pillars of Cloud Native Security Telemetry
To secure distributed, containerized workloads effectively, security observability platforms ingest and correlate three primary types of telemetry data, supplemented by eBPF (Extended Berkeley Packet Filter) technology for kernel-level visibility.
- Cloud Native Telemetry Sources
- Metrics
- Logs
- Traces
- eBPF Kernel-Level Analysis
- Security Analytics Engine
Metrics, Logs, and Traces in Security Contexts
- Metrics: Aggregated numerical data (e.g., CPU utilization, memory consumption, HTTP error rates) reveal performance degradation that often signals a denial-of-service (DoS) attack, resource hijacking (such as cryptomining), or a brute-force authentication attempt.
- Logs: Immutable event records generated by applications, orchestrators, and operating systems. In cloud native environments, structured logs capture critical security events like failed login attempts, configuration changes, and policy violations.
- Traces: Distributed tracing records the end-to-end journey of a request across multiple microservices. From a security perspective, traces reveal unintended data exfiltration pathways, SSRF (Server-Side Request Forgery) vulnerabilities, and unauthorized service-to-service communication.
The Role of eBPF in Modern Runtime Security
Extended Berkeley Packet Filter (eBPF) has revolutionized cloud native observability and security. By safely running sandboxed programs directly within the Linux kernel without changing kernel source code or loading kernel modules, eBPF captures system calls, network packets, and socket operations with minimal performance overhead. Security tools utilize eBPF to monitor process execution, file integrity, and network connections at the kernel level, catching malicious behavior even if container runtimes or application layers are compromised.
Key Capabilities and Use Cases
Integrating observability into cloud native security strategies unlocks specific defensive capabilities that safeguard modern infrastructure against advanced threats.
Runtime Threat Detection and Behavioral Analysis
Cloud native threats often manifest as subtle behavioral anomalies rather than known malicious signatures. Observability platforms establish baselines of normal application behavior—such as standard network egress destinations, expected file system access patterns, and typical system call frequencies. When a container deviates from these baselines (for instance, spawning an unexpected shell or initiating outbound connections to an unknown external server), the observability pipeline generates a high-fidelity alert.
Vulnerability Management and Container Image Scanning
Security observability extends into the CI/CD pipeline and runtime environments to track software supply chain integrity. By continuously correlating runtime container behavior with Software Bill of Materials (SBOM) data, teams can determine whether a vulnerable software library loaded into memory is actively exposed to network traffic, allowing them to prioritize patching based on actual risk rather than theoretical CVSS scores.
Identity and Access Management (IAM) Auditing
In cloud native architectures, service accounts, Kubernetes roles (RBAC), and cloud provider IAM policies govern access. Observability tools monitor the usage of these identities, detecting over-permissioned service accounts, anomalous token usage, and unauthorized privilege escalation attempts across microservices.
Comparing Traditional SIEM and Cloud Native Observability
Organizations often struggle to decide whether to route cloud native telemetry into traditional Security Information and Event Management (SIEM) tools or specialized cloud native observability platforms. The table below outlines key operational differences.
| Feature / Dimension | Traditional SIEM | Cloud Native Observability Platform |
|---|---|---|
| Data Sources | Firewall logs, OS logs, active directory events, appliance alerts. | Metrics, logs, distributed traces, eBPF kernel telemetry, Kubernetes audit logs. |
| Architecture | Centralized, batch-oriented ingestion; optimized for compliance reporting. | Distributed, real-time streaming; optimized for microservices and ephemeral workloads. |
| Contextual Depth | Surface-level infrastructure and network perimeter events. | Deep application code execution paths, inter-service dependencies, and runtime state. |
| Overhead | Can introduce high storage and licensing costs due to raw log volume. | Balances cost and retention by utilizing metrics and traces alongside selective logging. |
| Primary Focus | Post-incident forensic analysis and compliance auditing. | Shift-left security, real-time anomaly detection, and rapid root-cause analysis. |
Implementation Challenges and Operational Hurdles
Deploying observability for security in complex cloud native environments introduces distinct engineering challenges that teams must navigate to achieve success.
Data Overload and Alert Fatigue
The sheer volume of telemetry generated by thousands of microservices can overwhelm security operations centers (SOCs). Without intelligent filtering, deduplication, and contextual correlation, security teams face severe alert fatigue, increasing the risk of missing critical incidents. Organizations must implement robust data reduction strategies, such as tail-based sampling for traces and intelligent anomaly scoring, to surface actionable intelligence.
Performance Overhead
While eBPF and advanced telemetry collection agents are lightweight, deploying multiple monitoring agents across every node in a Kubernetes cluster can consume measurable CPU and memory resources. Engineering teams must carefully tune instrumentation parameters and resource limits to ensure that security tooling does not degrade application performance or destabilize the underlying cluster.
Privacy and Regulatory Compliance
Cloud native applications frequently process sensitive customer data, personally identifiable information (PII), and financial records. Because observability platforms aggregate logs and traces that may inadvertently capture payload data, organizations must enforce strict data masking, tokenization, and encryption-at-rest policies to comply with regulations such as GDPR, HIPAA, and PCI-DSS.
Best Practices for Building a Secure Observability Pipeline
Achieving comprehensive security observability requires a deliberate, phased approach that aligns engineering and security teams (DevSecOps).
- Adopt a Unified Telemetry Strategy: Break down silos between DevOps and security teams by utilizing shared observability pipelines. Standardize on open standards like OpenTelemetry to collect metrics, logs, and traces without vendor lock-in.
- Implement Guardrails in the CI/CD Pipeline: Integrate security observability checks early in the software development lifecycle. Scan infrastructure-as-code (IaC) templates, container images, and Kubernetes manifests before deployment to production environments.
- Leverage Ephemeral Workload Context: Ensure that security alerts retain metadata regarding the ephemeral container, Kubernetes namespace, pod name, and deployment pipeline associated with the event, enabling rapid triage.
- Tune Detection Rules Continuously: Regularly review anomaly detection thresholds and custom security rules against real-world threat intelligence to reduce false positives and adapt to evolving application architectures.
- Secure the Observability Pipeline Itself: Protect the telemetry data stream in transit and at rest. Ensure that access to observability dashboards and underlying storage backends is strictly governed by multi-factor authentication and strict role-based access control.
Frequently Asked Questions
How does observability differ from monitoring in cloud native security?
Monitoring tells you when a system fails or encounters an error by tracking predefined thresholds. Observability enables you to understand why the failure or security breach occurred by providing deep internal visibility into metrics, logs, and distributed traces across complex microservices without requiring prior knowledge of the failure mode.
Why is eBPF essential for cloud native security observability?
eBPF allows security tools to inspect kernel-level events, system calls, and network traffic safely and efficiently without modifying the kernel or application code. This provides tamper-resistant runtime visibility into container behavior that traditional application-layer logging cannot capture.
Can observability tools replace a traditional SIEM?
Not entirely. While cloud native observability platforms excel at real-time runtime threat detection, microservices debugging, and container telemetry, traditional SIEM systems are often still required for long-term compliance archiving, cross-domain enterprise auditing, and integrating non-cloud data sources like corporate endpoints.
How does OpenTelemetry contribute to cloud native security?
OpenTelemetry provides a vendor-neutral standard for collecting and exporting telemetry data (metrics, logs, and traces). By standardizing data collection, organizations can avoid vendor lock-in and feed consistent, high-quality telemetry into both observability backends and security analytics tools.
What is the impact of observability on cloud application performance?
When properly configured, modern observability tools—particularly those leveraging eBPF—introduce minimal performance overhead (typically less than 1-3% CPU utilization). However, improper configuration, such as excessive payload logging or aggressive full-trace sampling, can impact application latency and increase storage costs.
Conclusion and Next Actions
Implementing observability for security in cloud native environments is no longer optional for organizations scaling modern microservices architectures. By combining the three pillars of telemetry with kernel-level eBPF insights and behavioral analytics, security teams can transcend the limitations of legacy perimeter defenses. To begin, audit your current telemetry collection tools, establish OpenTelemetry standards across your container fleets, and collaborate with DevOps engineers to integrate runtime security observability into your deployment pipelines.
Image Gallery
Select an image to open it in a new tab.




Simon Caldwell
Enterprise Technology and Systems Editor
