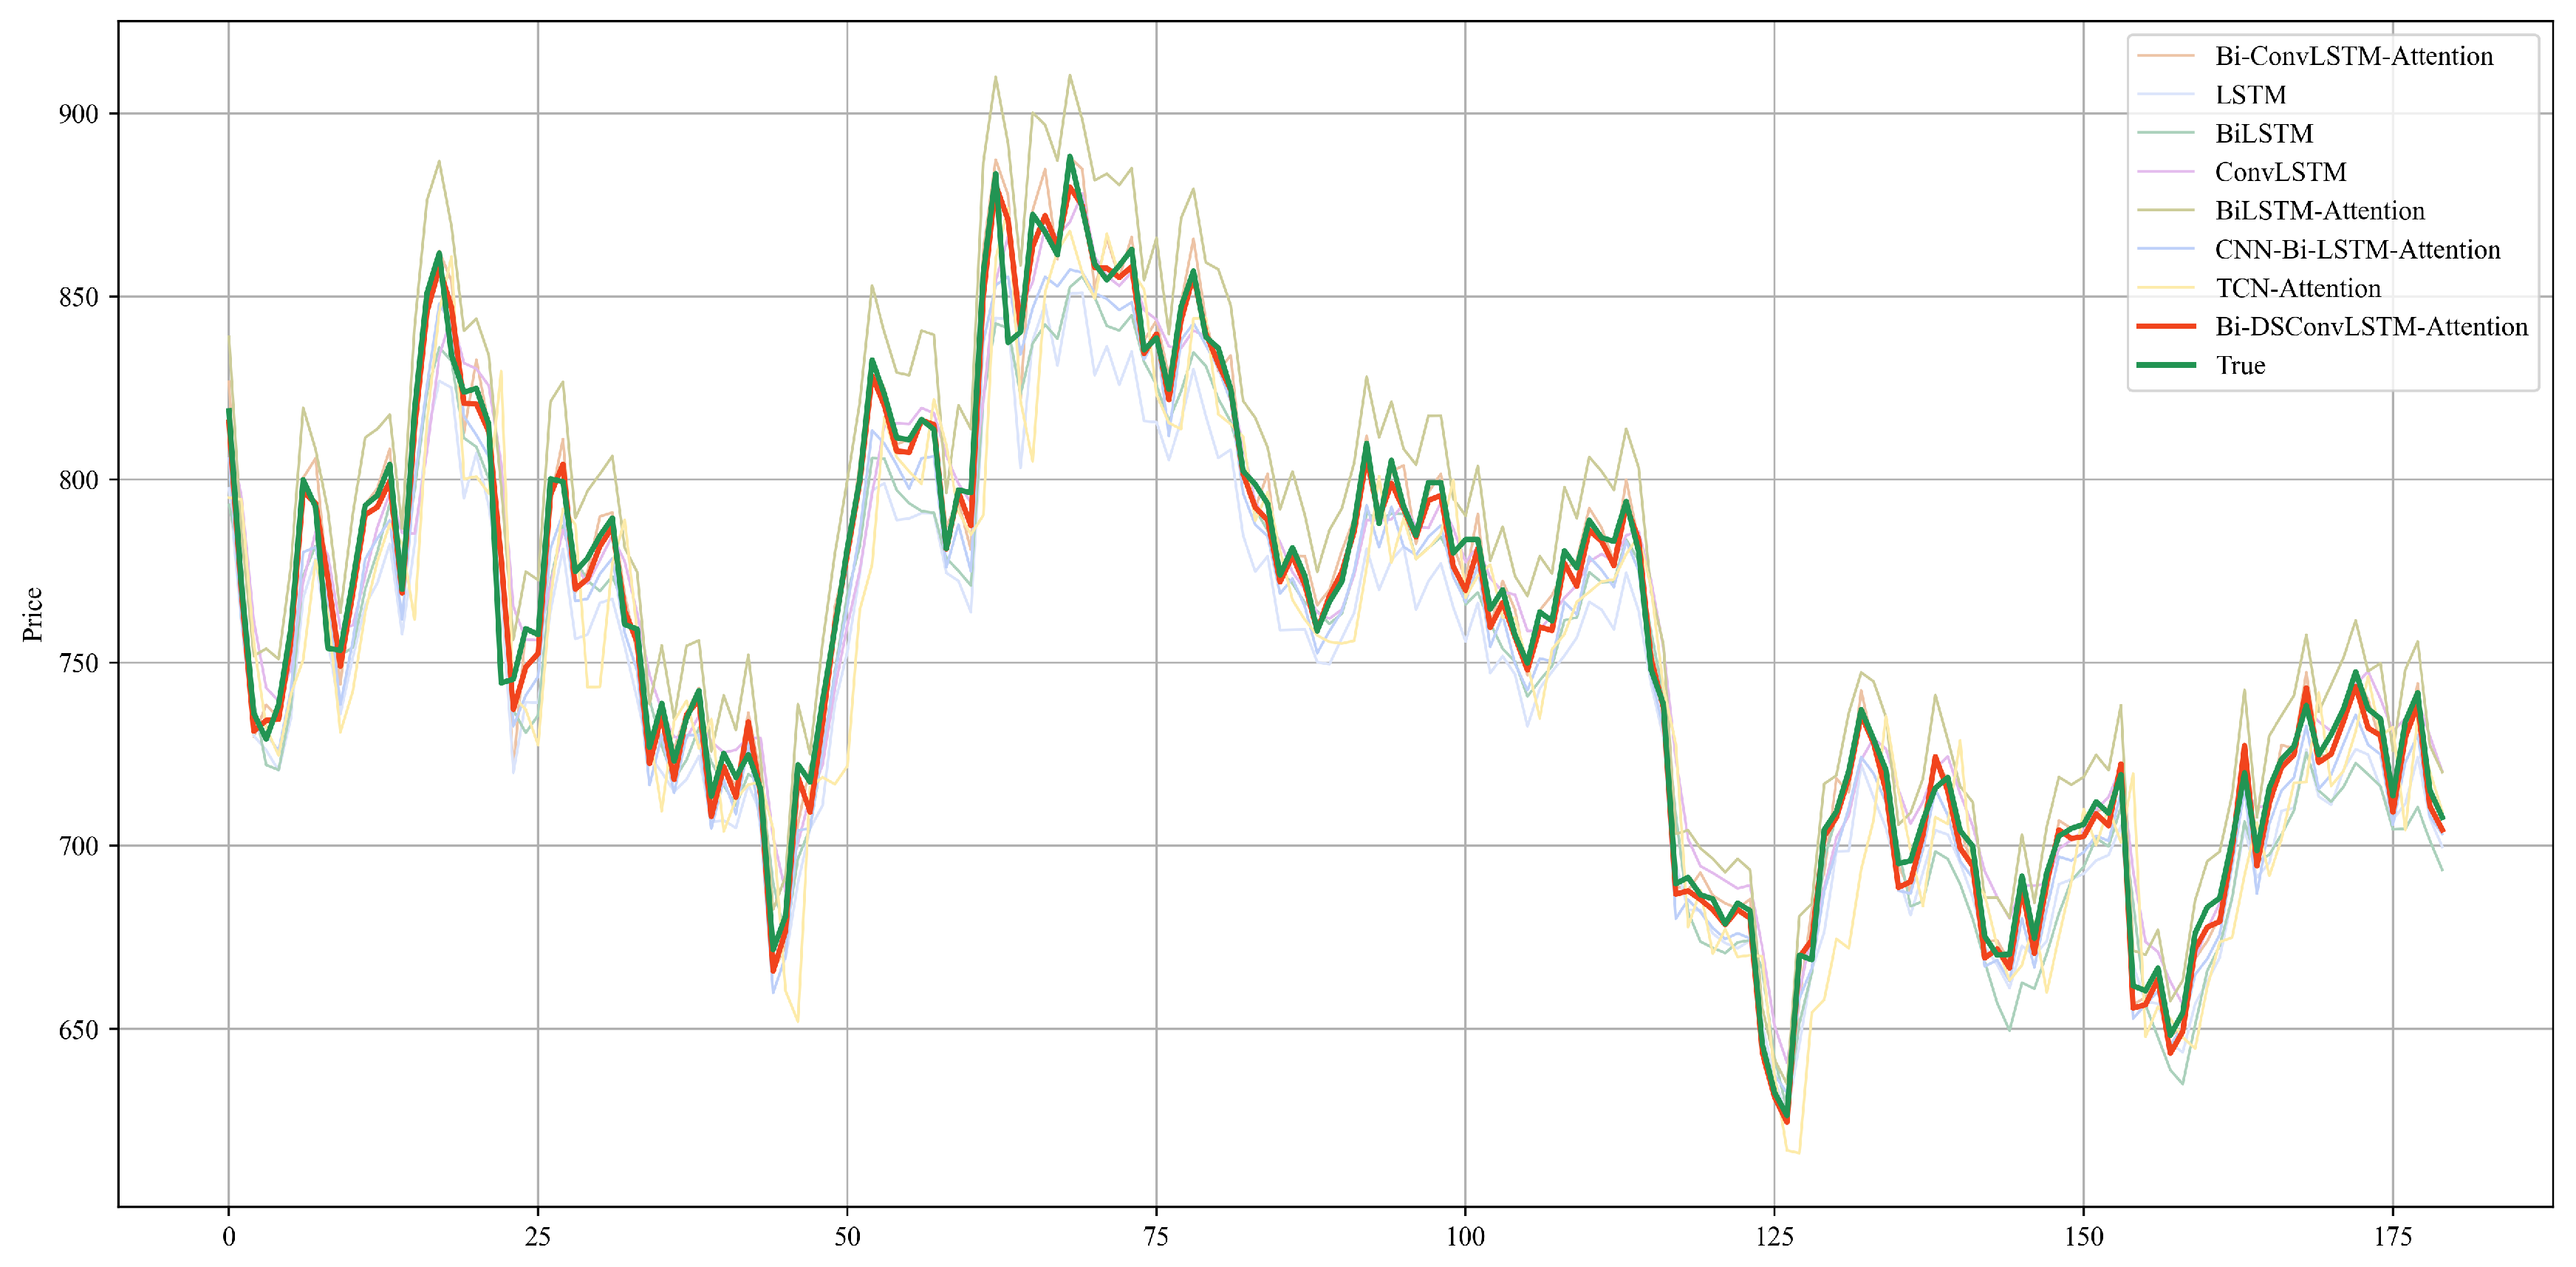
Understanding grain futures charts requires more than just identifying price direction; it involves interpreting the interplay between supply, demand, seasonality, and the technical mechanisms of exchange-traded contracts. Grain charts—covering commodities like corn, soybeans, wheat, and oats—provide a visual representation of market sentiment, price history, and volatility, serving as an essential tool for producers, commercial hedgers, and speculators aiming to navigate the complexities of agricultural markets in 2026.
The Role of Grain Futures in Global Markets
Grain futures are standardized legal contracts to buy or sell a specific quantity of a physical grain at a predetermined price on a future date. These contracts are traded on regulated exchanges, such as the Chicago Board of Trade (CBOT), a division of the CME Group. Because these products are standardized by grade, quantity, and delivery month, they are highly liquid, allowing for efficient price discovery.
When you look at a grain futures chart, you are witnessing the collective consensus of thousands of participants—farmers hedging their harvest, grain elevators managing storage, and institutional investors analyzing global crop data. Unlike equity markets, where prices often reflect company earnings and growth expectations, grain prices are anchored by the physical reality of the agricultural cycle, weather patterns, and the logistical challenges of moving bulk commodities.
Anatomy of a Grain Futures Chart
To read a grain futures chart effectively, one must understand its structural components. The most common format is the candlestick chart, which provides four critical data points for any given time interval: the Open, High, Low, and Close (OHLC).
- Open: The price at which the first trade occurred during the specified interval.
- High: The highest price reached during that interval.
- Low: The lowest price reached during that interval.
- Close: The final price at which the contract traded before the interval ended.
In a traditional color-coded chart, a green (or white) candlestick indicates that the closing price was higher than the opening price, signaling buying pressure. A red (or black) candlestick shows the close was lower than the open, signaling selling pressure. The vertical lines extending from the body of the candle, known as "wicks" or "shadows," represent the range of prices that were traded but ultimately rejected by the market.
Contract Expiration and Rollover
A unique feature of commodity charts compared to stock charts is the concept of expiration. A single grain futures contract does not trade indefinitely. For example, a "December Corn" contract ceases to exist after its expiration date. To maintain a long-term view of price history, platforms use "continuous contracts." These are stitched-together series of individual monthly contracts. Traders must be aware of the "rollover" period, where liquidity shifts from the front-month contract to the next active delivery month, as this can sometimes cause minor gaps in price data.
Fundamental Drivers Visible on Charts
While technical analysis focuses on price movement, understanding why those movements happen is vital for interpreting the chart correctly. Several factors influence these visual patterns:
- Seasonality: Grain markets follow predictable cycles based on planting, growing, and harvest periods. Charts often show patterns that repeat annually. For instance, prices may experience downward pressure during the harvest months when supply is at its peak.
- Weather Reports: Unexpected shifts in weather patterns—droughts in Brazil or excessive rain in the U.S. Midwest—can cause sharp, vertical spikes on a chart, indicating a sudden revaluation of supply expectations.
- Government Reports: The United States Department of Agriculture (USDA) releases the World Agricultural Supply and Demand Estimates (WASDE) report monthly. These reports are major catalysts for volatility, often appearing on charts as "gaps" or massive intraday ranges immediately following the release.
Technical Indicators for Agricultural Commodities
Traders often overlay mathematical tools on their charts to filter out "market noise" and identify trends. The following indicators are frequently utilized in grain analysis:
- Moving Averages (MA): By smoothing out price data, the 50-day and 200-day simple moving averages help identify the underlying trend. If the current price is consistently above the 200-day MA, the market is generally considered to be in a long-term uptrend.
- Relative Strength Index (RSI): This momentum oscillator measures the speed and change of price movements. An RSI above 70 suggests the commodity may be "overbought," while an RSI below 30 suggests it may be "oversold."
- Volume and Open Interest: Volume tracks the number of contracts traded in a specific timeframe. Open Interest is the number of contracts currently held by participants that have not been offset. A price increase accompanied by rising Open Interest suggests strong trend confirmation, whereas a price increase with falling Open Interest may signal a weak move.
Comparison of Analysis Approaches
| Approach | Focus | Primary Goal | Use Case |
|---|---|---|---|
| Technical | Historical Price & Volume | Identifying trend reversals/continuations | Tactical entry and exit timing |
| Fundamental | Supply, Demand & Weather | Determining "fair value" | Long-term strategy and hedging |
| Seasonal | Historical Calendar Trends | Anticipating cyclical shifts | Strategic inventory management |
Practical Steps to Interpreting a Chart
When you open a trading platform in 2026, follow this systematic approach to evaluate any grain chart:
- Identify the Trend: Look at the chart on a higher timeframe (e.g., Weekly or Daily) first. Are the peaks and troughs heading upward, downward, or moving sideways?
- Locate Support and Resistance: Draw horizontal lines at previous highs (resistance) and lows (support). These levels often serve as "psychological barriers" where market participants have historically stepped in to buy or sell.
- Assess Volume: If the price is breaking through a resistance level, look at the volume. If volume is low during the breakout, the move may lack conviction. High volume during a breakout suggests institutional participation.
- Check the Calendar: Cross-reference the current date against the typical agricultural cycle. Does the price movement align with seasonal norms, or is there an outlier event occurring?
Common Mistakes for Beginners
One of the most frequent errors for those new to grain futures is ignoring the difference between "Cash" and "Futures" prices. A futures chart represents the price of a contract for future delivery; it may diverge from the physical cash price at local elevators due to the "basis"—the difference between the cash price and the futures price. Relying solely on a futures chart to determine local market conditions can lead to inaccurate risk management.
Another common mistake is over-reliance on a single indicator. Indicators are derivatives of price and volume; they are lagging by nature. Using a "holy grail" indicator to predict the future is a fallacy. Instead, treat indicators as tools to confirm or question your hypothesis derived from price action.
Managing Risk Through Charts
Charts are ultimately a risk management tool. By identifying where support levels are, a farmer or trader can set "stop-loss" orders to automatically exit a position if the market moves against them beyond a certain point. This prevents small, manageable losses from ballooning into account-draining events. Always ensure that your chart settings match your time horizon. A day trader focusing on 5-minute charts will have a completely different risk profile than a commercial hedger looking at monthly charts to protect a seasonal crop.
Frequently Asked Questions
Why do grain futures prices move so sharply in a single day? Grain markets are sensitive to "news shocks," particularly regarding weather and policy. Because the market is global, a report on export demand or a sudden change in yield estimates can force all participants to re-evaluate the total available supply simultaneously, leading to rapid price adjustments.
What is the difference between a "long" and "short" position on a chart? Being "long" means you have purchased a contract, expecting the price on the chart to move upward. Being "short" means you have sold a contract you do not yet own, expecting the price on the chart to move downward. Both positions can be managed using the same technical tools.
How do I find reliable grain futures data in 2026? Most reputable brokerage platforms provide real-time data from the CME Group. Avoid using delayed data for active trading, as the discrepancy between real-time and delayed pricing can be significant during periods of high volatility.
Can I use the same technical analysis for corn as I do for gold? While the basic concepts of trends and support/resistance are universal, the drivers are different. Grain markets have distinct seasonal components and physical storage costs (carry) that are less relevant to non-perishable assets like gold. Adjust your analysis to account for the unique agricultural cycle of the specific grain.
What is "basis," and why is it not on my futures chart? Basis is the difference between the local cash price and the nearest futures contract price. It is determined by local supply, demand, and storage availability. Since it is geographically specific, it cannot be captured in a standardized futures chart, which reflects the global exchange price.
Next Steps for Market Analysis
If you intend to use grain futures charts for decision-making, start by observing the markets without executing trades. Practice identifying support and resistance levels on a paper-trading account. Monitor the USDA WASDE reports and observe how the market reacts on your charts immediately following the release. By correlating these fundamental events with visual price movements, you will develop the "chart intuition" necessary to navigate agricultural markets effectively. Ensure you have a clear plan for your position sizing and stop-loss placement before committing capital to the market.
Image Gallery
Select an image to open it in a new tab.


Mateo Castillo
Decentralized Finance and E-Payments Strategist
