A Prudential life insurance illustration is a detailed, multi-page financial projection document provided by Prudential Financial that outlines how a permanent life insurance policy is expected to perform over time based on specific assumptions regarding interest rates, mortality charges, and premium payments.
Navigating the complexities of permanent life insurance can be an intimidating task, particularly when you are handed a stack of financial projections that look more like an actuary's spreadsheet than a consumer contract. When purchasing permanent coverage from Prudential—such as universal life, indexed universal life, or whole life insurance—an insurance illustration is one of the most critical documents you will encounter. However, these documents are frequently misunderstood, often leading to unrealistic expectations about future policy values, cash accumulation, and out-of-pocket costs.
Understanding how to read, interpret, and critically evaluate a Prudential life insurance illustration empowers you to make informed decisions about your financial future, distinguish between guaranteed and non-guaranteed elements, and ensure your policy aligns with your long-term wealth protection goals.
What Is a Life Insurance Illustration?
At its core, a life insurance illustration is a mathematical model generated by an insurance carrier to demonstrate how a policy’s values might evolve over time. It is important to recognize that an illustration is not a contract, nor is it a guarantee of future performance. Instead, it is an educational projection designed to show policy mechanics under a distinct set of economic scenarios.
When you request an illustration from a financial professional representing Prudential, the software runs algorithms based on your age, health rating, coverage amount, and premium payment schedule. The resulting document typically spans anywhere from 10 to over 30 pages, filled with columns of numbers detailing death benefits, cash surrender values, premium outlays, and policy charges year by year.
The Purpose of the Document
The primary regulatory and consumer-protection purpose of an illustration is transparency. Insurance regulators require carriers to provide these documents so buyers can see the inner workings of complex permanent policies before committing capital. An illustration breaks down where your premium dollars go, separating the cost of insurance (the pure mortality risk) from the amounts allocated to cash value accumulation and carrier administrative fees.
Guaranteed Versus Non-Guaranteed Elements
The single most important division within any Prudential life insurance illustration is the line between guaranteed and non-guaranteed columns.
- Guaranteed Elements: These are the minimum values the insurance company is legally obligated to provide under the worst-case scenario permitted by the policy contract. They assume maximum allowable expense charges, minimum interest crediting rates, and maximum mortality costs.
- Non-Guaranteed Elements: These projections reflect the current scale of interest rates, dividend scales (if applicable), and expense charges levied by Prudential. Because economic conditions fluctuate, these figures can and do change over time. If current interest rates drop, your actual policy performance will trend closer to the guaranteed column; if market conditions improve or remain stable, performance may track closer to the non-guaranteed projections.
Core Components of a Prudential Illustration
A standard Prudential illustration is organized into several distinct sections. While the sheer volume of data can be overwhelming, focusing on specific key sections will clarify how the policy functions.
1. The Summary Page
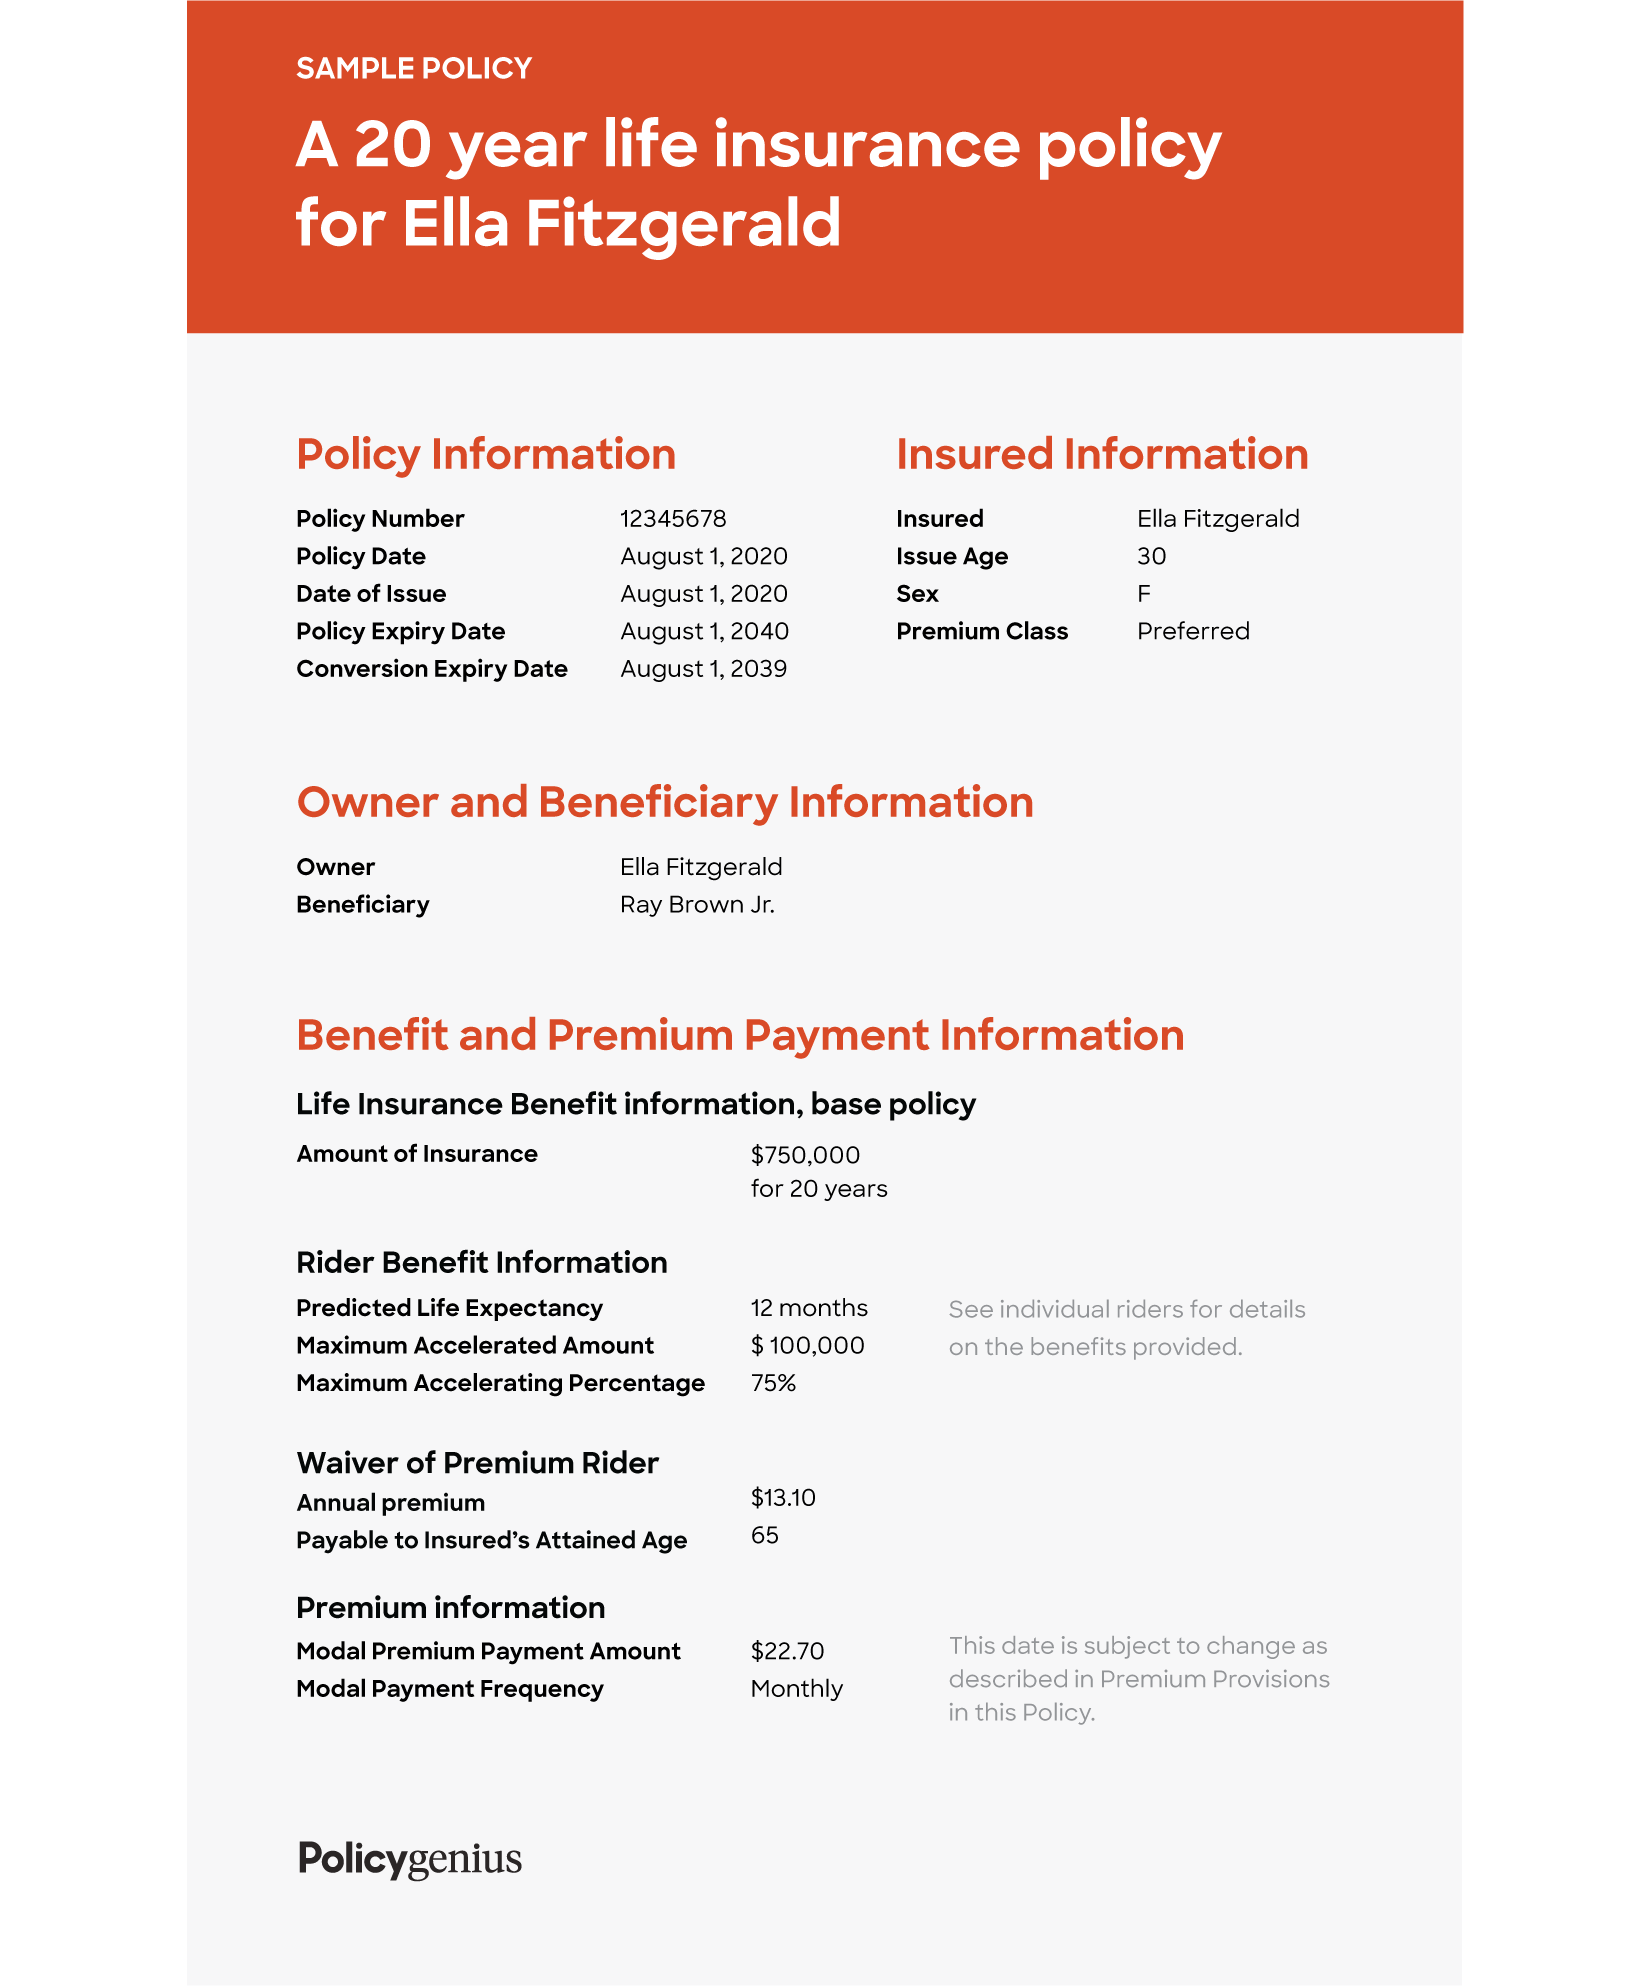
Usually located within the first few pages, the summary page provides a high-level snapshot of the proposed policy. It highlights the initial face amount (death benefit), the planned premium amount and frequency (e.g., annual, monthly), the target underwriting class, and the insured's age and sex. It also provides a quick glance at key milestone years, such as age 65, age 100, or the 20th policy anniversary, showing projected cash surrender values and death benefits under both guaranteed and current assumptions.
2. Tabular Detail Pages (The Ledger)
The ledger is the numerical heart of the illustration. It displays a year-by-year (and sometimes month-by-month for the early years) breakdown of the policy's financial life. Key columns typically include:
- Policy Year / Insured's Age: Tracks the progression of time.
- Out-of-Pocket Premium: The actual cash amount paid into the policy each year.
- Death Benefit: The amount paid to beneficiaries upon the death of the insured. This can be "Level" (Option A, where the cash value grows inside a static face amount) or "Increasing" (Option B, where the death benefit equals the face amount plus the accumulated cash value).
- Cash Surrender Value: The net amount accessible to the policyholder if the contract is terminated, after accounting for any applicable surrender charges or outstanding policy loans.
3. Definition of Terms and Footnotes
Buried near the back of the document are the explanatory notes and definitions. These pages define industry-specific jargon used throughout the ledger. While dry reading, these pages clarify important footnotes regarding how index caps, participation rates, or policy loans are handled.
Types of Prudential Policies and Their Illustrations
Prudential offers various permanent life insurance products, and the structure of the illustration changes depending on the specific product type. Understanding these structural differences prevents misinterpretations.
| Policy Type | Primary Illustration Driver | Key Risk Factor on Illustration |
|---|---|---|
| Universal Life (UL) | Current interest rates set by the carrier | Declining crediting rates forcing higher future premiums |
| Indexed Universal Life (IUL) | External market index performance (e.g., S&P 500) with caps and floors | Aggressive index growth assumptions failing to materialize |
| Variable Universal Life (VUL) | Sub-account investment performance chosen by the policyholder | Market downturns eroding cash value rapidly |
| Whole Life | Dividend scales declared by Prudential based on portfolio earnings | Reduction in dividend scale affecting cash growth |
Universal Life and Indexed Universal Life Illustrations
For products like Prudential's PruLife Index Advantage UL or similar accumulation-focused universal life offerings, the illustration will often show a column reflecting a "midpoint" or "current" interest rate alongside a maximum rate. For IULs, regulators enforce strict caps on how high the illustrated growth rate can be to prevent misleading consumers with unrealistic stock market returns. Even so, illustrating an IUL at a constant hypothetical rate (e.g., 6% or 7% every single year) does not account for sequence-of-returns risk—the reality that markets experience negative years alongside positive ones.
Variable Universal Life Illustrations
VUL illustrations require a mandatory accompanying hypothetical rate of return table, often showing returns of 0%, 4%, 8%, or 12%. Because the underlying sub-accounts are invested directly in equity and fixed-income portfolios, the volatility is much higher. A VUL illustration will vividly demonstrate how a sustained market decline can trigger a policy lapse if cash values drop to zero and additional premium injections are not made.
Analyzing Assumptions and Stress-Testing the Numbers
When reviewing a Prudential life insurance illustration, you must look past the optimistic "current scale" columns and evaluate how robust the policy is under adverse conditions.
The Danger of Over-Optimistic Interest Rates
Many illustrations are run using the carrier's maximum allowable current interest rate or dividend scale. If interest rates fall across the broader economy, Prudential—like any insurance carrier—may lower the crediting rates on its universal life blocks. An illustration running at a 5% interest rate may look vastly superior to one running at the guaranteed 3% rate, but if market yields stay depressed, the policy will underperform the initial projection.
Examining the "Hypothetical Zero" or Guaranteed Column
Always ask your financial professional to run an illustration using guaranteed assumptions only. This column strips away all optimism and shows what happens if interest rates hit their contractual minimum floors and internal costs rise to their maximum contractual ceilings. If the guaranteed column shows the policy collapsing (lapse) after 15 years unless massive premium spikes occur, you are looking at a high-risk scenario.
Premium Financing and Outlay Adjustments
If you are evaluating advanced strategies such as premium financing or flexible funding schedules designed to vanish premiums after a certain number of years (" vanish plans"), examine the sensitivity testing. A small drop in interest rates can shatter a " vanish" timeline, requiring out-of-pocket cash injections years after you expected premium payments to cease.
Common Misconceptions Regarding Life Insurance Illustrations
Misunderstandings surrounding life insurance illustrations have historically led to consumer dissatisfaction and, in severe cases, policy lapses. Recognizing these pitfalls protects your financial interests.
- "The illustration is a quote." Unlike an auto or home insurance quote that locks in a binding price for a fixed term, a life insurance illustration is a projection, not a fixed bid. Actual future performance will vary.
- "The cash value is a guaranteed savings account." While permanent life insurance builds cash value, it is not a bank deposit. Front-end loads, administrative fees, and escalating mortality charges mean that cash values are often low or non-existent in the early policy years.
- "Dividends and interest are guaranteed to stay the same." Non-guaranteed elements fluctuate based on Prudential's investment portfolio performance, mortality experience, and operating expenses.
Frequently Asked Questions
Are life insurance illustrations regulated?
Yes. State insurance commissioners and the National Association of Insurance Commissioners (NAIC) enforce strict model regulations governing how life insurance illustrations must be prepared, presented, and delivered to consumers. These rules prohibit carriers from illustrating historical stock market returns without caps or showing non-guaranteed rates that are higher than current earned rates.
What is the difference between cash value and cash surrender value?
The cash value is the total accumulation of your paid premiums minus fees, plus credited interest or dividends. The cash surrender value is the amount you actually receive if you terminate the contract today, reflecting any applicable surrender charges or outstanding policy loans. Surrender charges typically amortize to zero over a period ranging from 10 to 20 years depending on the product design.
Can my Prudential life insurance policy lapse even if I pay my scheduled premiums?
Yes, under certain circumstances. If you own a universal life or variable universal life policy and the underlying cash value drops too low due to poor index performance, underperforming sub-accounts, or rising cost-of-insurance charges (which increase as you age), the policy can enter a lapse warning phase. Additional premium payments—known as "no-lapse guarantee" premiums or corrective injections—may be required to keep the policy active.
How can I verify that my existing policy is performing in line with its illustration?
You should request an annual policy statement from Prudential. Compare the actual accumulated cash value and current death benefit on your statement against the corresponding year on the original illustration ledger you received when you purchased the policy. If actual performance lags significantly behind the original projection, consult a fiduciary financial advisor to review your funding strategy.
Conclusion and Next Actions
A Prudential life insurance illustration is an indispensable analytical tool, provided it is approached with a healthy dose of skepticism and a clear understanding of its underlying assumptions. Do not rely solely on the most optimistic columns presented by sales software. Instead, request both current and guaranteed projections, examine the impact of fees, and verify that the premium commitment matches your long-term liquidity and cash flow capabilities.
To take the next step, contact your licensed financial professional or Prudential representative and request a "In-Force Illustration" if you already own a policy, or a "Guaranteed-Only Stress Test" if you are currently evaluating a new purchase. Taking this extra step ensures your financial plan remains resilient against economic uncertainty.
Image Gallery
Select an image to open it in a new tab.

Omar Farooq
EdTech Innovation and Virtual Pedagogy Journalist
