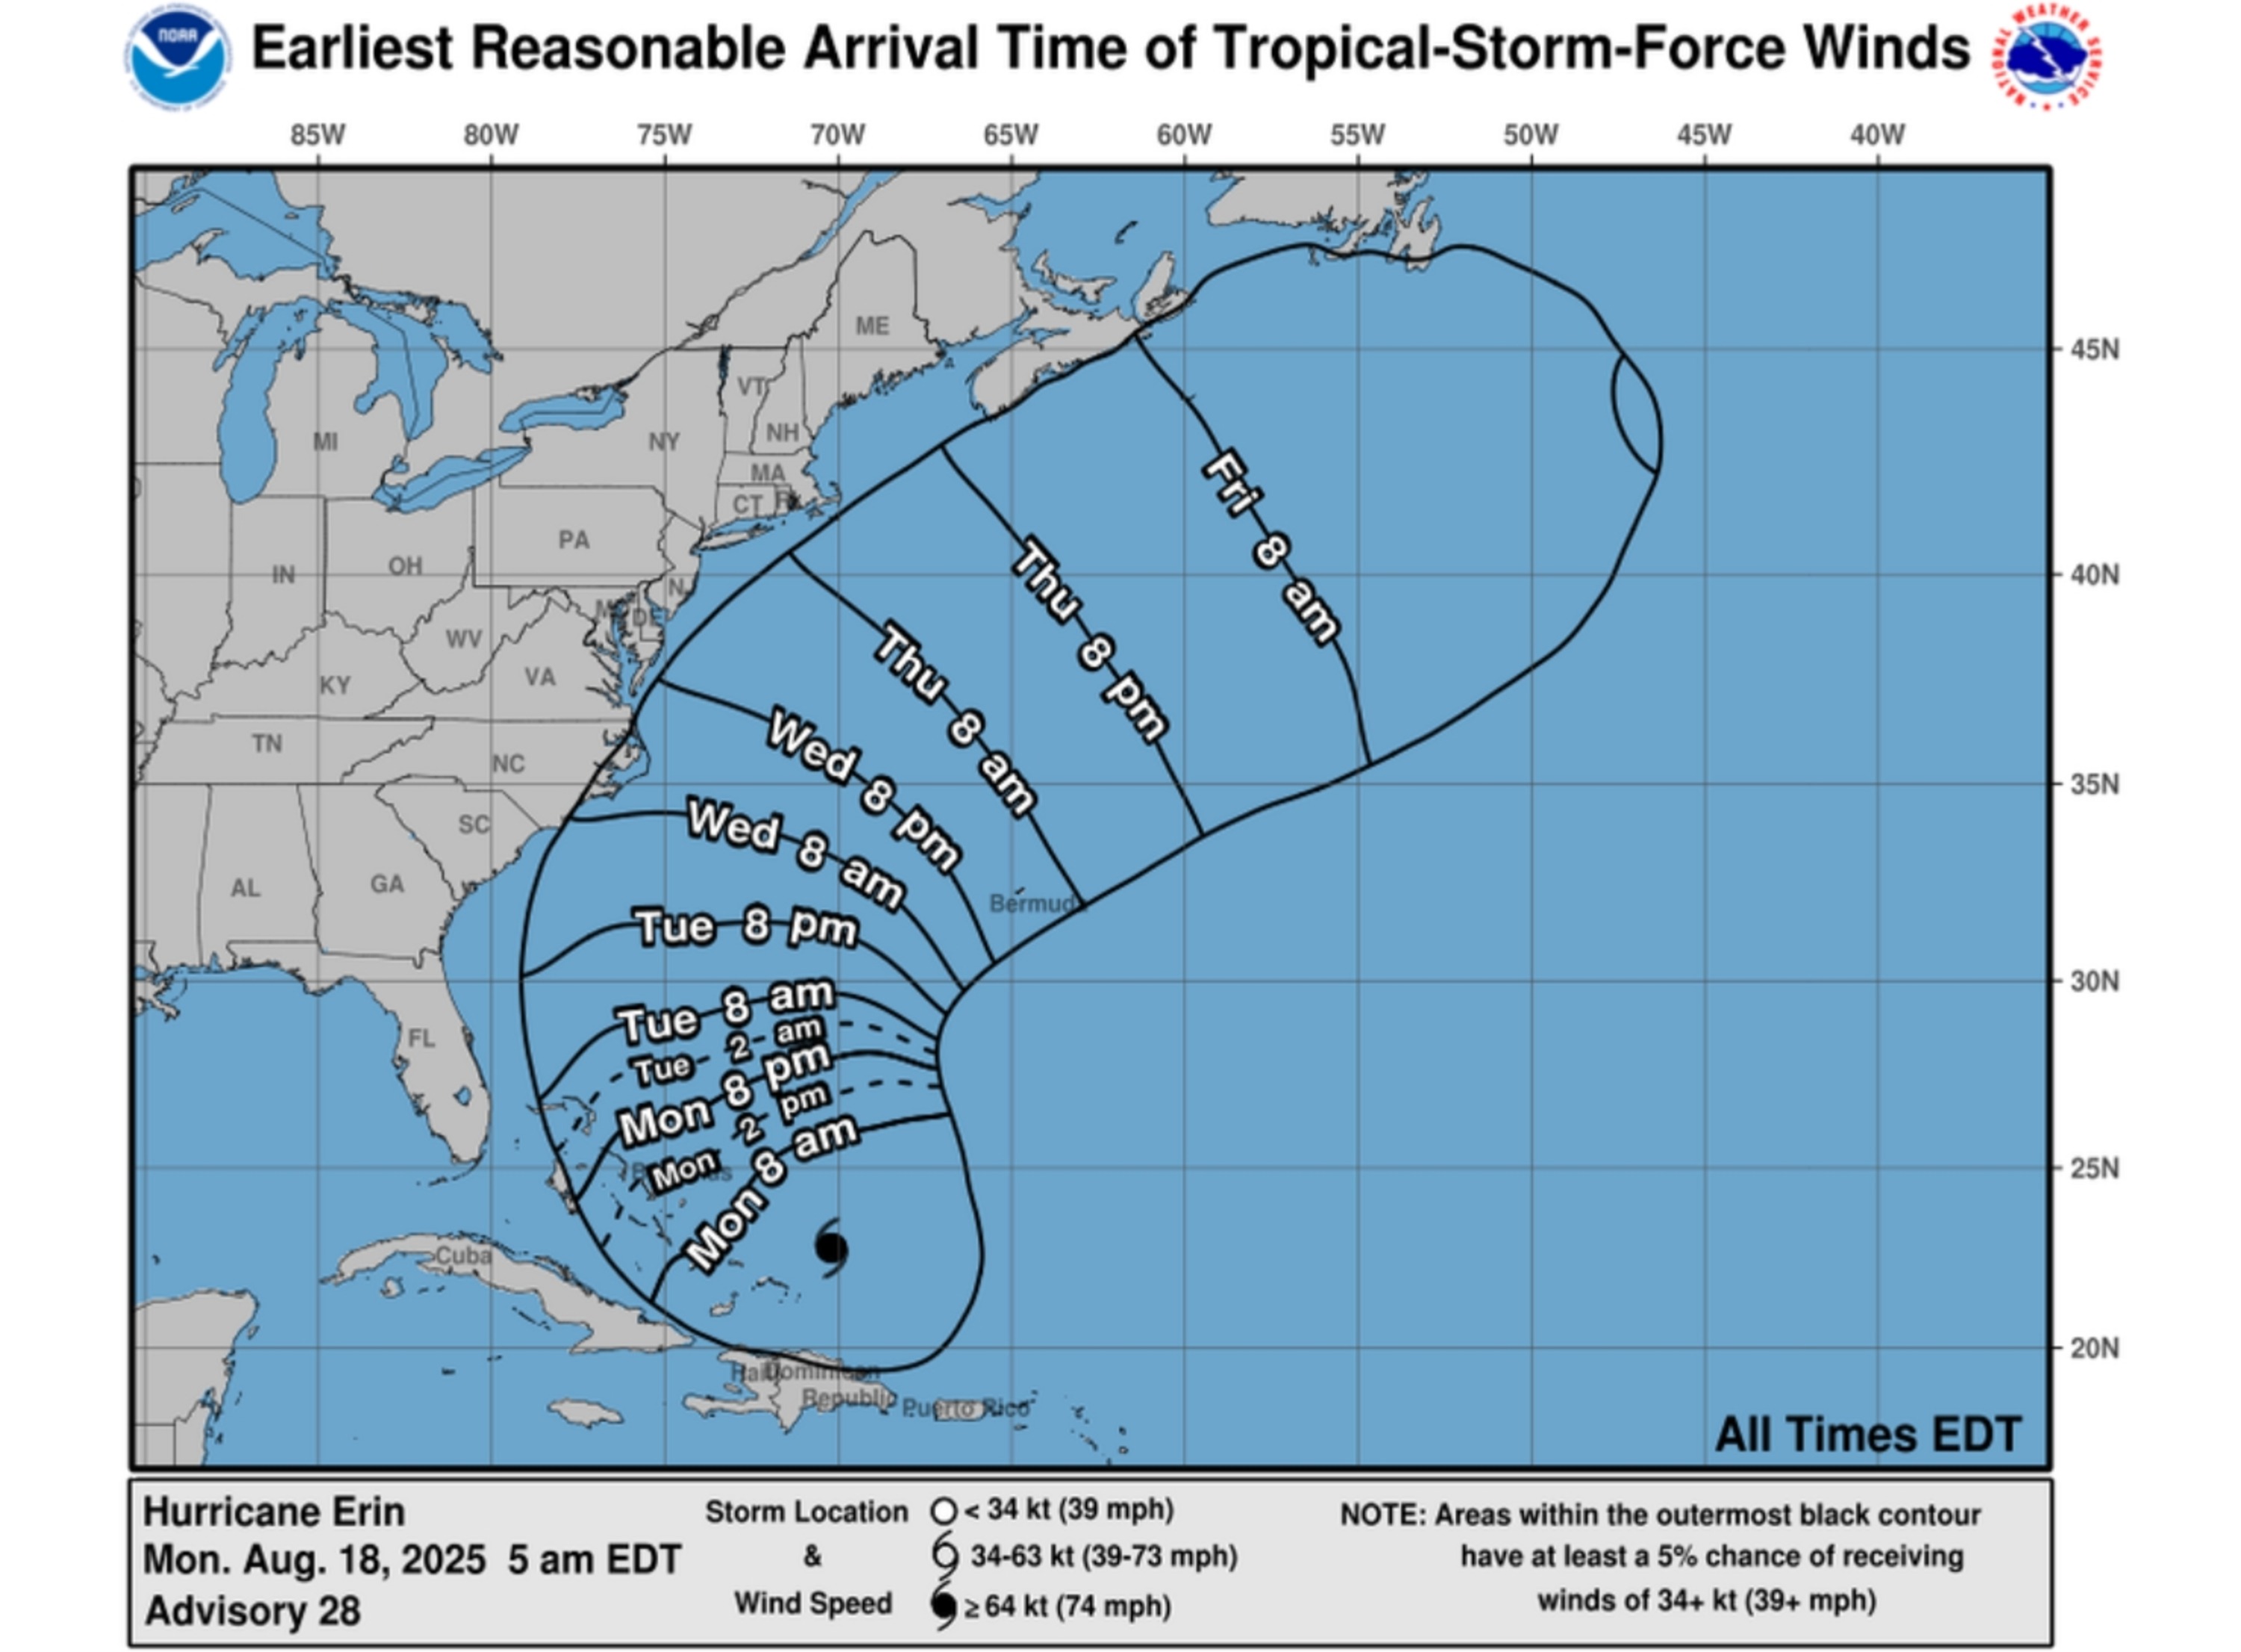
Yes, you can track a hurricane in real time using live, interactive digital maps provided by official meteorological agencies and specialized weather services. These platforms integrate satellite imagery, reconnaissance flight data, and radar networks to plot a storm's position, projected trajectory, and intensity, allowing you to monitor active weather events as they unfold across the globe.
Understanding Real-Time Hurricane Tracking Technology
Hurricane tracking is not a single, isolated process but a complex synthesis of global observation networks. When you view a "live" hurricane map, you are interacting with a visualization engine that pulls data from multiple sources. The primary foundation for this data is the constellation of Geostationary Operational Environmental Satellites (GOES). These satellites provide continuous monitoring of the Earth’s atmosphere, capturing infrared, visible, and water vapor imagery that reveals the structure and movement of tropical cyclones.
However, satellites alone cannot determine the precise internal barometric pressure or wind speeds of a storm. To achieve the high-fidelity tracking you see on professional maps, data from the National Hurricane Center (NHC) and the Joint Typhoon Warning Center (JTWC) is ingested into Geographic Information System (GIS) layers. This includes "reconnaissance" data—information gathered by specialized aircraft that fly directly into the eye of the storm to measure wind speed, pressure, and thermal profiles. When you see a map update its "cone of uncertainty" or shift a path, it is often because new data from these physical observations has been reconciled with atmospheric models, such as the GFS (Global Forecast System) or the ECMWF (European Centre for Medium-Range Weather Forecasts).
Distinguishing Between "Live" and "Model" Data
One of the most frequent sources of confusion for the public is the difference between an observed storm position and a model-based projection. When you use a live map, you must distinguish between these two layers:
- Observed Position (Current Status): This is the "now." It represents where the hurricane is currently located based on the most recent satellite fix or reconnaissance flight. This is the most accurate part of the map.
- Forecast Track (The Cone): This is a projection. The "cone of uncertainty" represents the probable track of the storm’s center. It is critical to understand that the cone does not show the size of the storm; rather, it shows where the eye might move. The further out in time the forecast goes, the wider the cone becomes, reflecting the increasing difficulty in predicting exact meteorological shifts.
Essential Platforms for Reliable Tracking
If you are looking for the most reliable, near-real-time data, you should prioritize government-backed and academic sources. These organizations provide the foundational data that third-party weather apps often redistribute.
- The National Hurricane Center (NHC/NOAA): Located at hurricanes.gov, this is the primary source for Atlantic and Eastern Pacific tropical cyclone advisories. Their maps are the gold standard for public safety information.
- Tropical Tidbits: This site is favored by professionals and enthusiasts for its ability to visualize high-resolution computer models in an interactive, web-based map format. It provides a deeper look at the internal data shaping the forecasts.
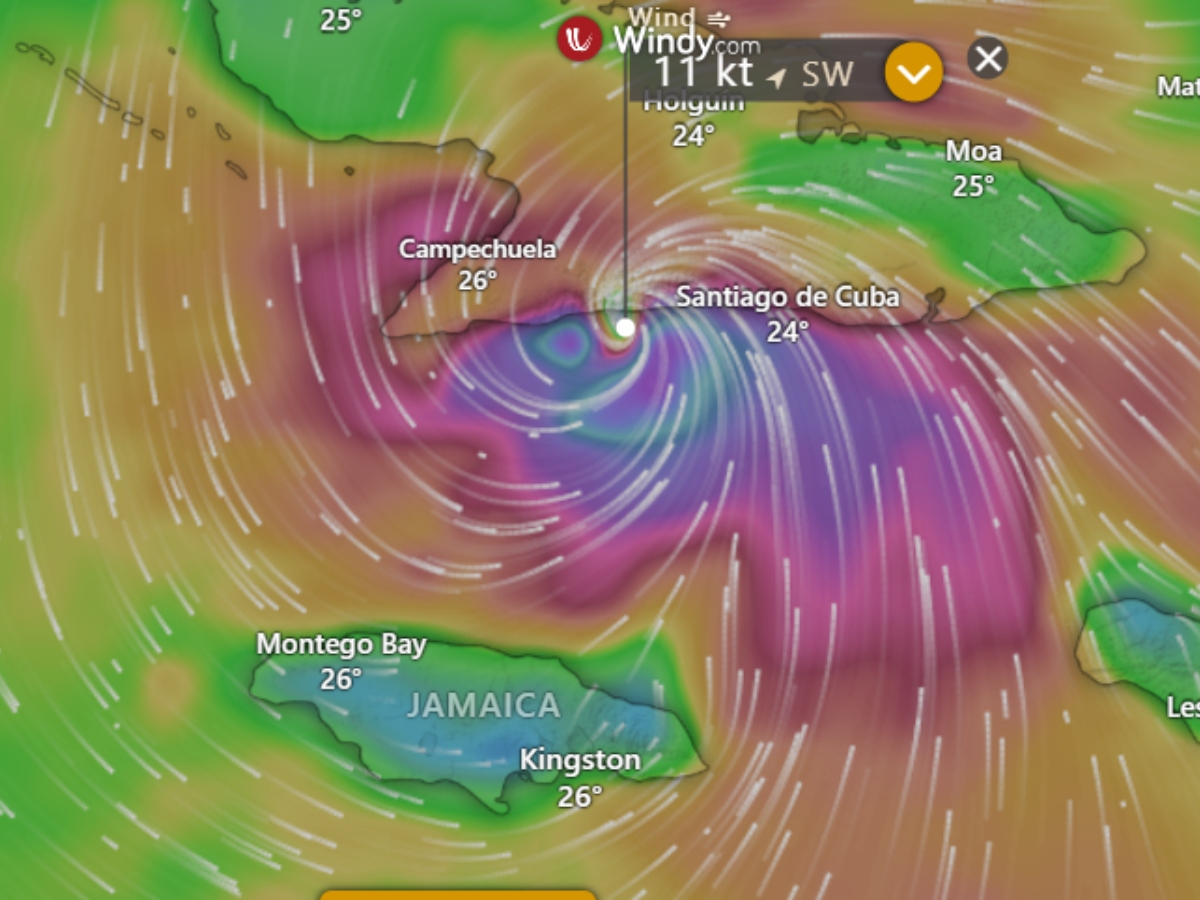
- Windy.com: This platform uses high-resolution visualizations based on the ECMWF and GFS models. It allows you to toggle between different layers, such as wind gusts, pressure, and rain accumulation, providing a comprehensive view of the storm’s potential impact.
- National Weather Service (NWS) Local Offices: If you are in the direct path of a storm, local NWS offices provide localized "live" maps that account for specific regional topography and flooding risks that global maps might miss.
Comparison of Hurricane Tracking Resources
| Resource Type | Data Accuracy | Update Frequency | Best Use Case |
|---|---|---|---|
| Official Government (NHC) | Highest | Every 6 hours | Official alerts, evacuation zones |
| Meteorological Apps (Windy) | High | Real-time to Hourly | Visualization, wind patterns |
| News/Media Maps | Moderate | Varies | General overview, news context |
| Satellite Direct (NOAA) | Raw Data | Near Continuous | Analyzing cloud structure |
The Limitations of Live Mapping
While technology has advanced significantly by 2026, it is vital to acknowledge the limitations of "live" tracking. Maps cannot predict "rapid intensification"—a phenomenon where a hurricane gains significant wind speed in a short period due to localized ocean heat content or shifts in vertical wind shear.
Furthermore, real-time maps are limited by the latency of data transmission and processing. A map might show the storm's position as of 1:00 PM, but the actual weather conditions at your specific location could be changing minute-by-minute. Maps should never be used as the sole basis for life-safety decisions. Always cross-reference map data with emergency management alerts from your local government. If a mandatory evacuation order is issued for your area, leave based on official instructions rather than interpreting the storm’s path on a map yourself.
How to Use Hurricane Maps During an Emergency
When you are actively monitoring an approaching hurricane, follow these steps to ensure you are getting the most relevant information:
- Check the Advisory Number: Every official NHC bulletin is numbered. Ensure you are looking at the most recent bulletin number (e.g., Advisory 15 vs. Advisory 14).
- Examine the Timing: Look at the timestamp on the map graphic. If the data is more than a few hours old, refresh your browser or move to a live satellite feed.
- Identify Local Hazards: Do not focus solely on the "track line" of the center. Use the layers on your map to identify the "wind field"—the area where tropical-storm-force winds are currently occurring. This is often more important than the location of the eye.
- Toggle Precipitation Layers: Flooding is often the deadliest aspect of a hurricane. If your chosen mapping tool allows, turn on the "rain" or "precipitation" layer to see where the heaviest bands of rainfall are focused.
Frequently Asked Questions
Are live hurricane maps always accurate? Live maps are accurate regarding the past and present location of the storm, but they are only projections regarding the future. The further into the future a map predicts, the higher the margin of error. Always prioritize official bulletins over visual projections.
Why does the hurricane track keep shifting on the map? Hurricane paths are dictated by complex steering currents in the upper atmosphere. Small changes in high-altitude winds, the size of a nearby high-pressure system, or the way the storm interacts with land can cause the predicted path to shift. Maps are updated as new data is fed into the supercomputers running the forecast models.
Can I see the wind speed on a live map? Most professional maps allow you to toggle on a wind overlay. However, note that these usually show sustained wind speeds. Always remember that localized "gusts" can be significantly higher than the sustained winds indicated by the general forecast.
Is there a cost to access professional-grade hurricane tracking? Most, if not all, of the most reliable tracking data comes from publicly funded government agencies and is available for free. While some commercial weather apps offer "premium" features, the raw data used for tracking is generally accessible via the National Hurricane Center and international meteorological agencies without charge.
What is the "Cone of Uncertainty"? The cone represents the average track forecast error over the past several years. It is designed to show the historical range of where the center of the storm may track. It does not indicate where weather hazards like storm surge or flooding will occur; those risks often extend well outside the cone.
Ensuring Your Safety
Technology is a powerful tool for situational awareness, but it is not a replacement for local emergency instructions. If you are preparing for a storm, ensure you have multiple ways to receive alerts, such as a NOAA weather radio, local text notification services, and physical battery-powered radios.
While you can use tools like Windy.com or the official NHC portal to visualize the path of a hurricane in real time, always remember that these maps are diagnostic tools for meteorologists and decision-makers. In any emergency situation, prioritize the information provided by local authorities regarding evacuations, shelter locations, and emergency resources.
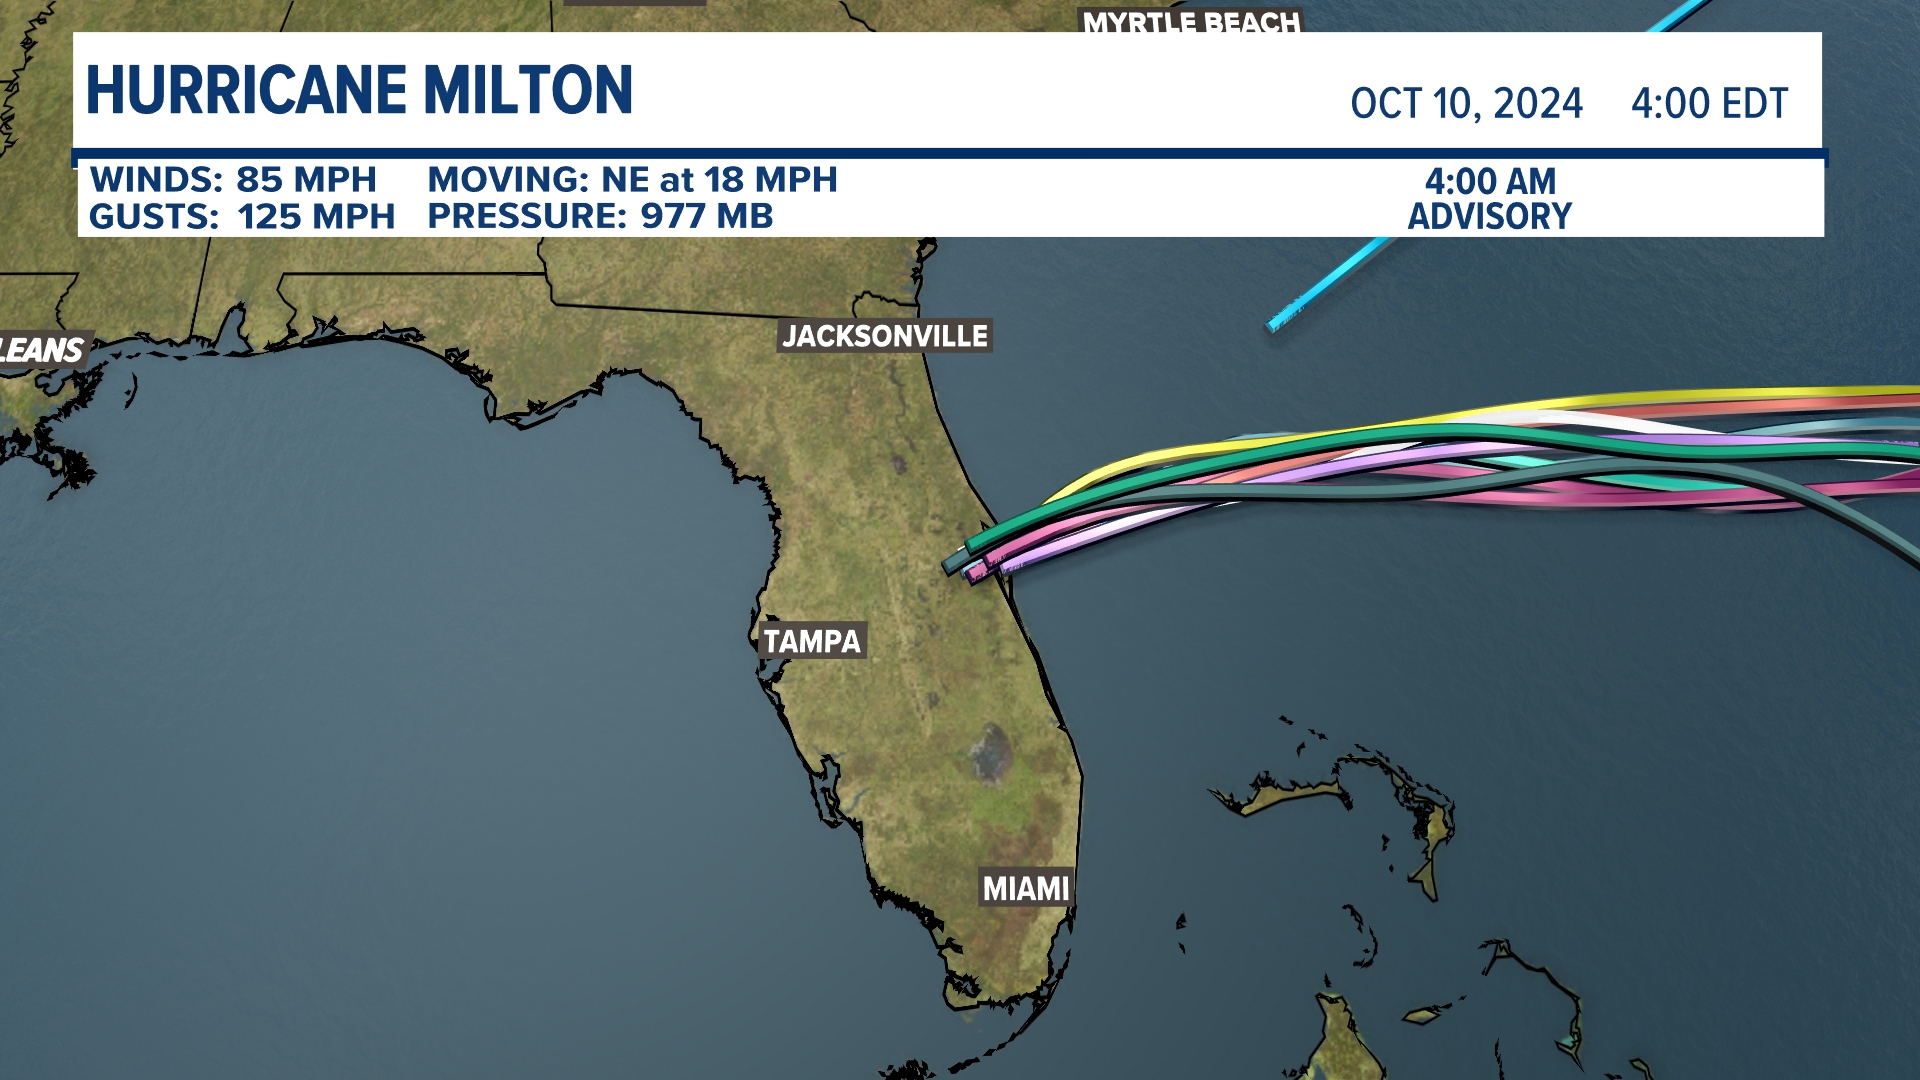
Image Gallery
Select an image to open it in a new tab.
Declan O'Connor
Higher Education and Campus Culture Reporter
